Functional Glycomics homepage

This website is only for archival purposes and some information on this may be outdated. If you have any questions please Contact the NCFG.

Cell Data Tissue Data
participating investigator
patient code
tissue
mouse type
species
mice colony code
mouse strain
glycan type analyzed
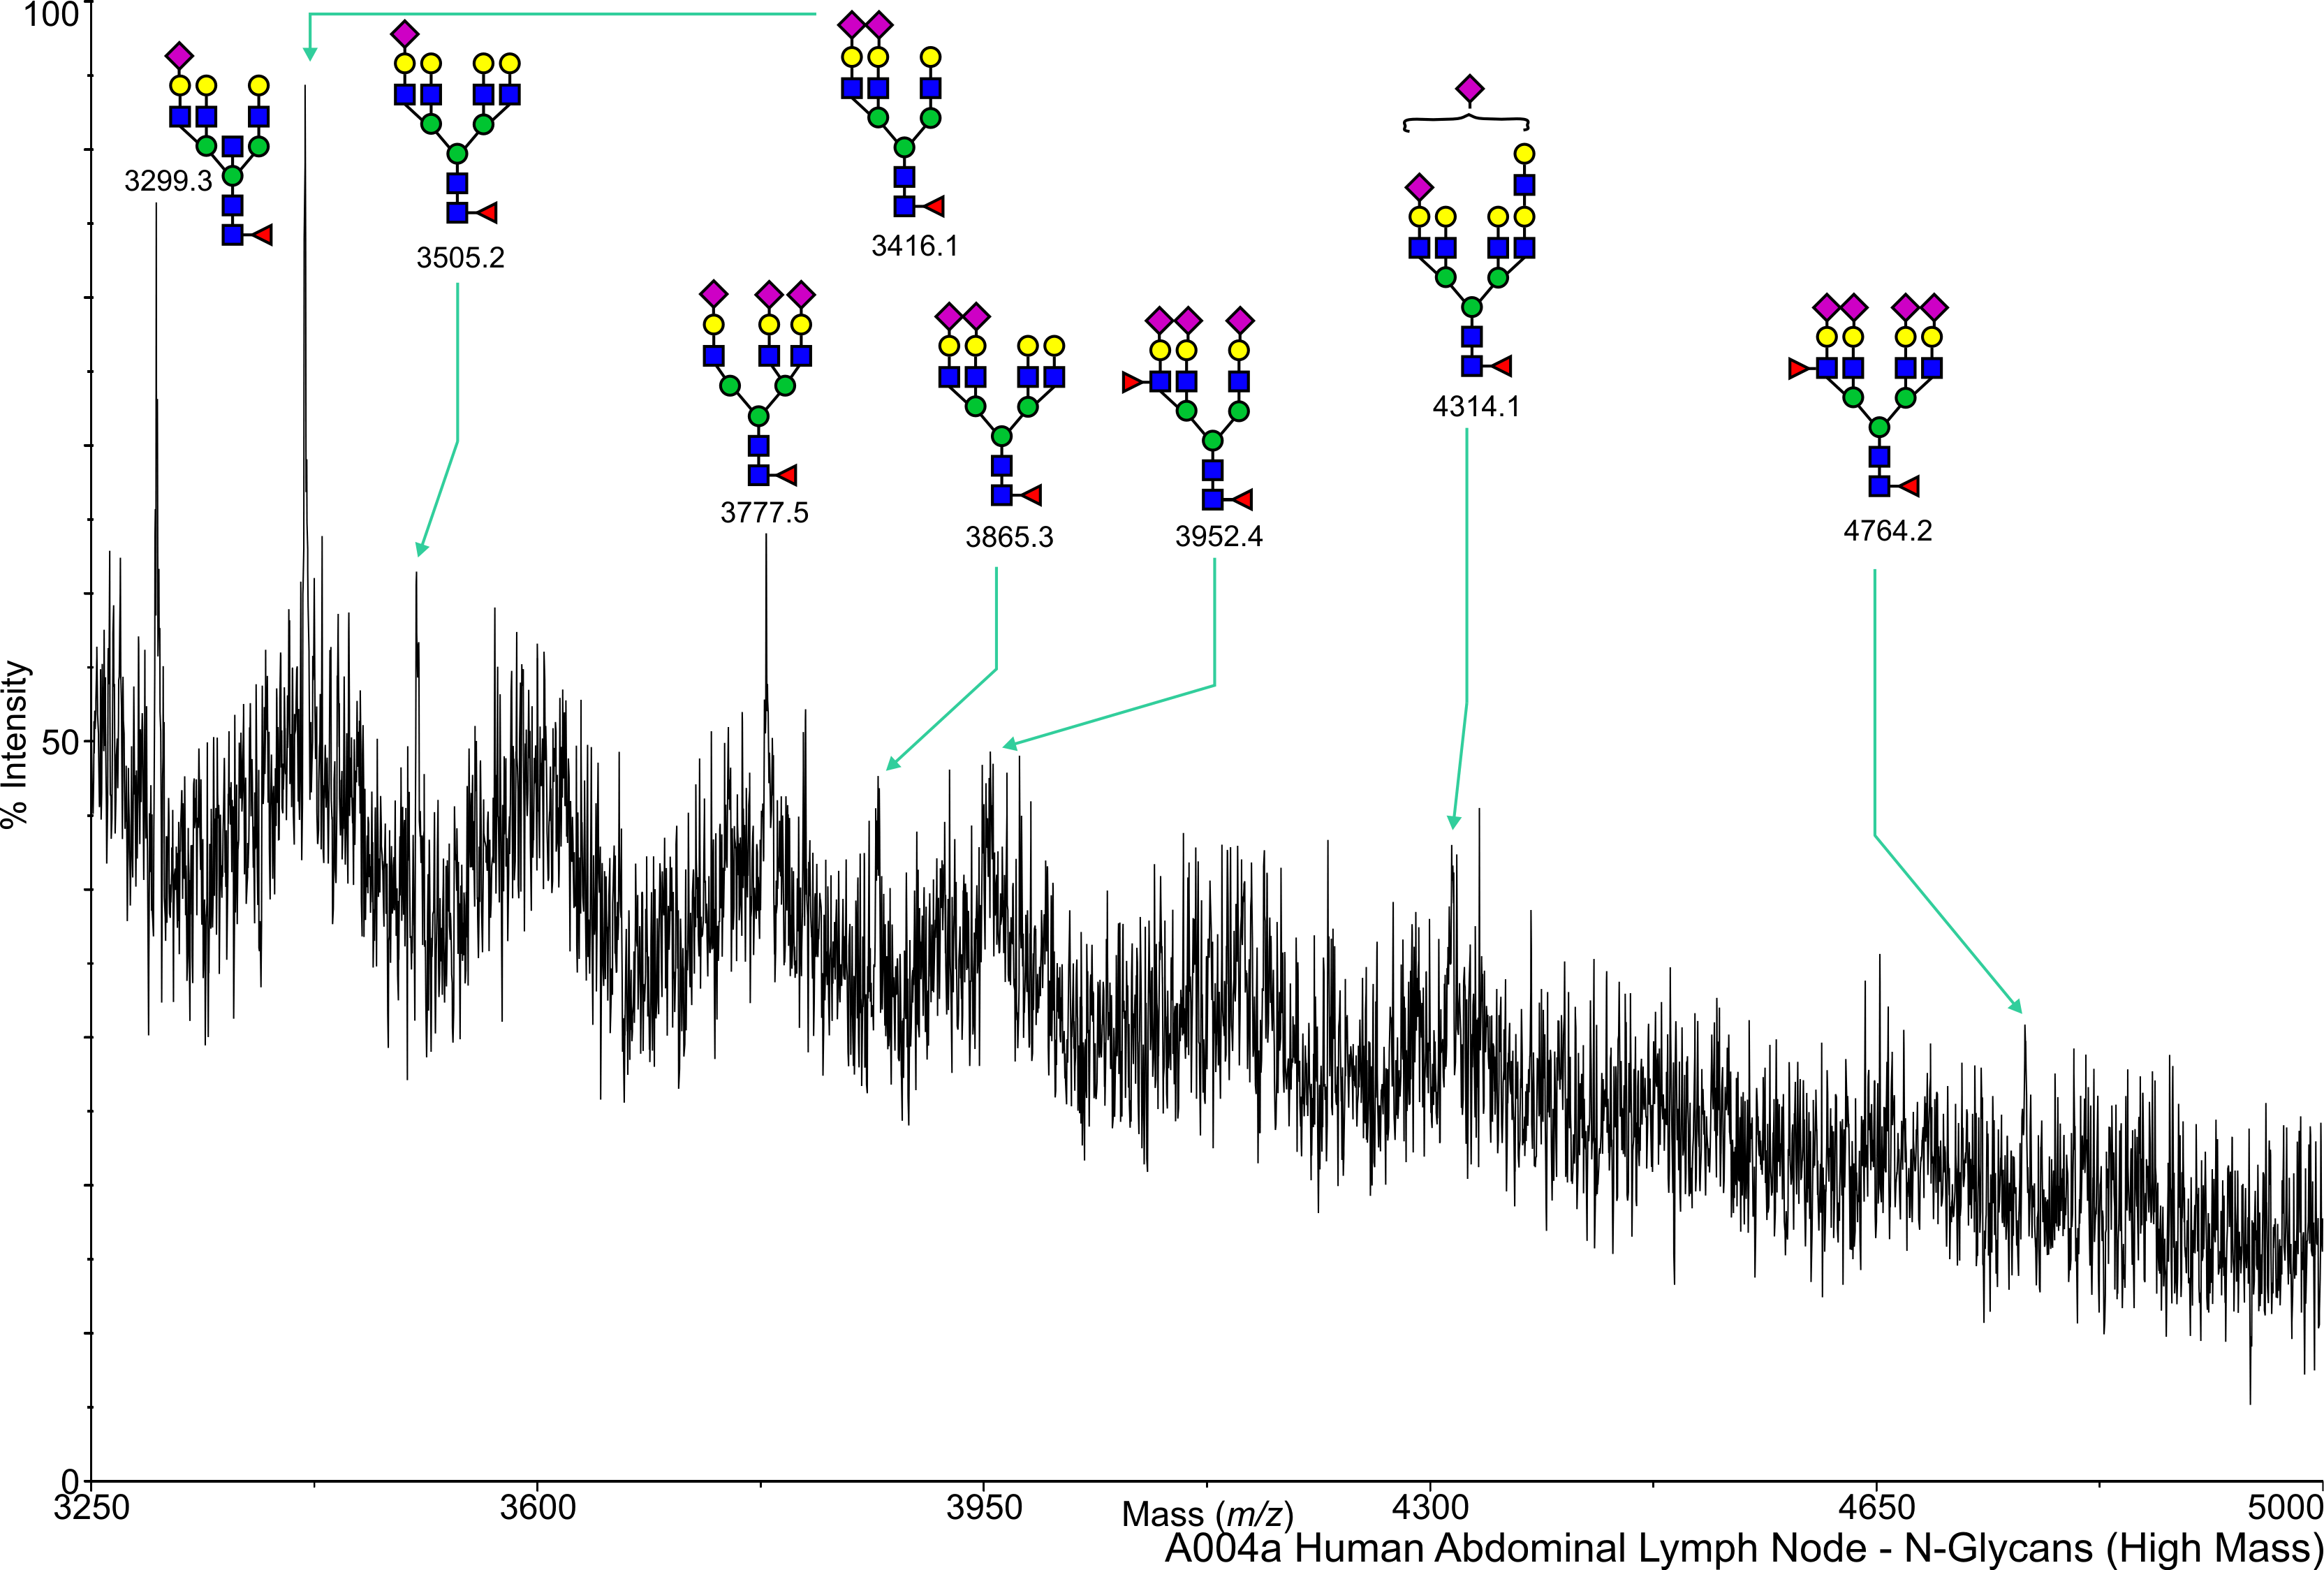
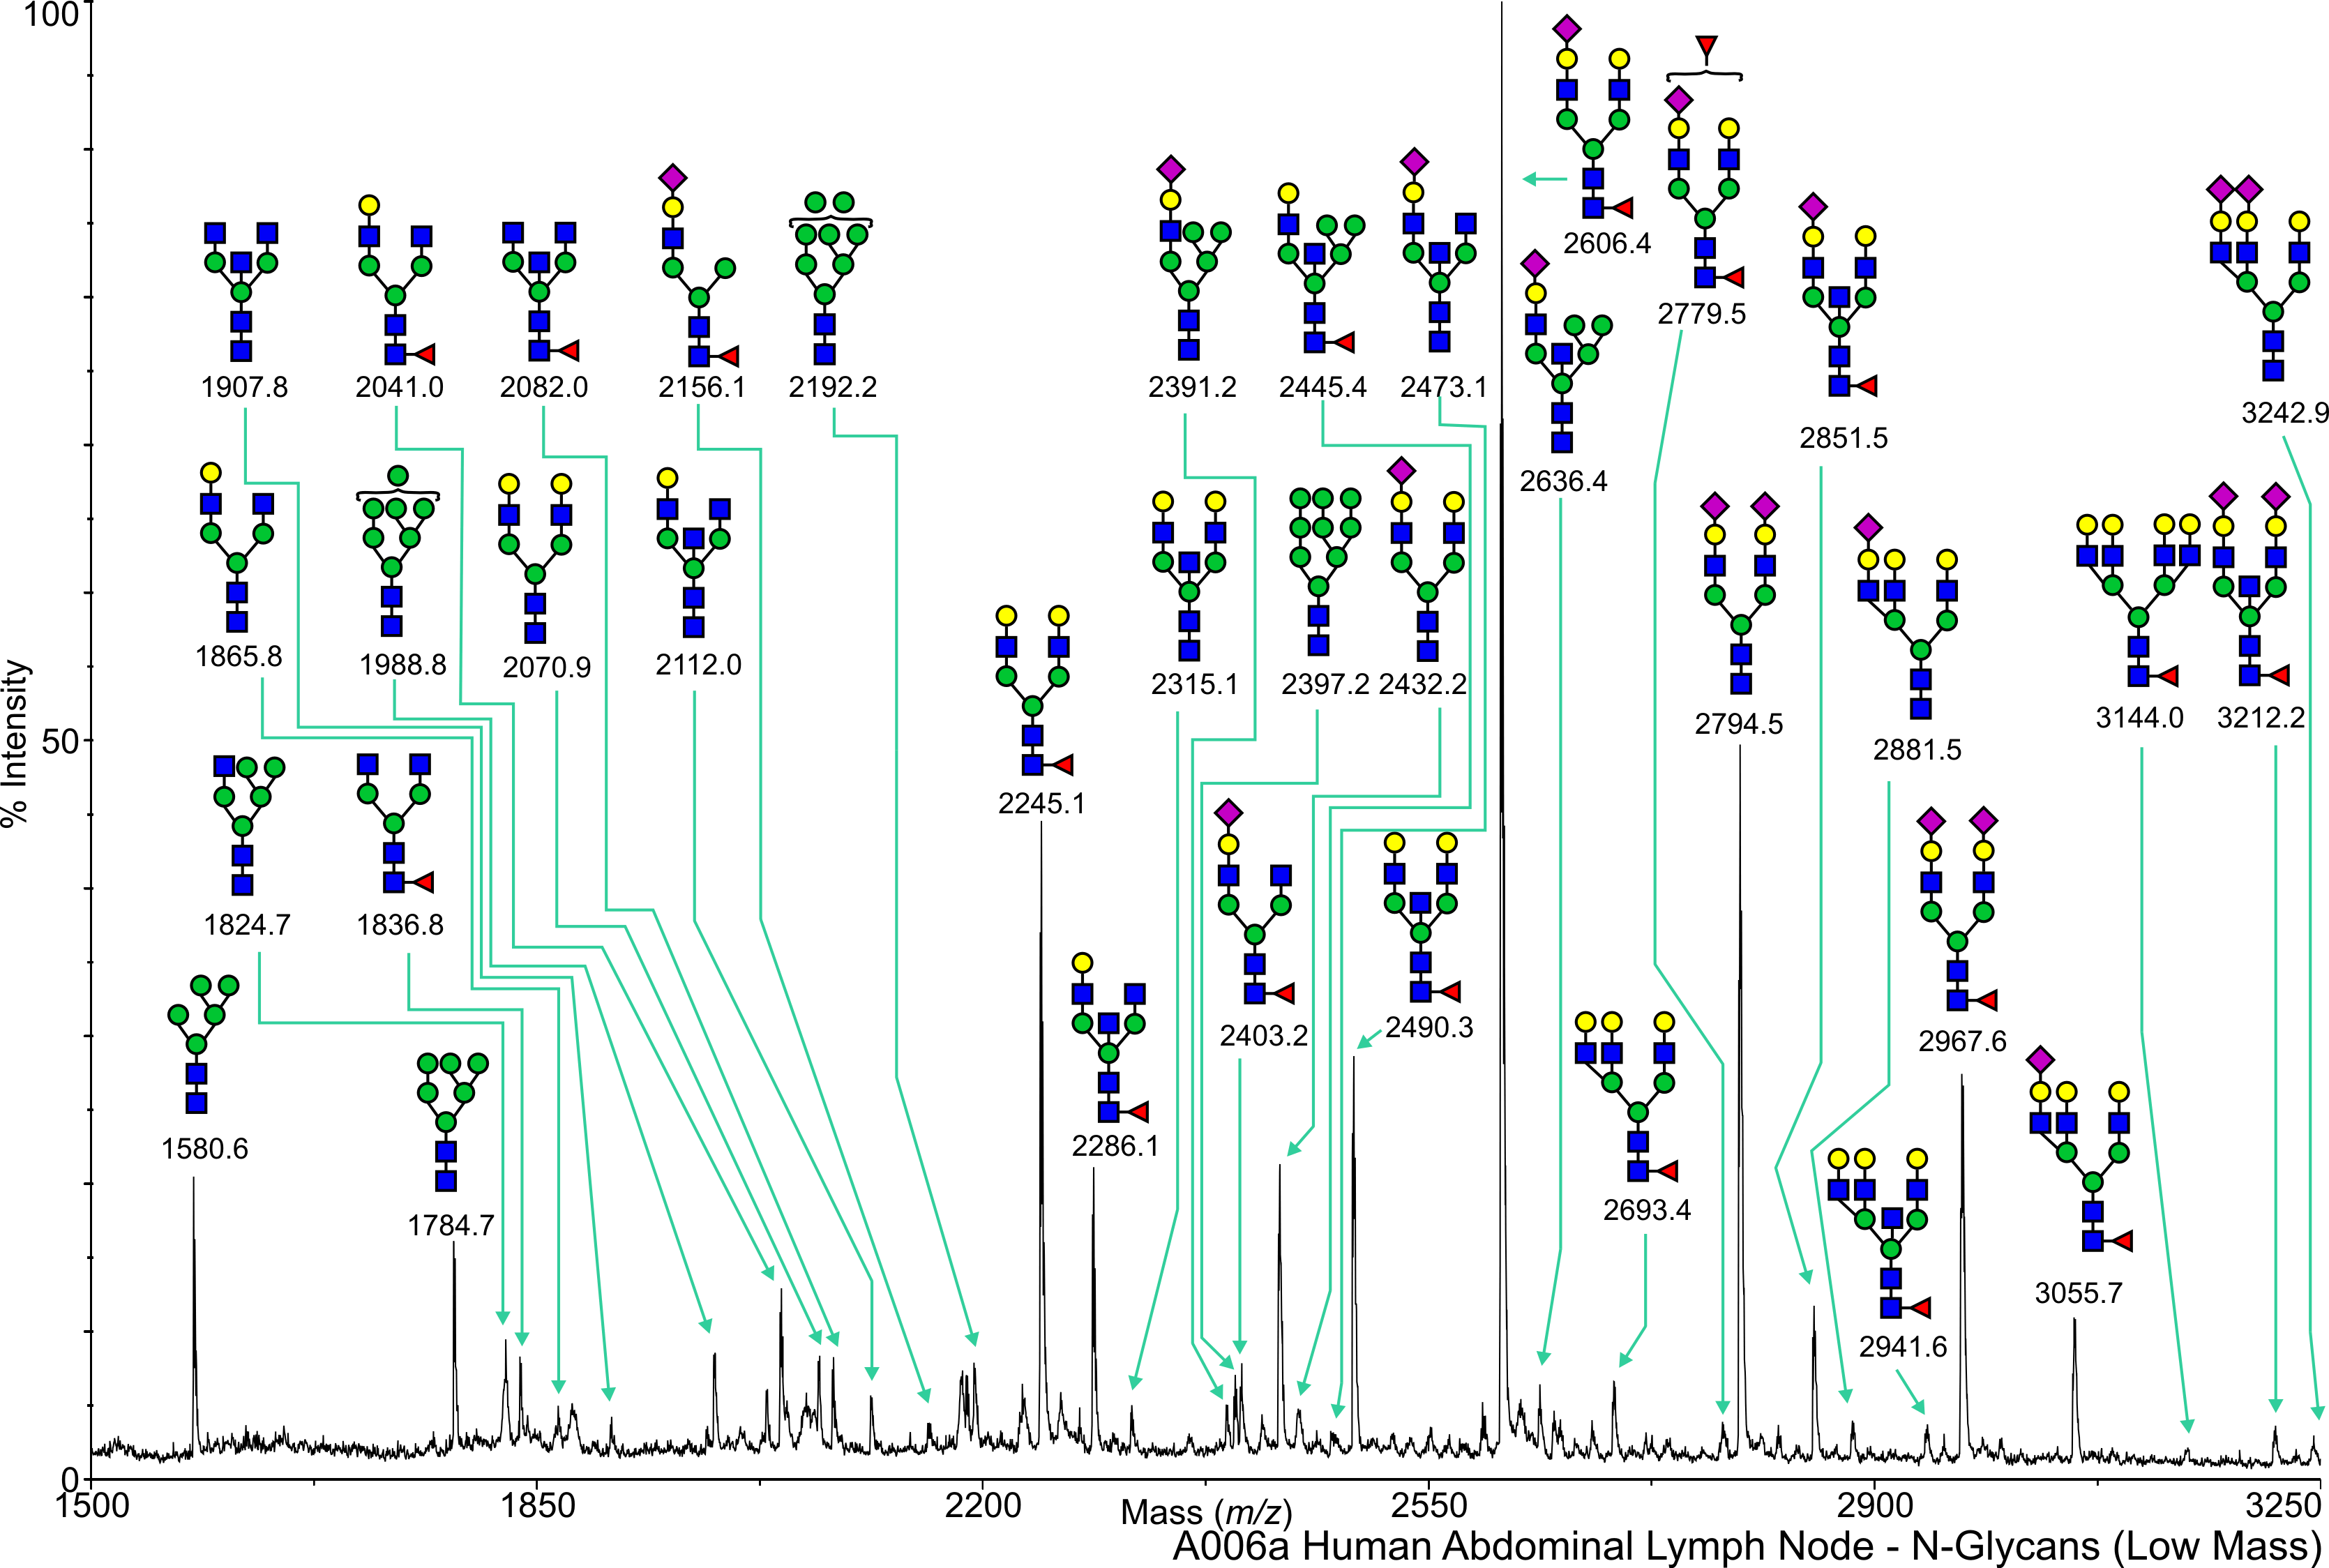
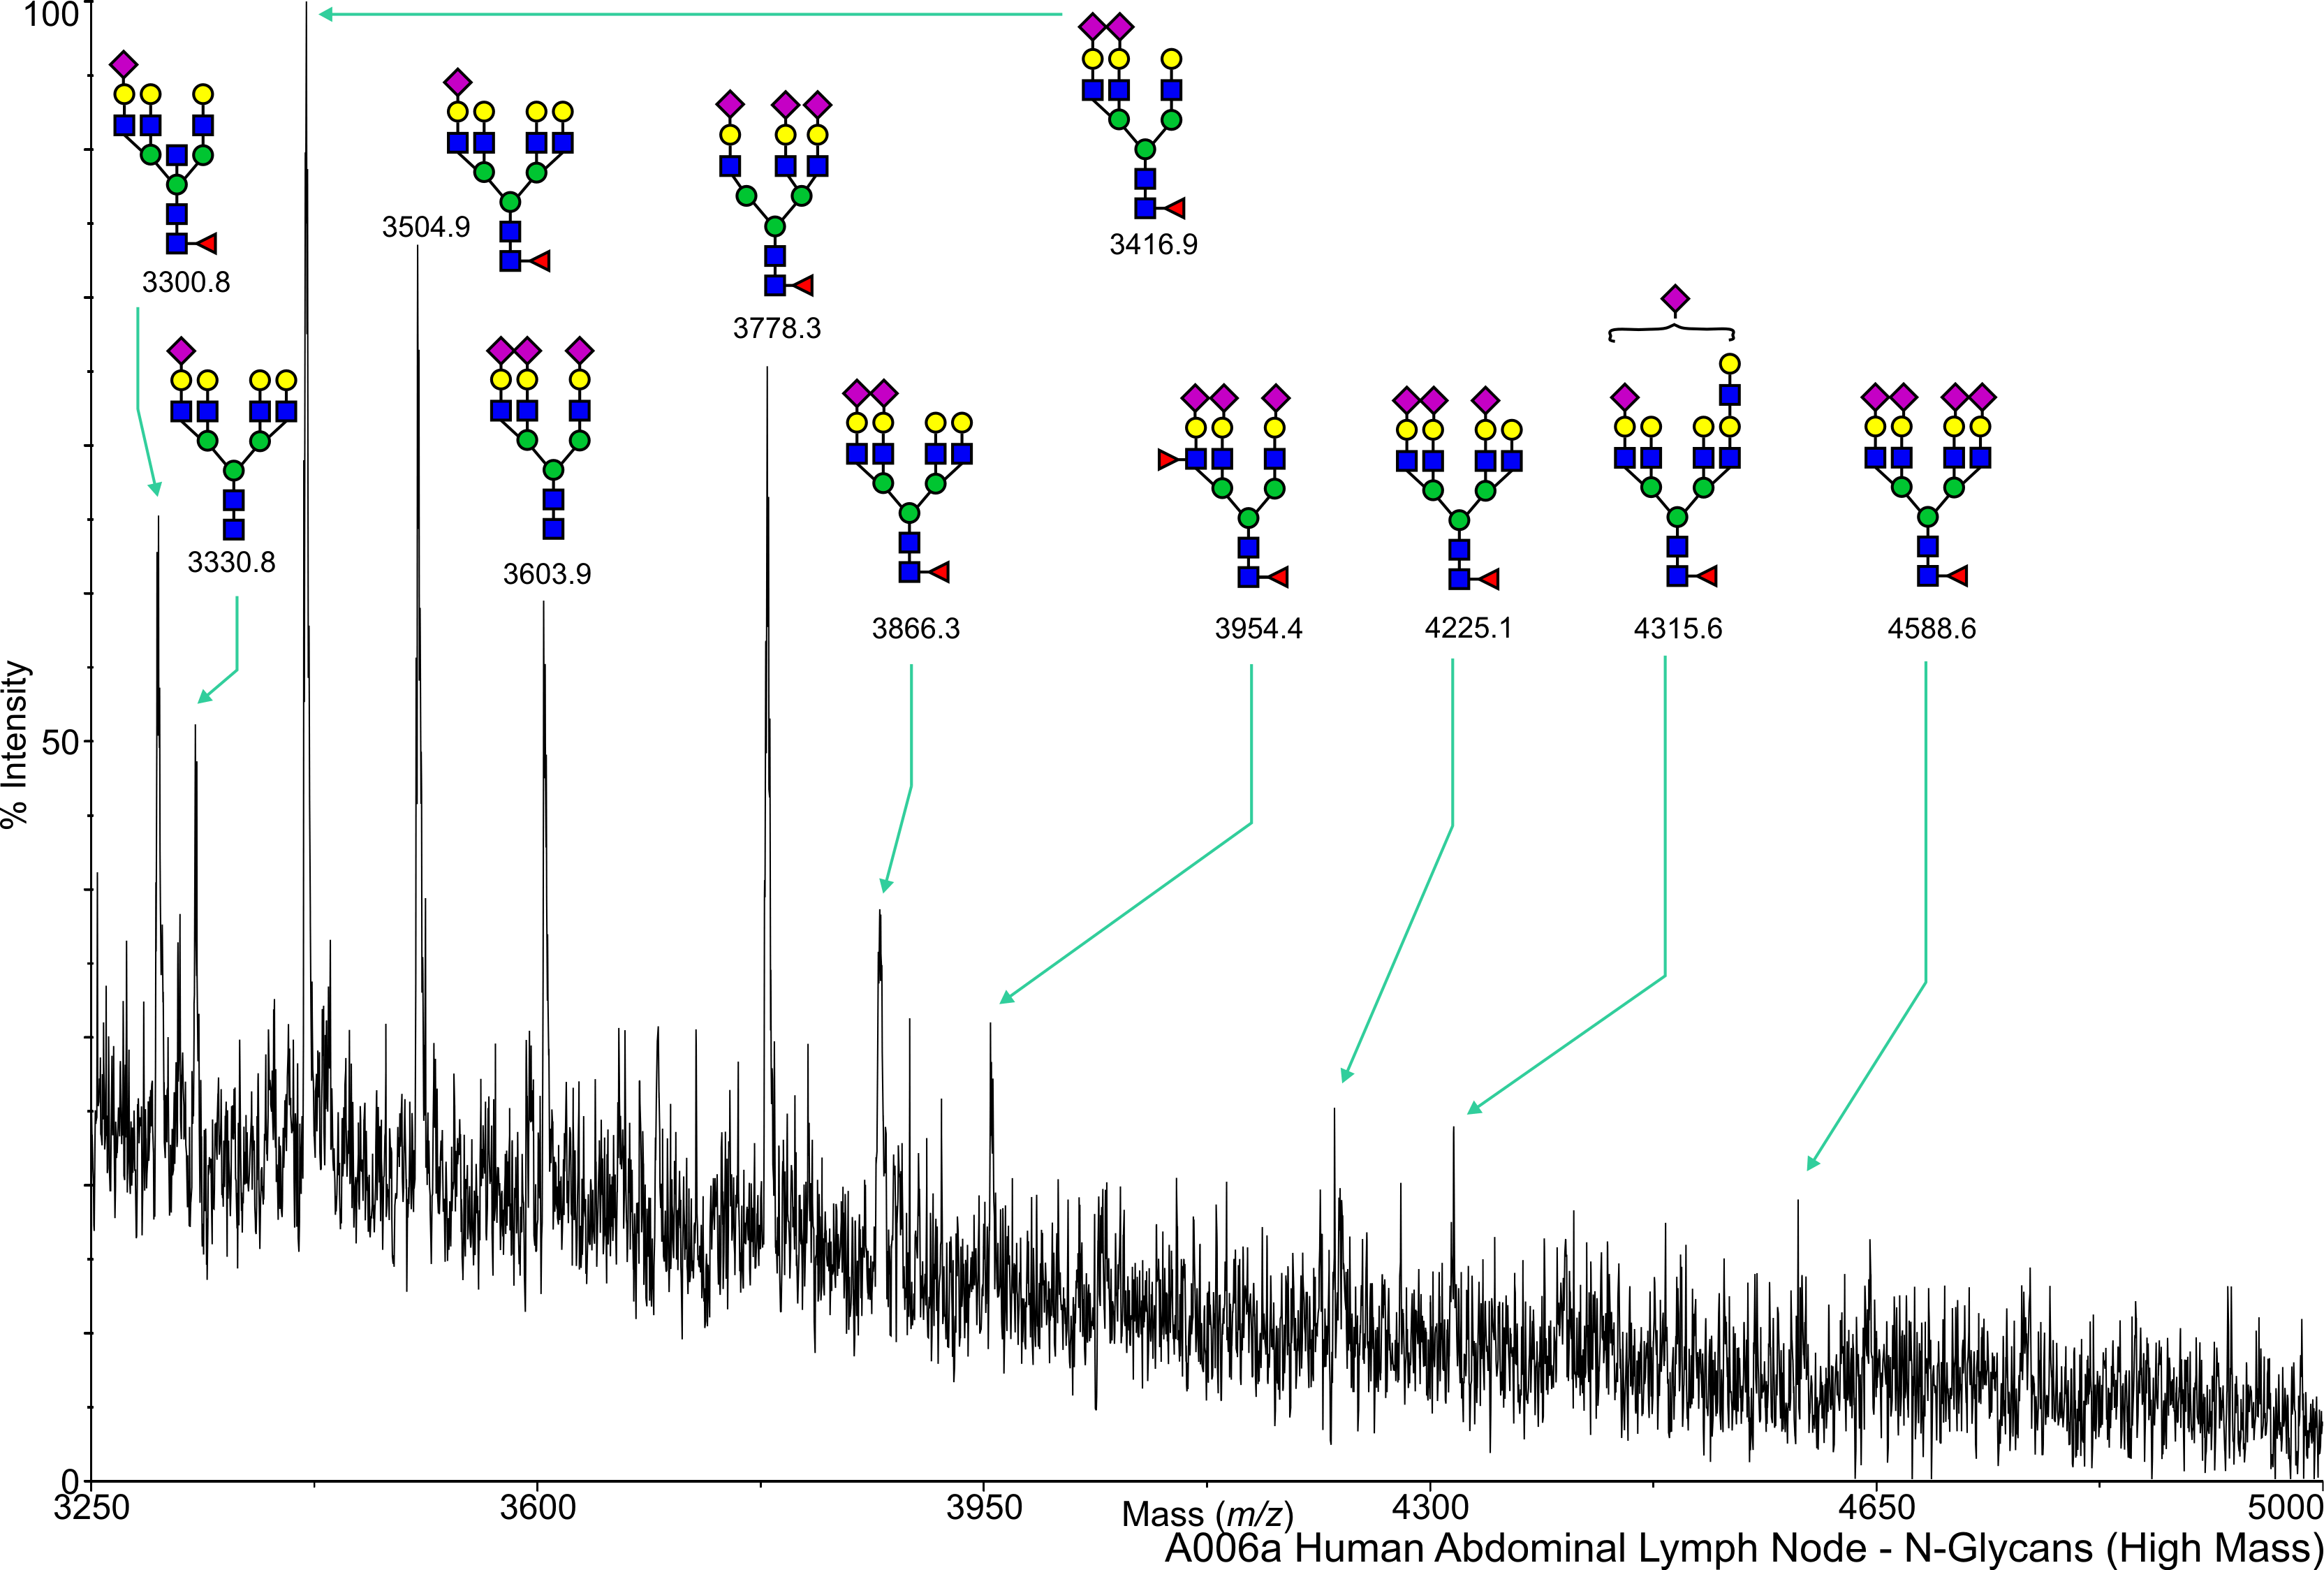
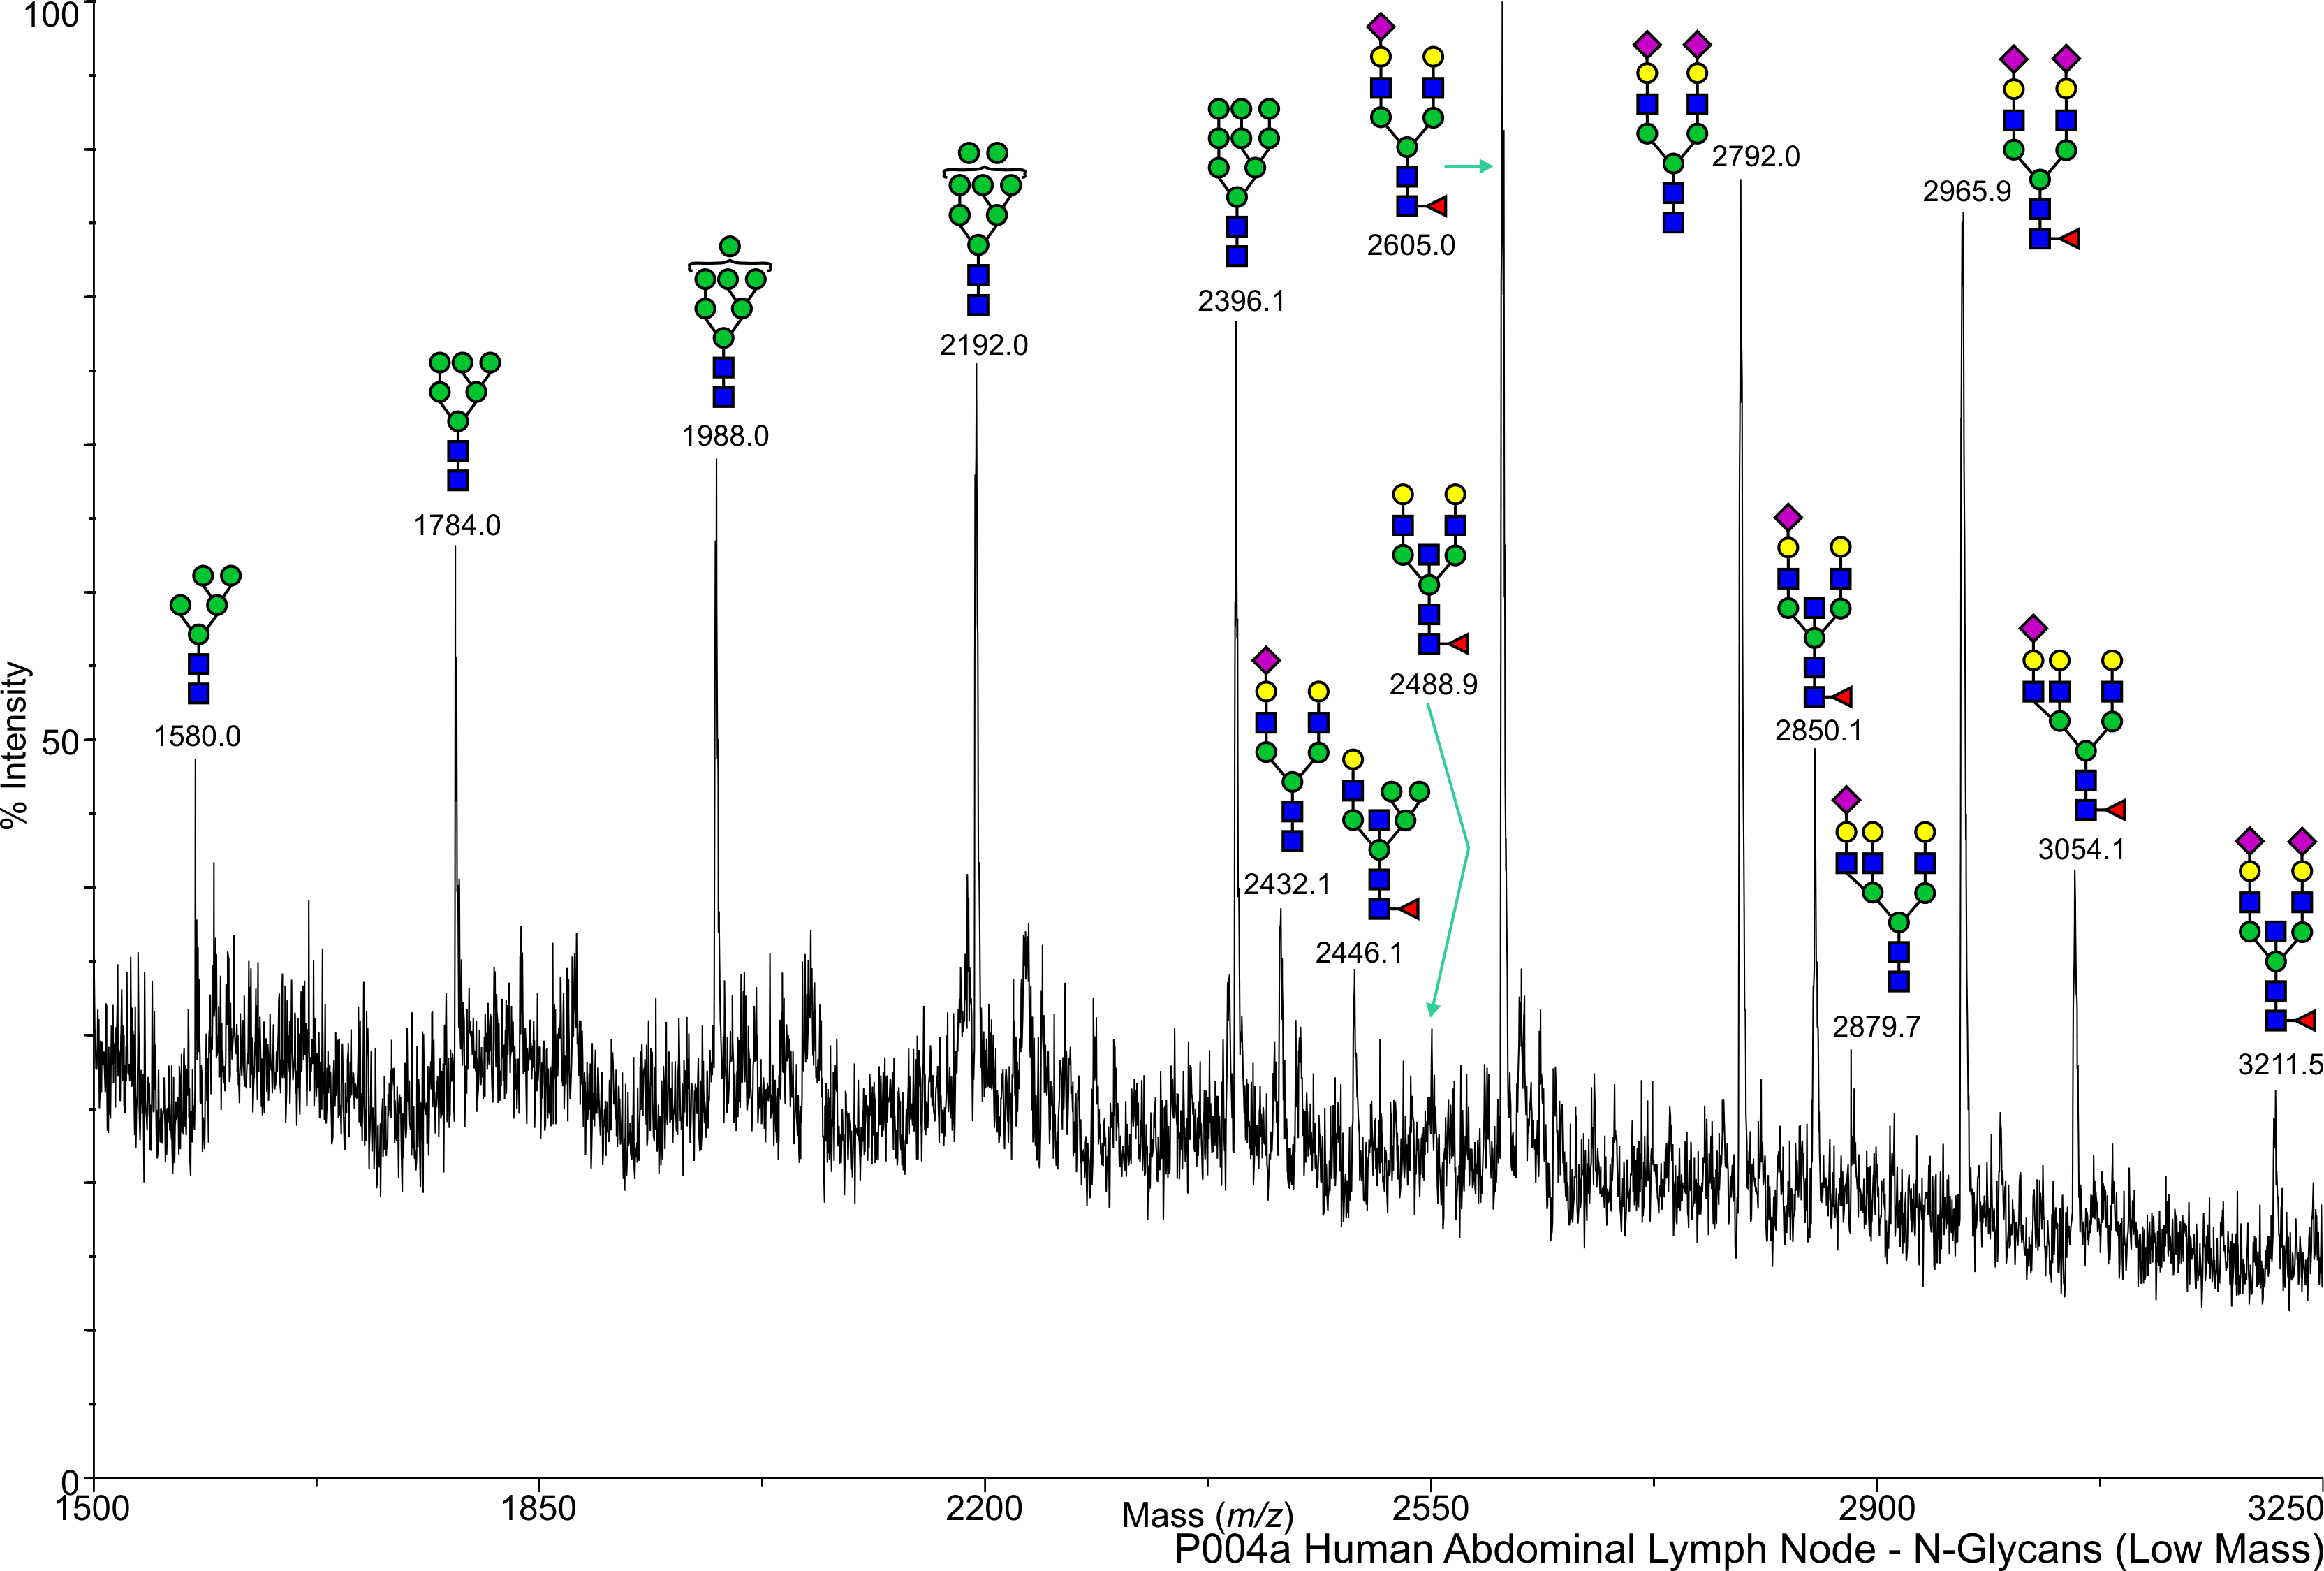
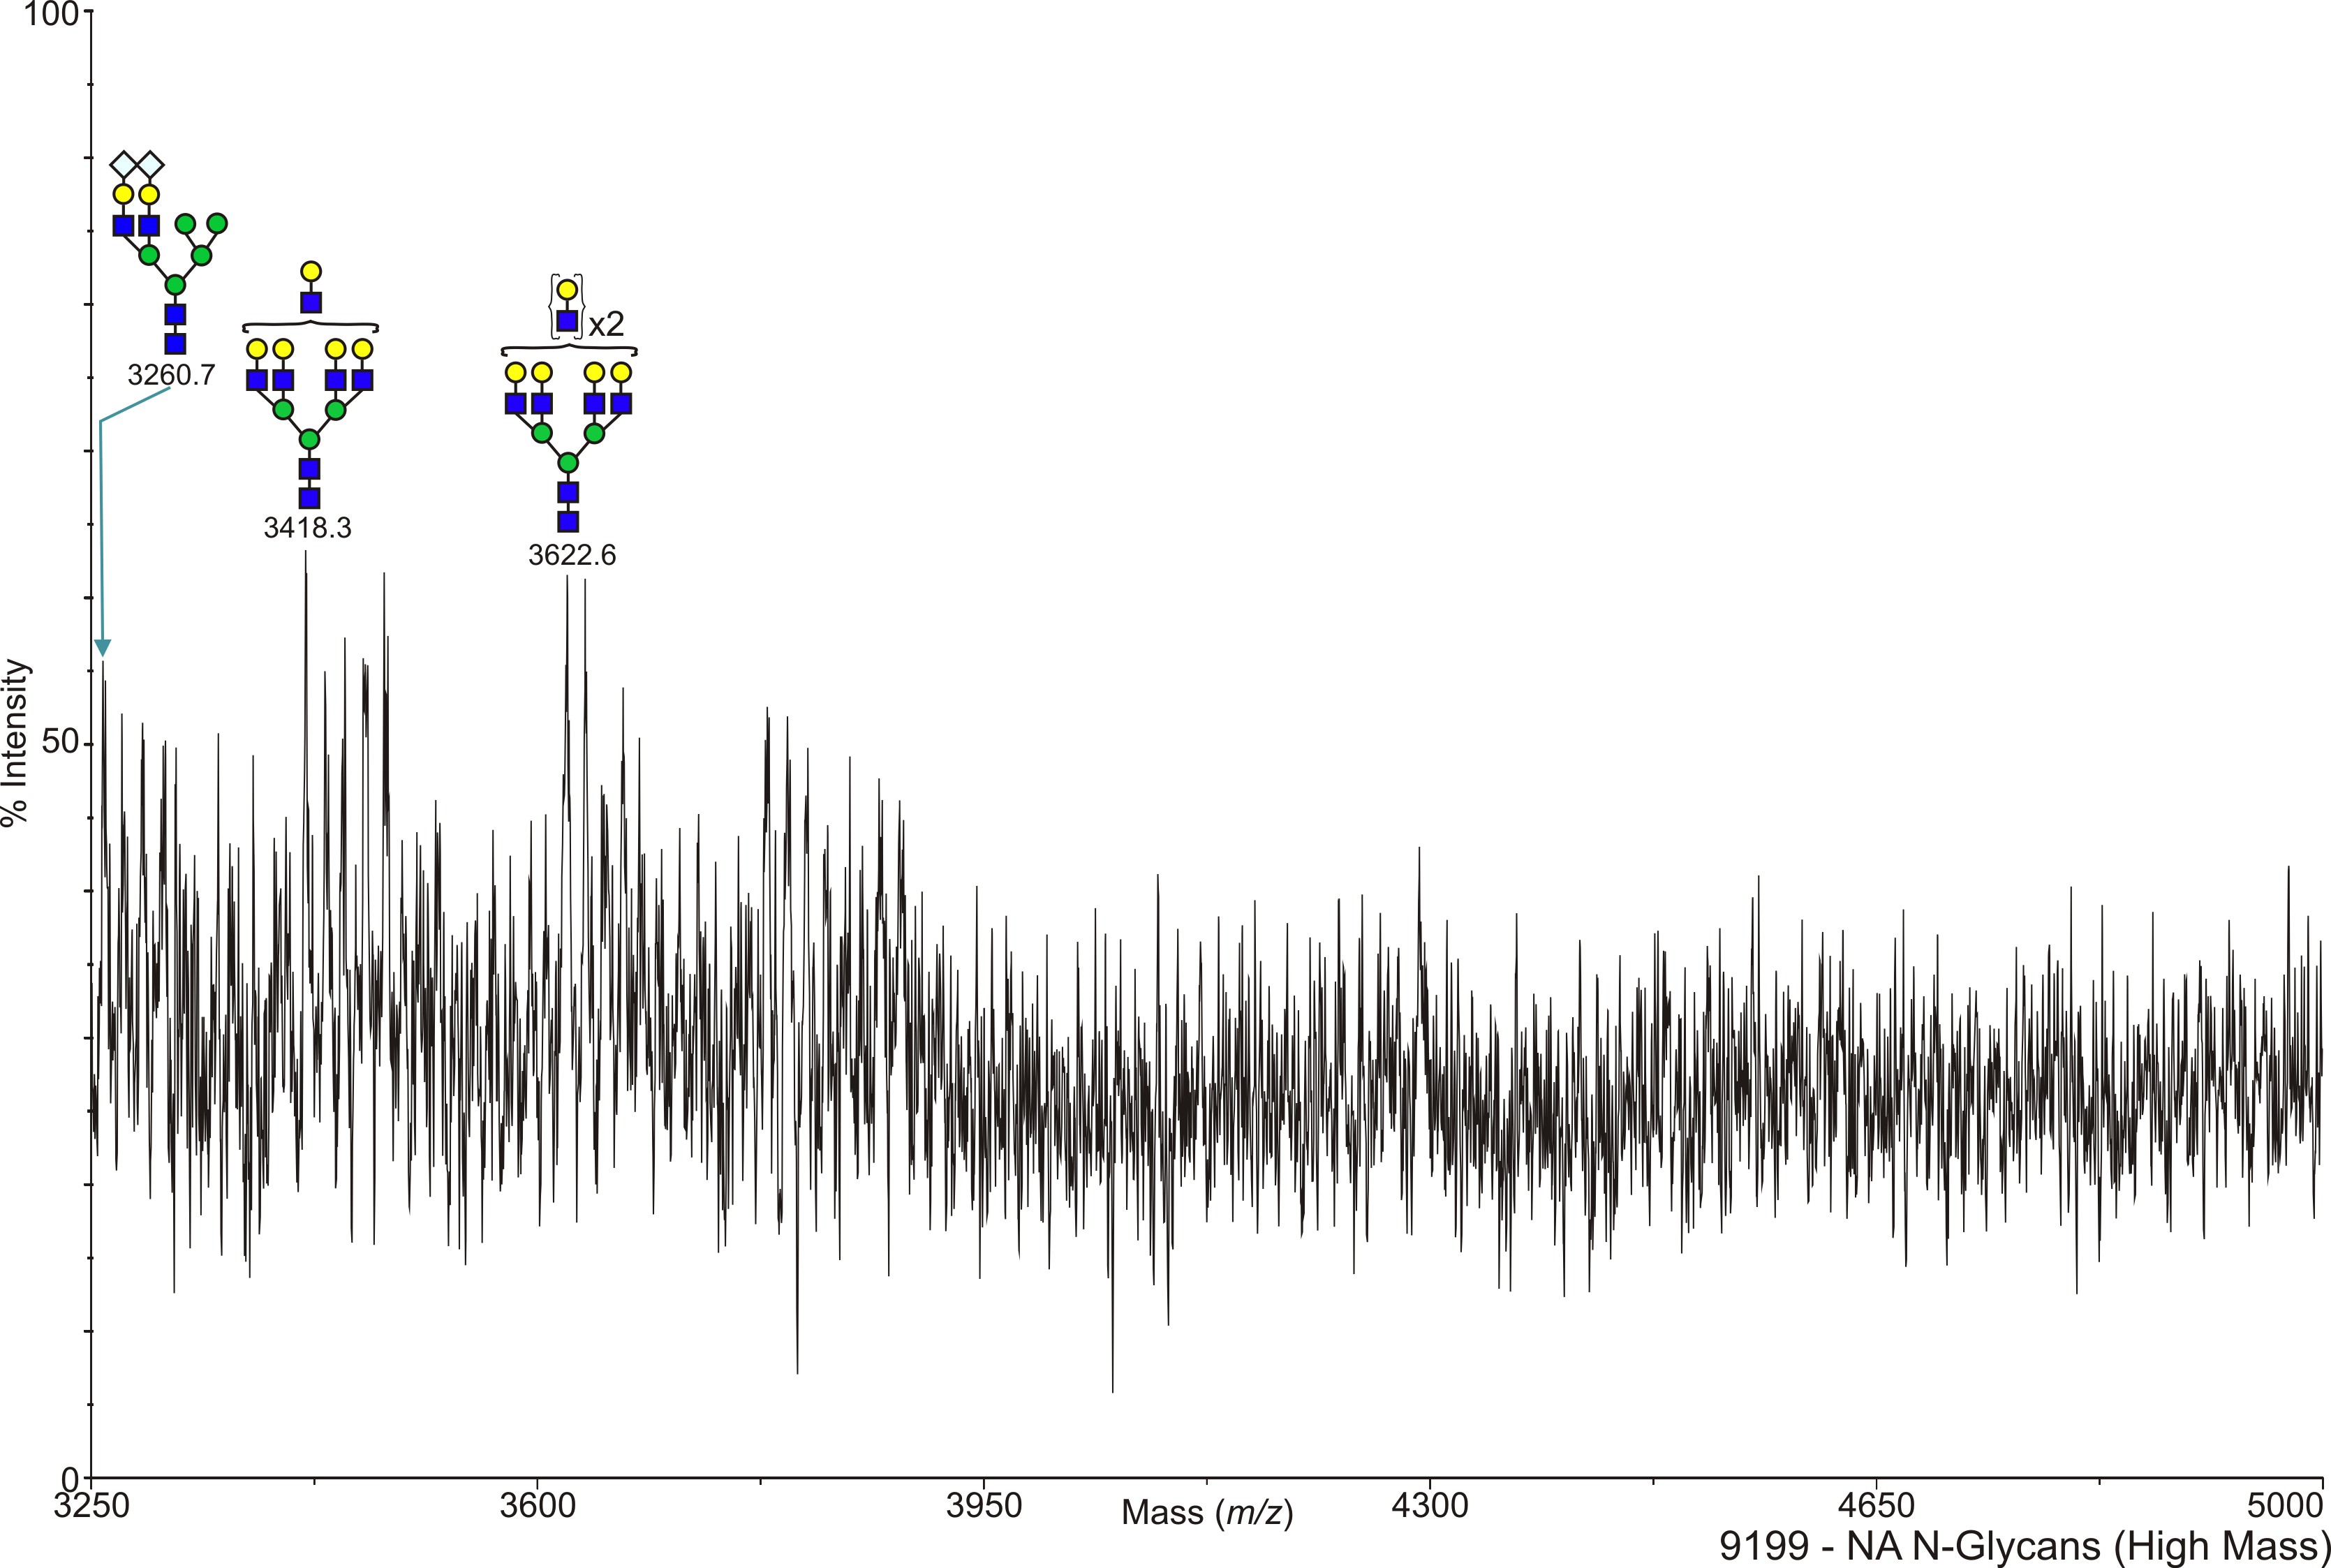
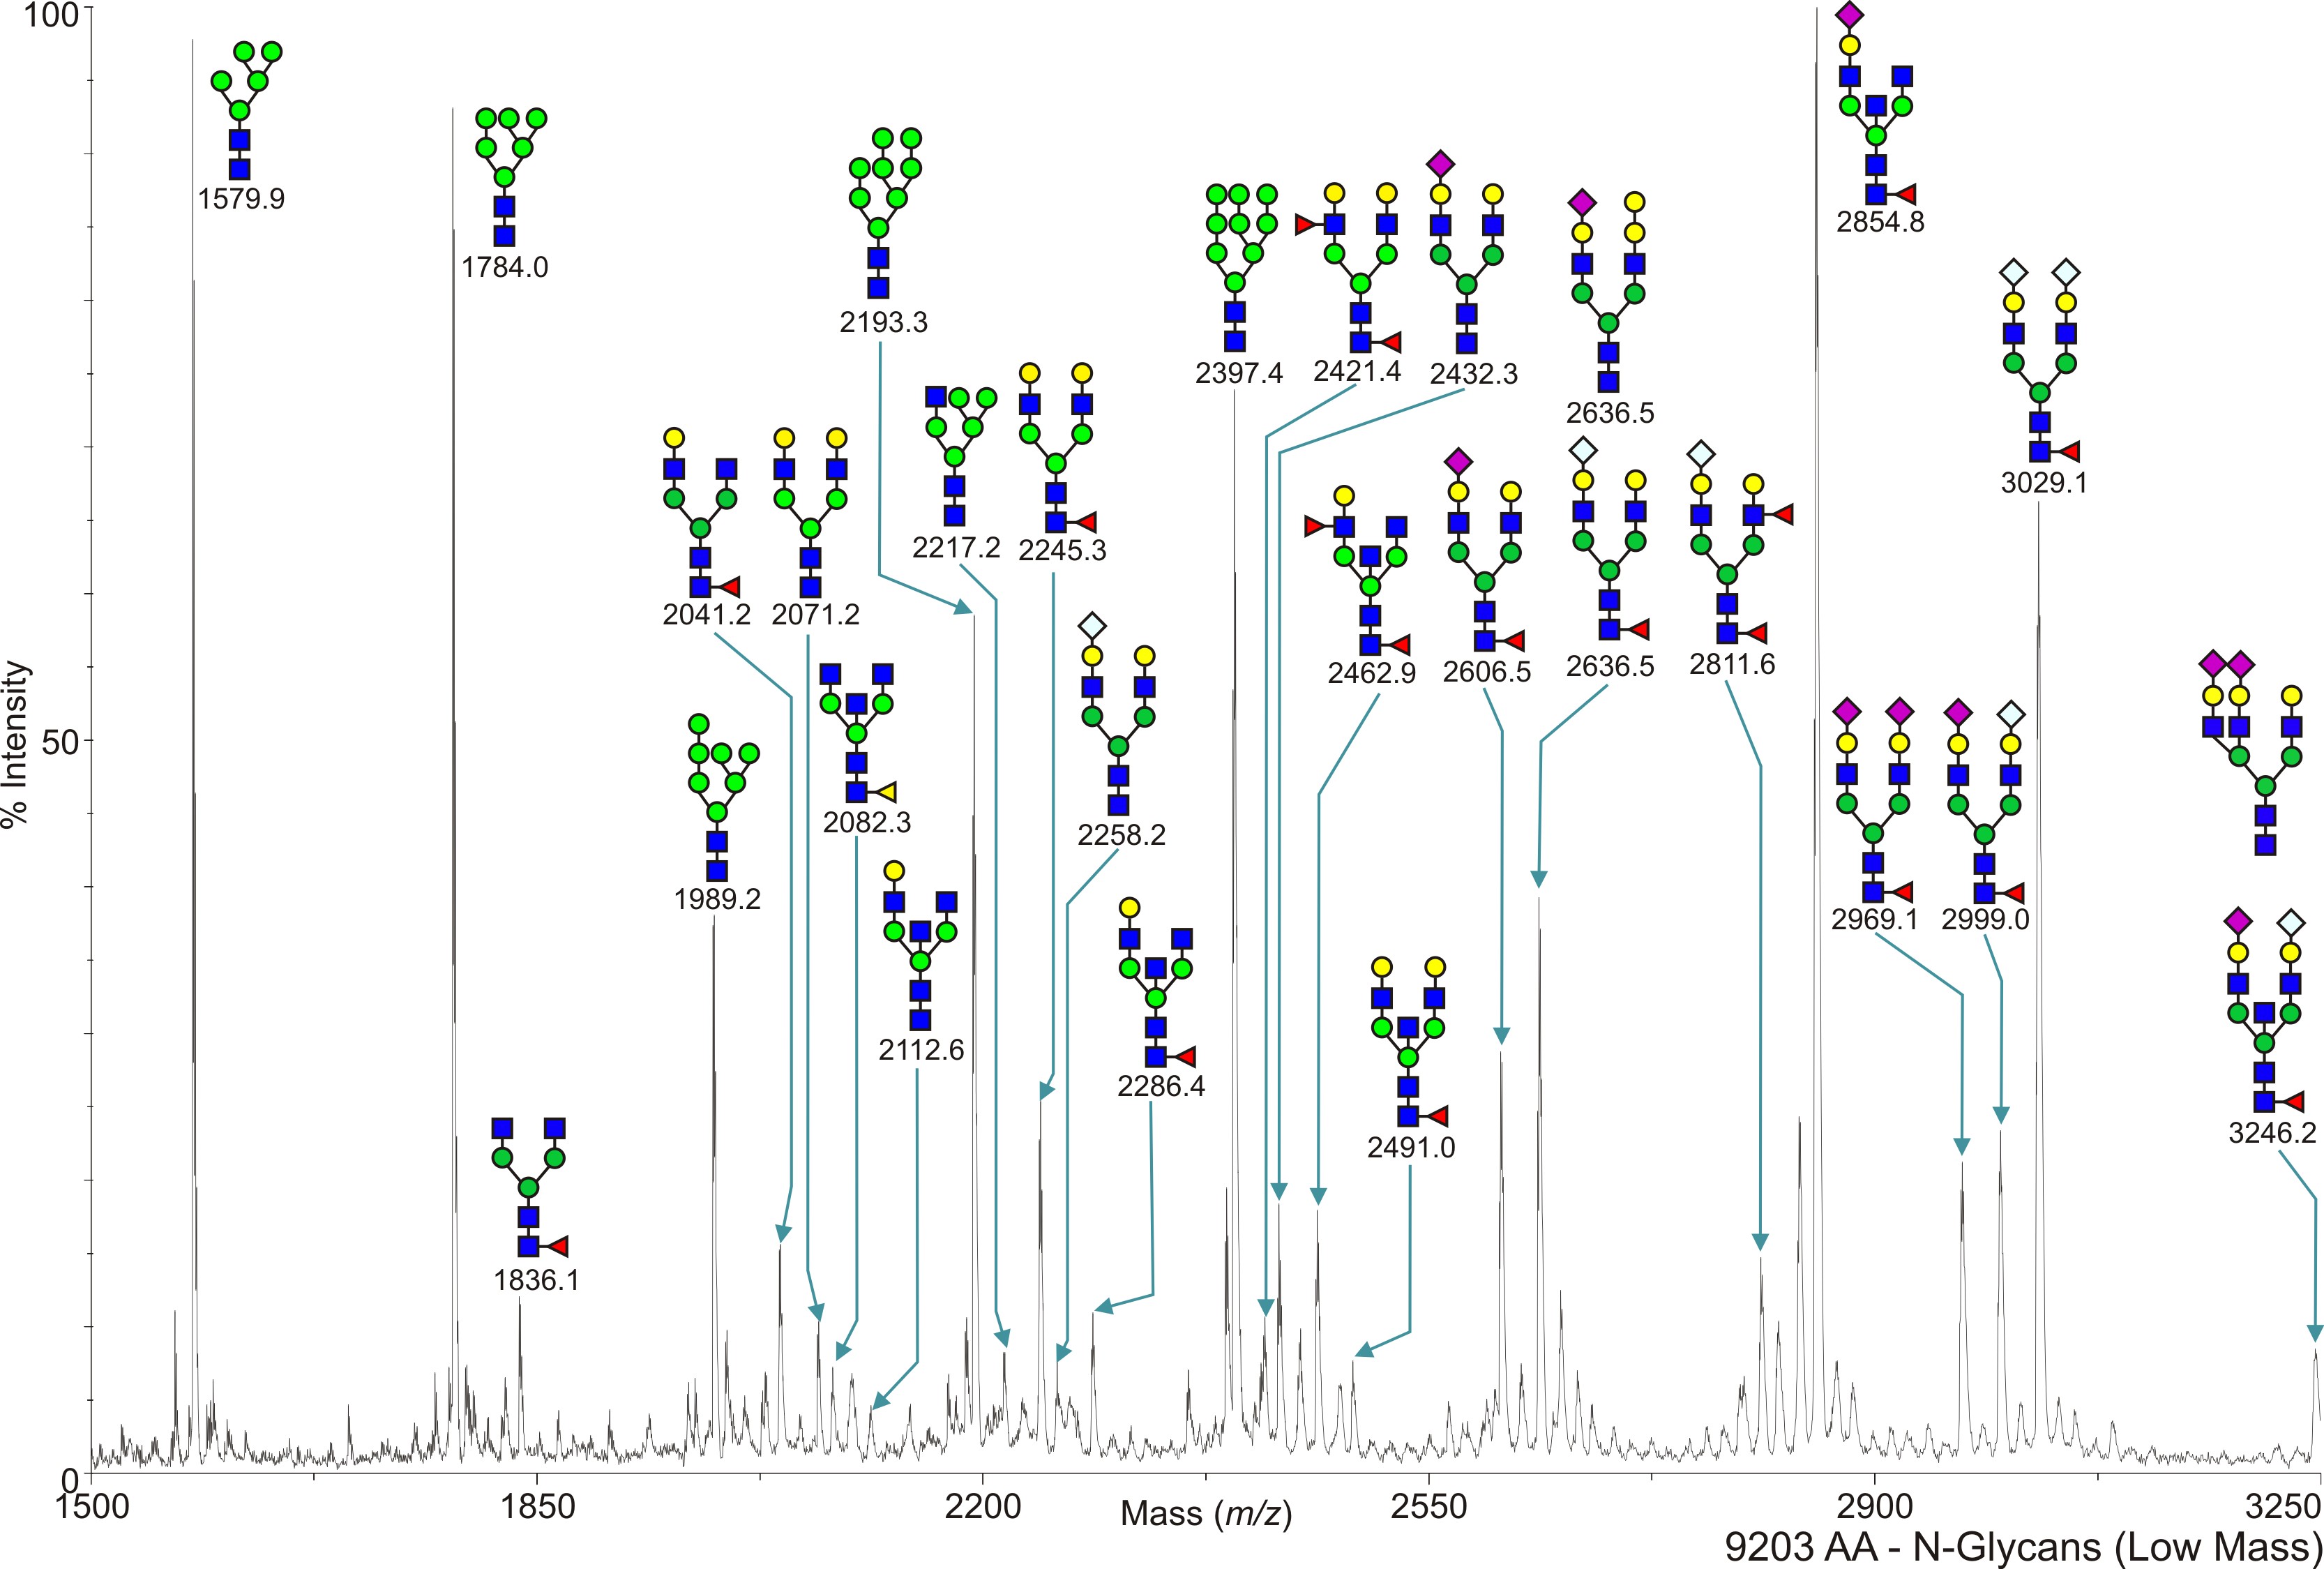
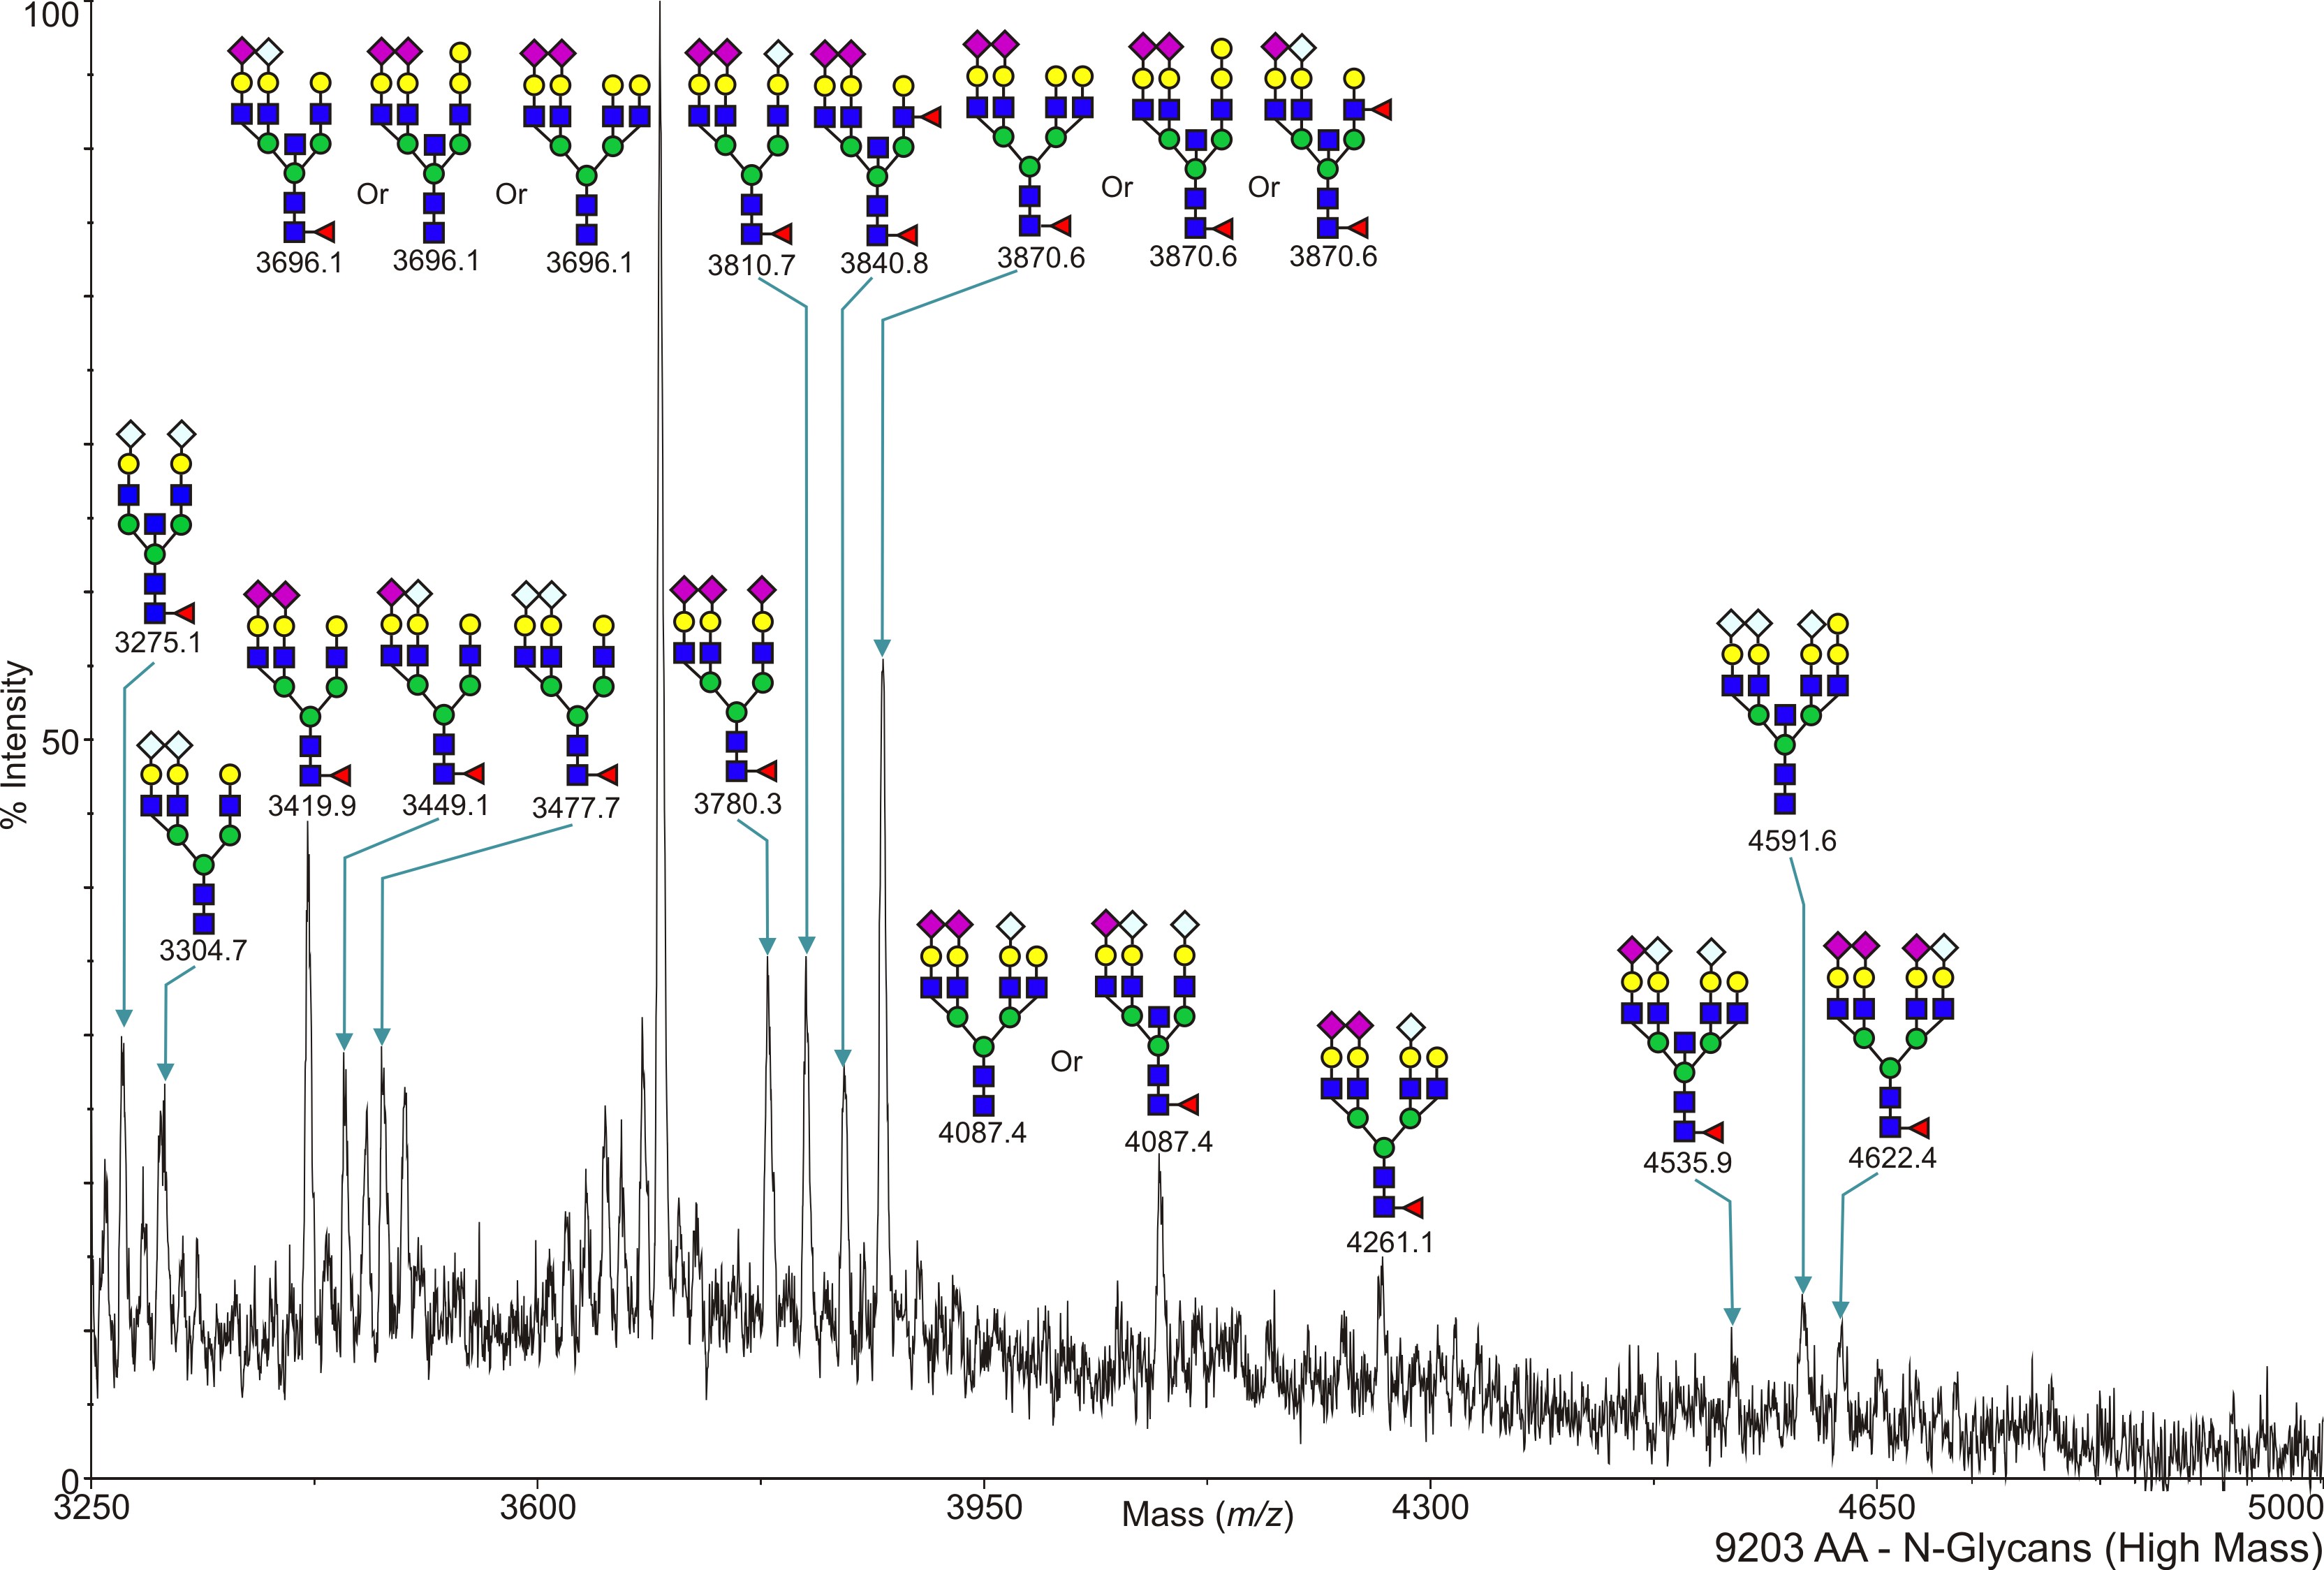
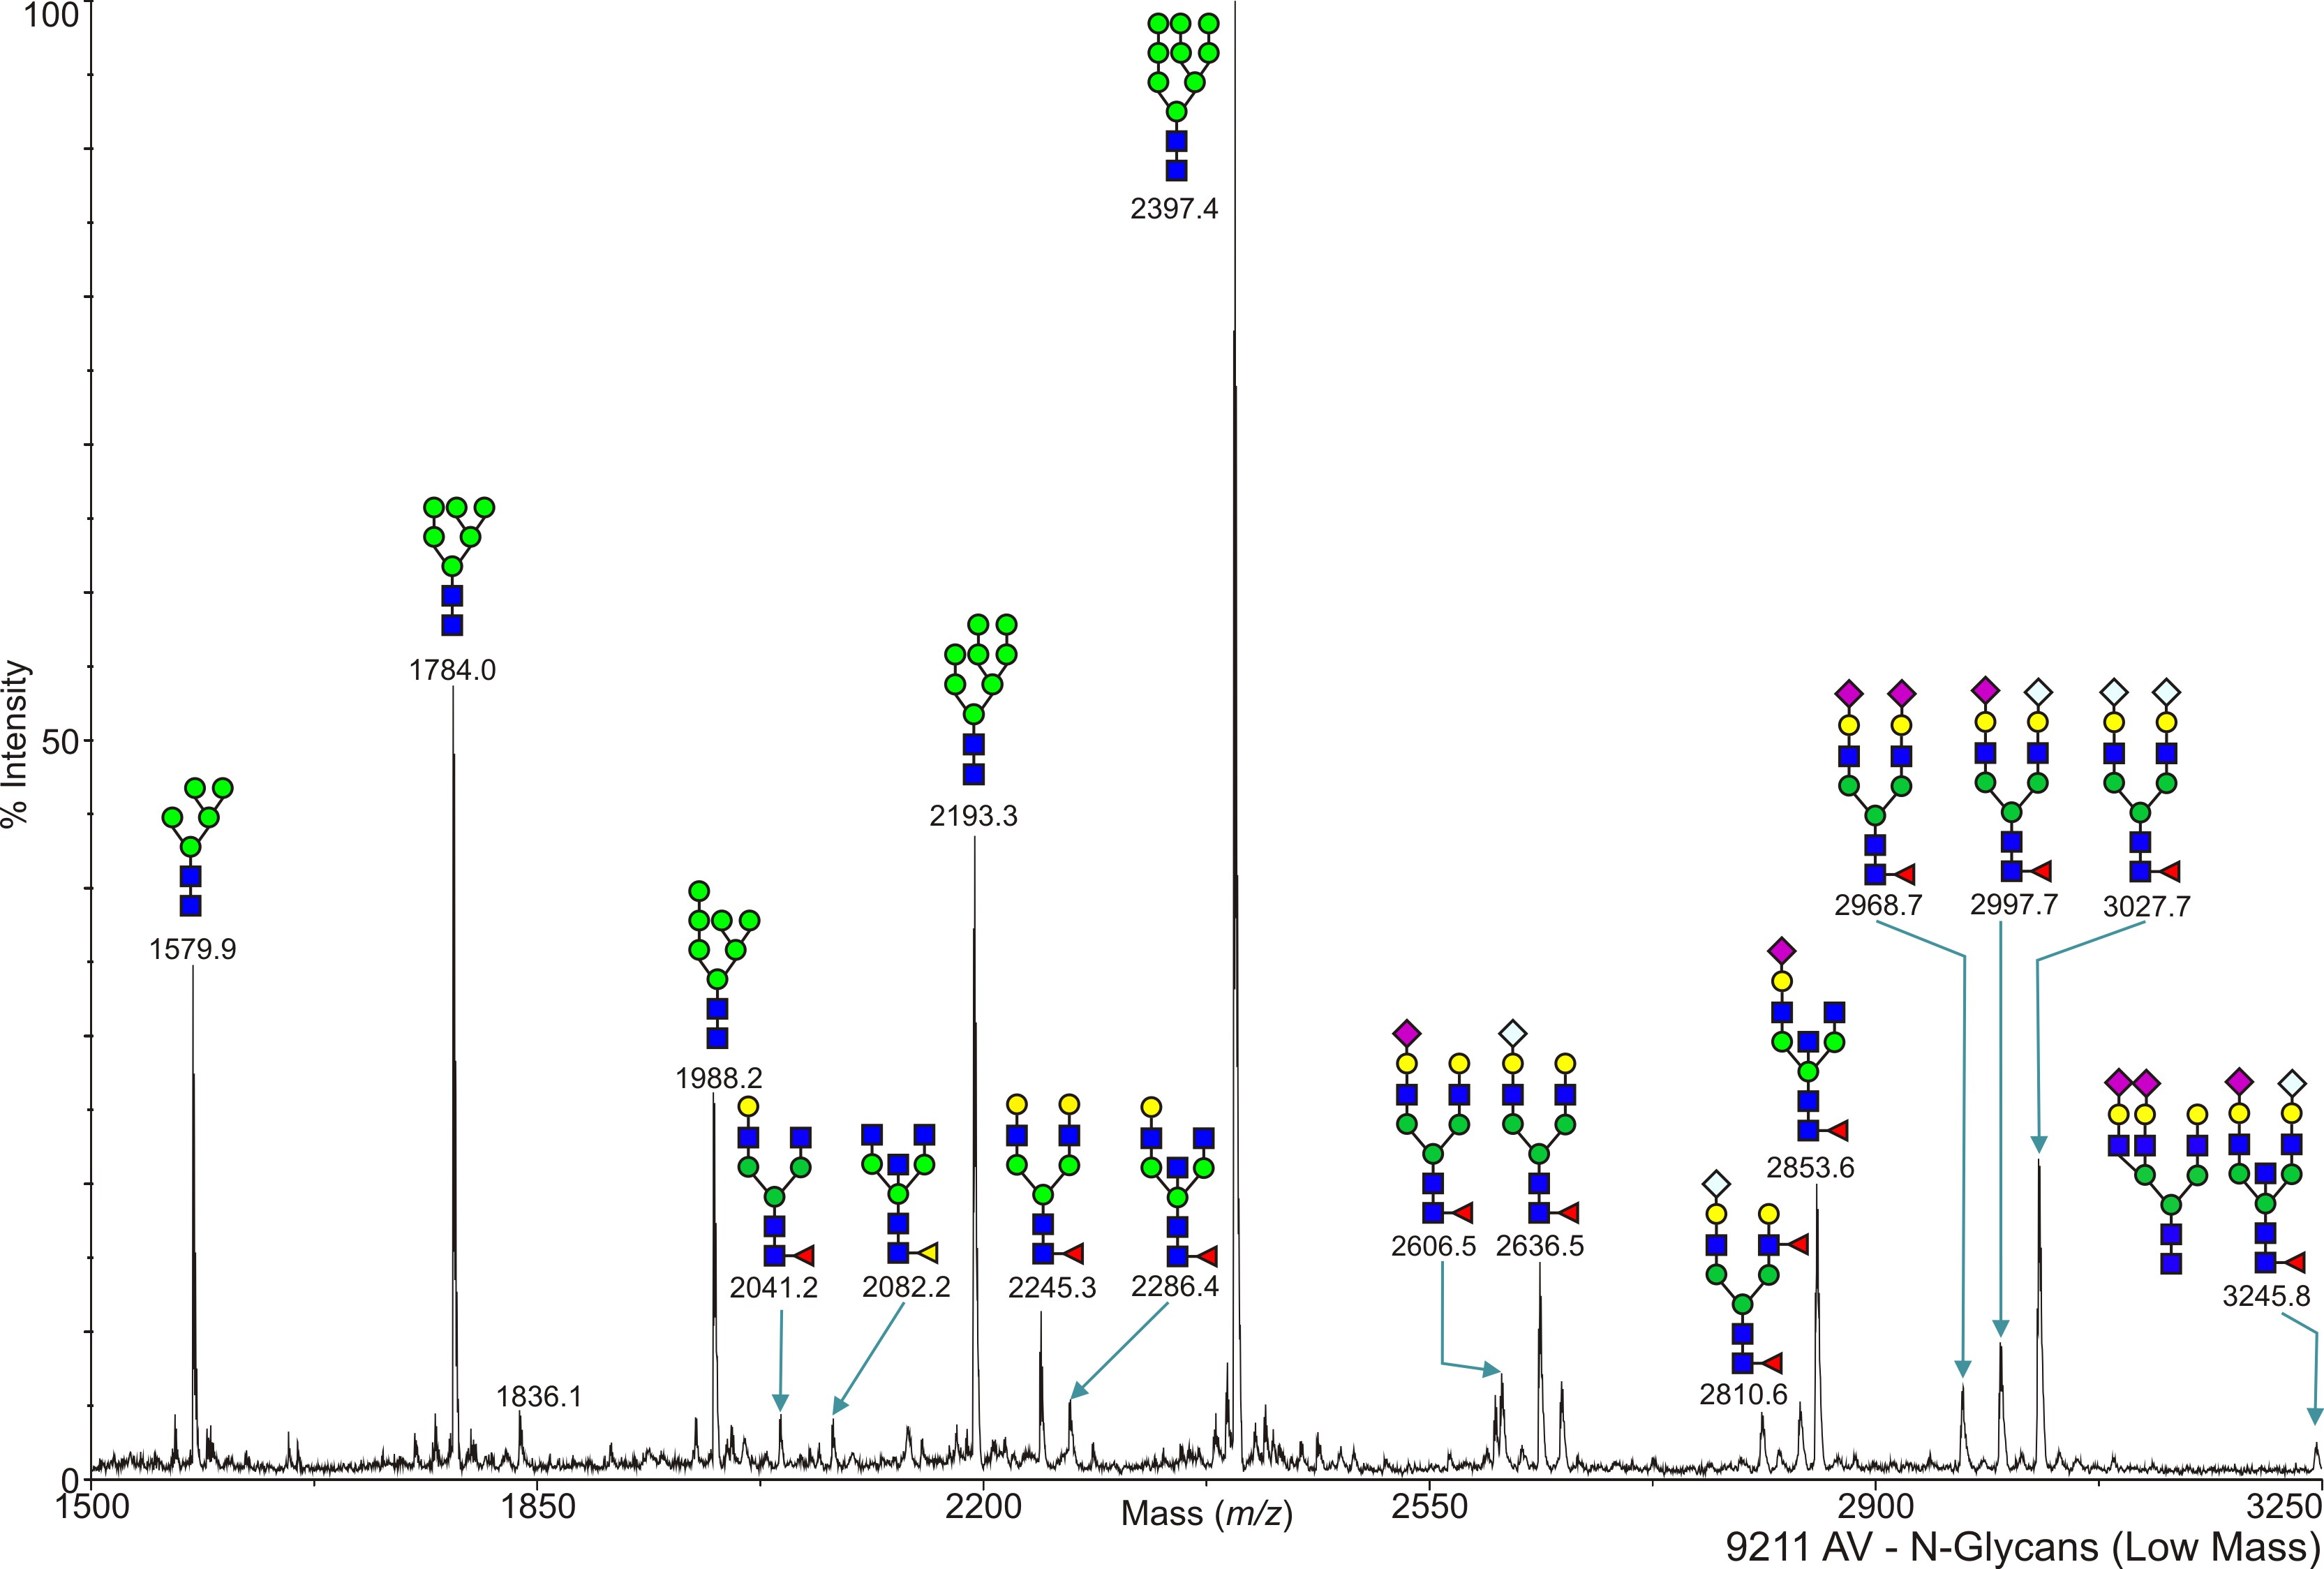
Glycan profiling data from analyses of tissue samples are provided here. Results can be filtered using the pull-down menus above. Several data file formats and an interactive data viewer are provided; see key on previous page.
Sample Search Results
Mice Colony Code Species Mouse Strain Tissue Comments Glycan type Analyzed Mouse Type Patient Code Participating Investigator Meta Data
Image Files
JPGPDF
Raw Data
MSD MSA DAT MS-MS Interactive View
Resource Request
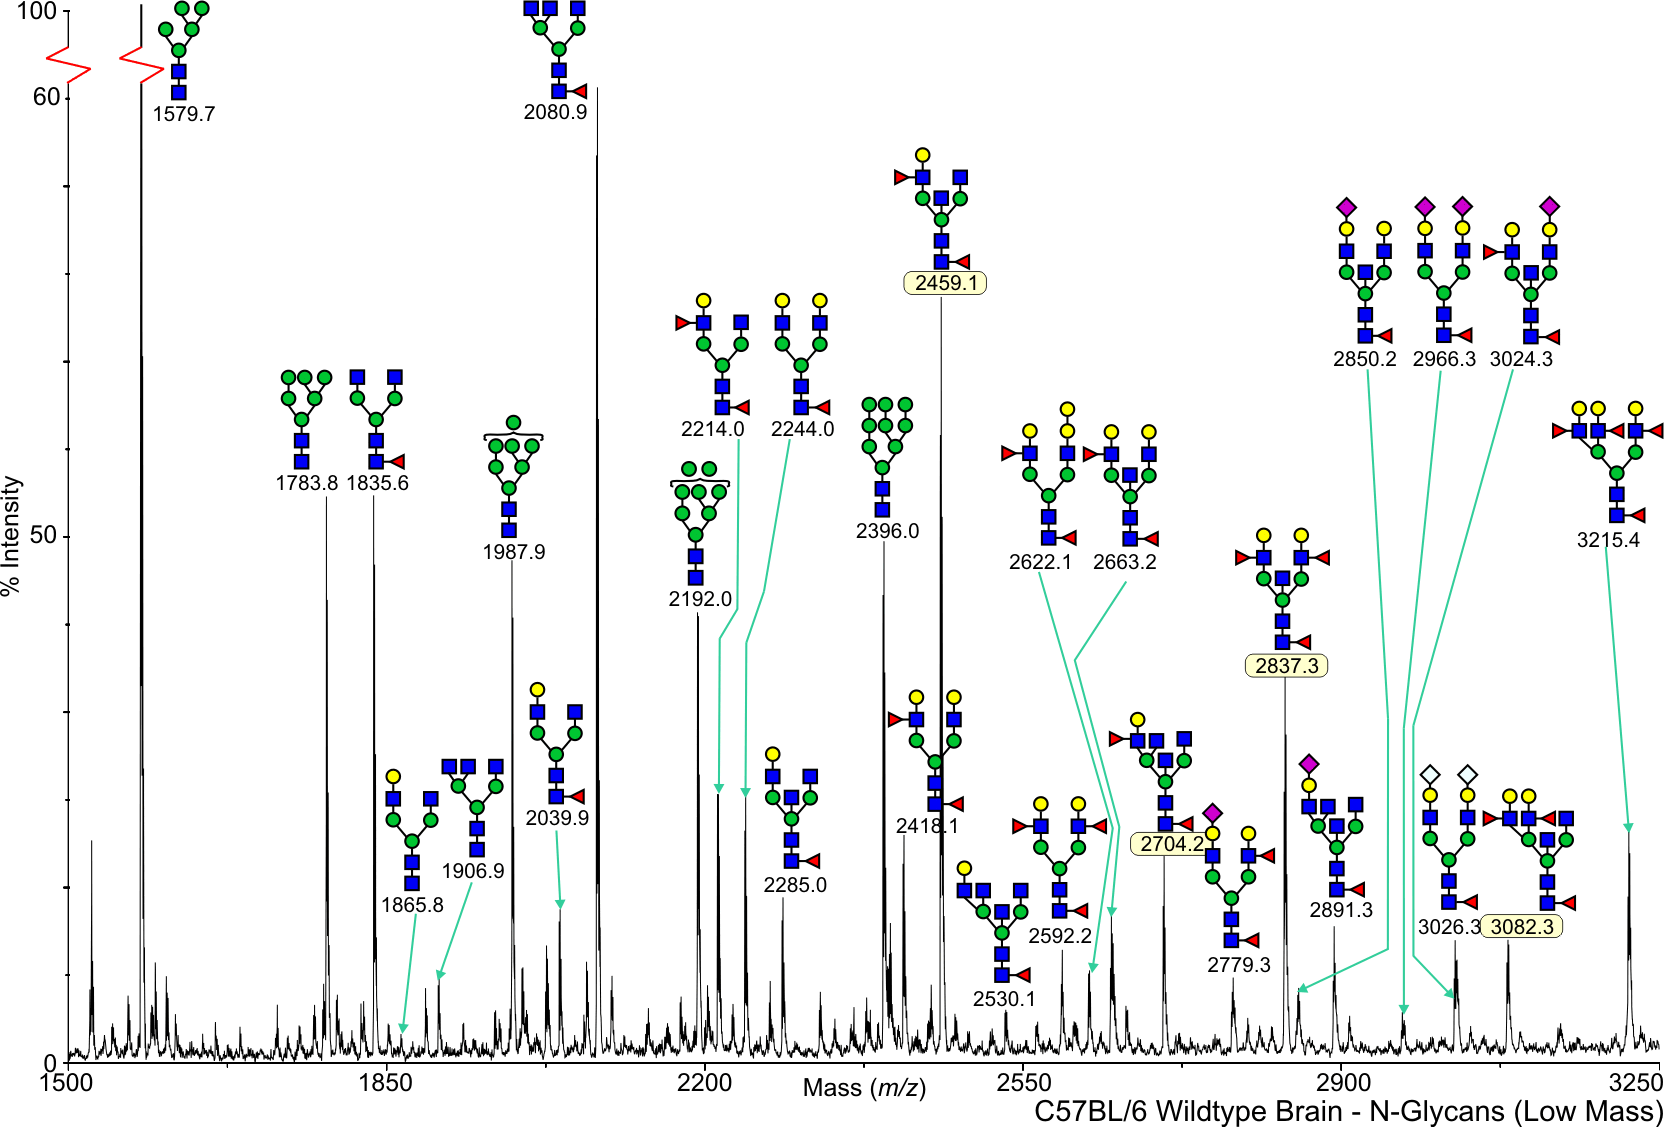
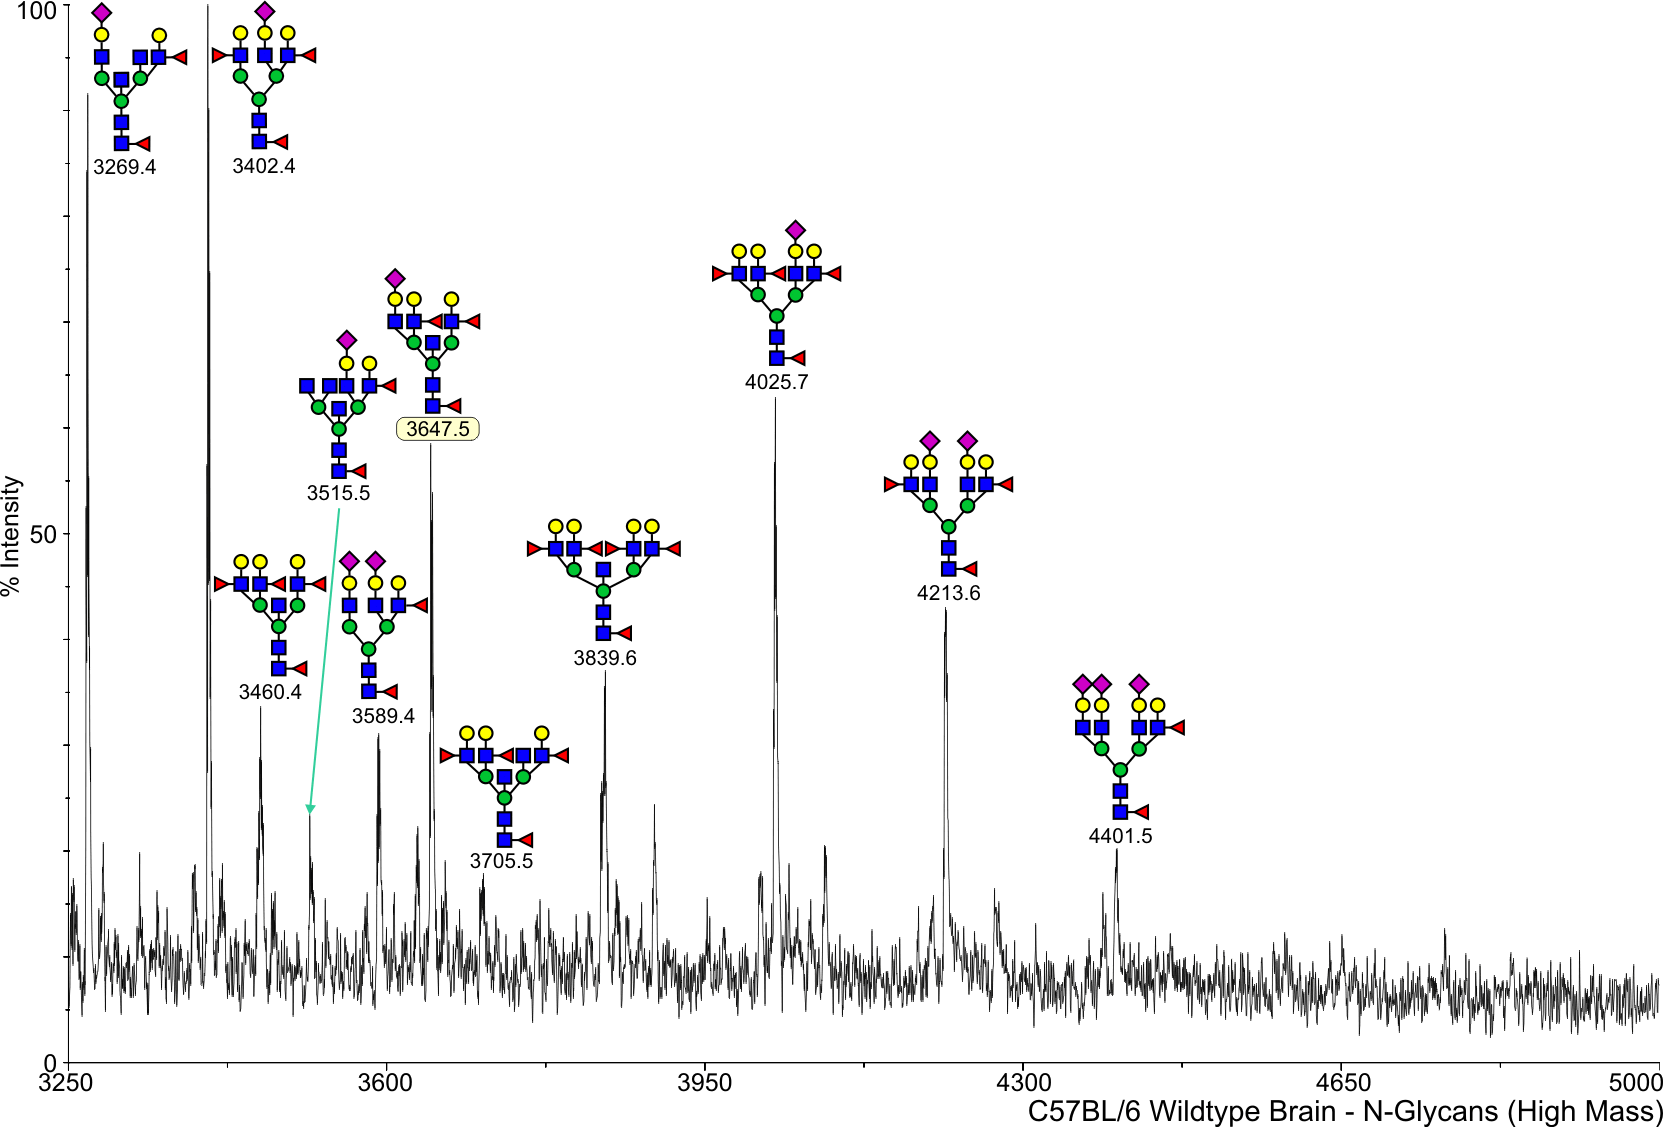
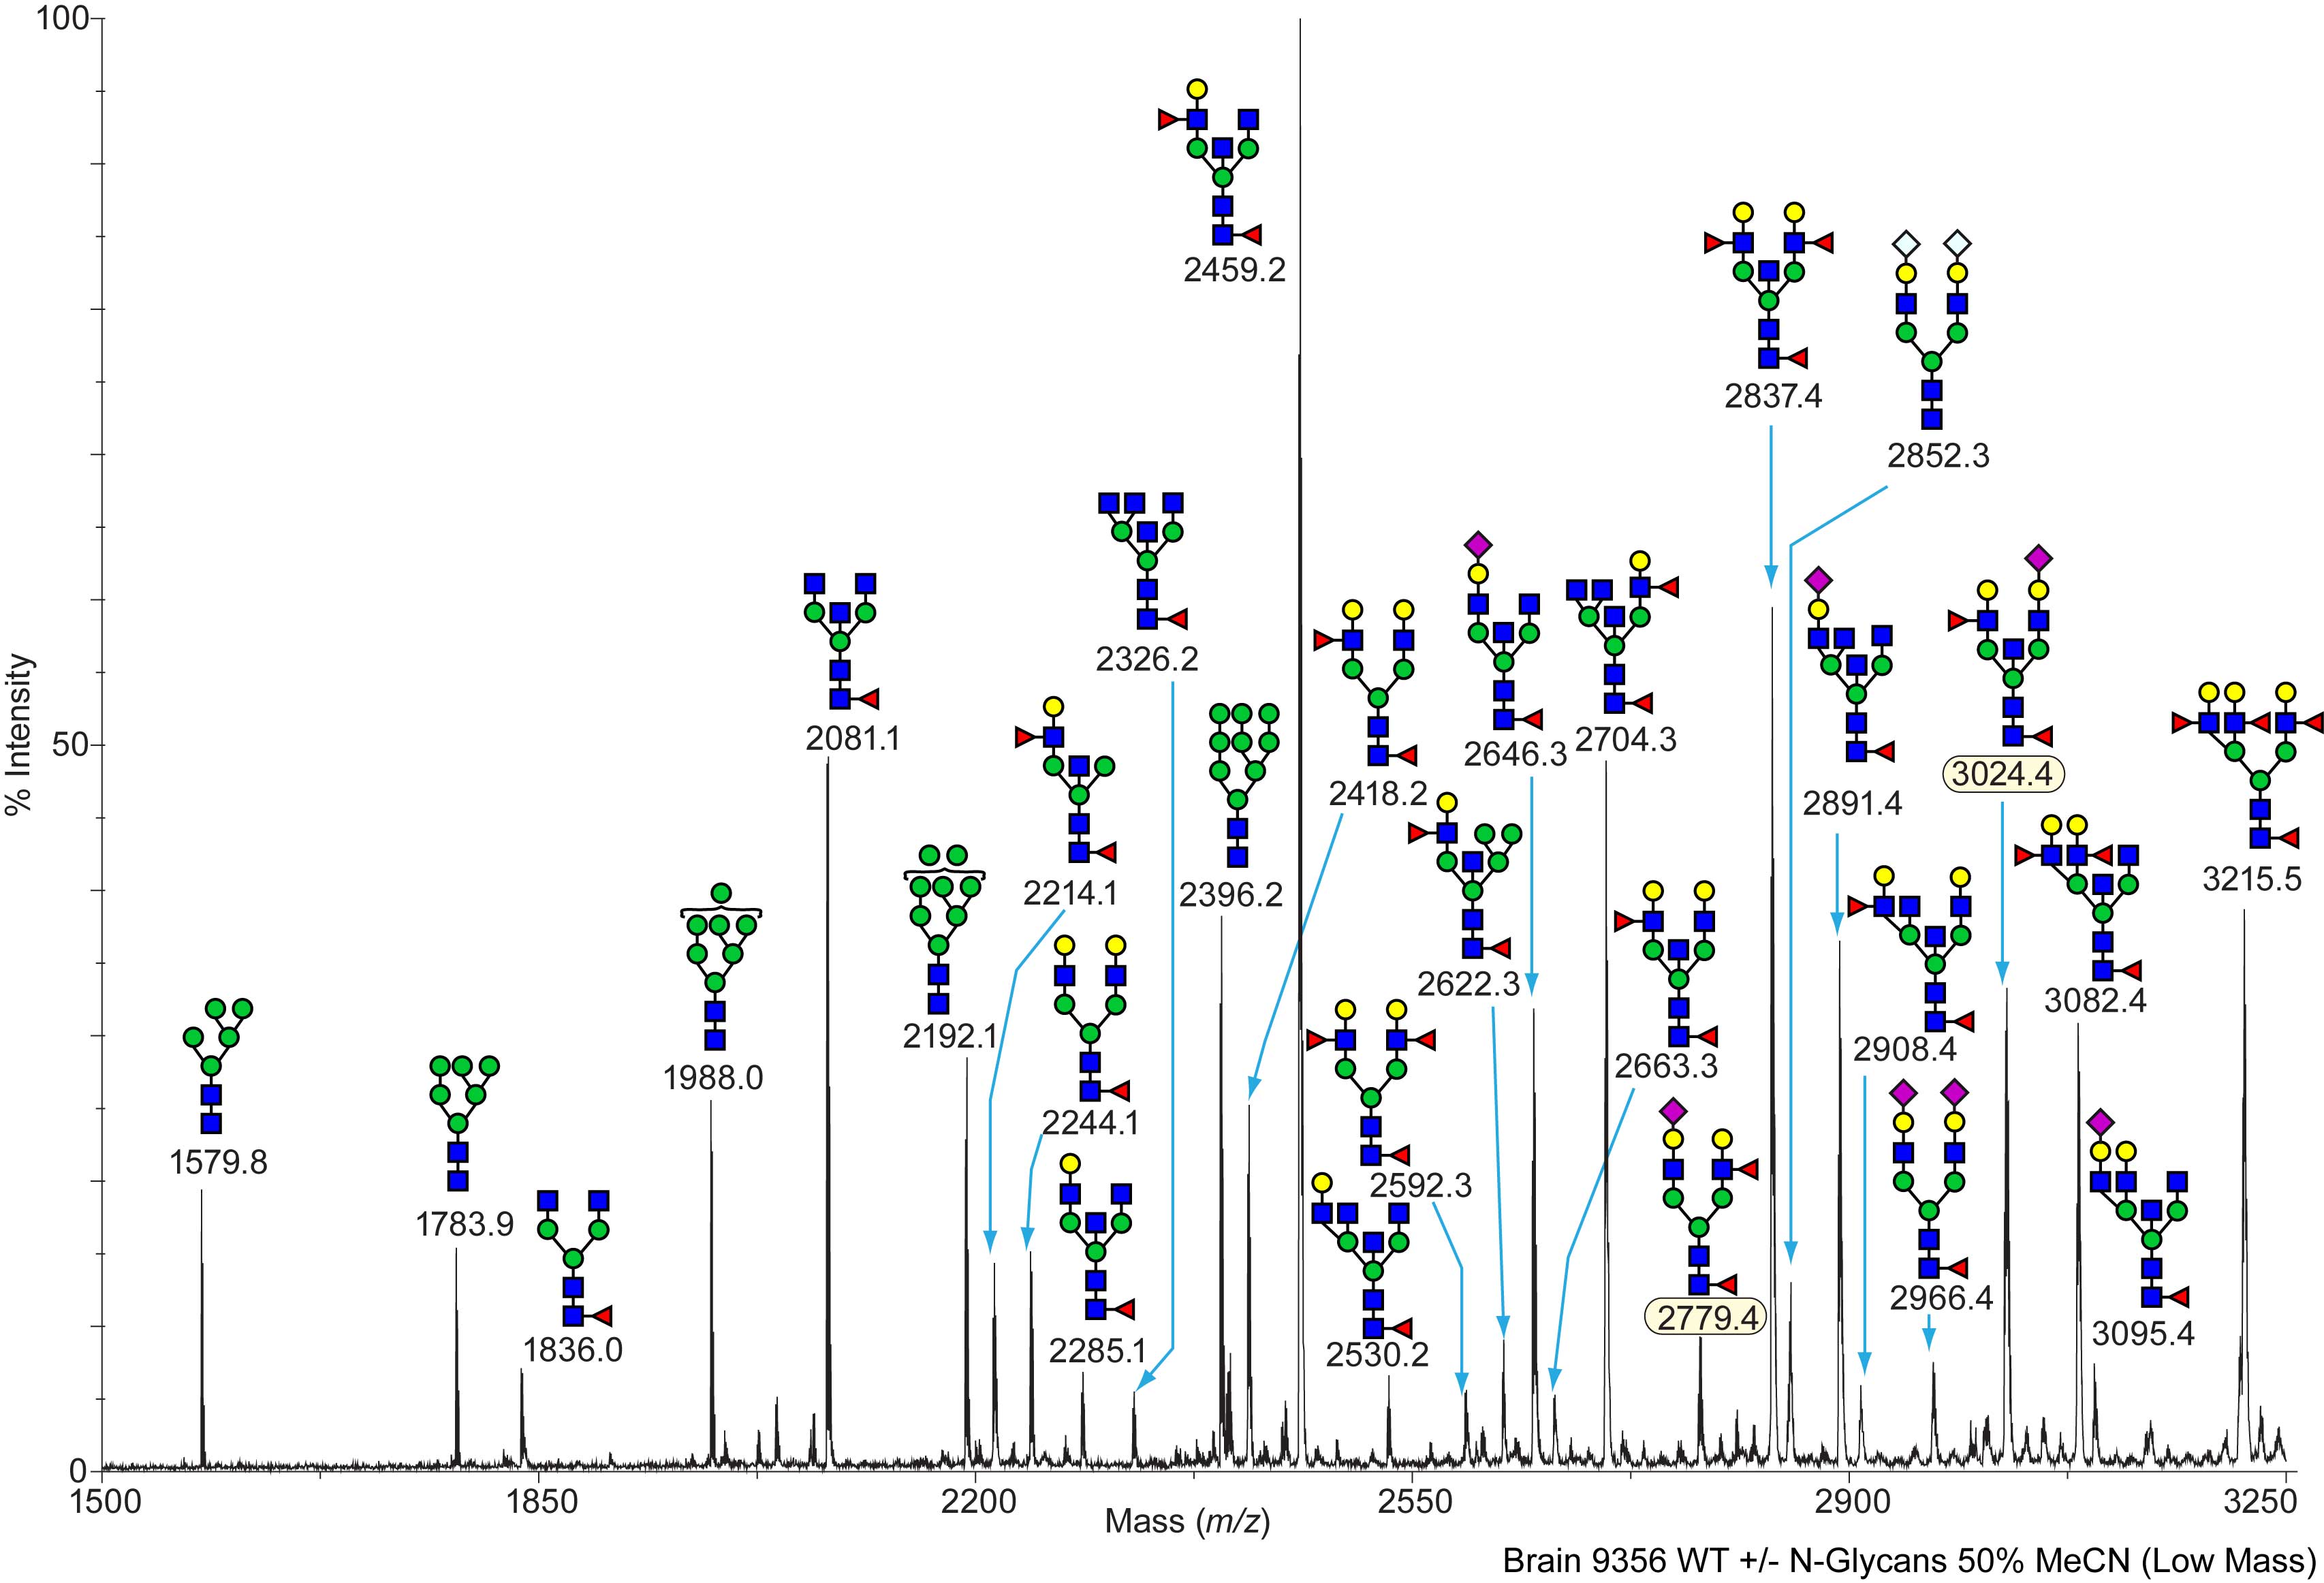
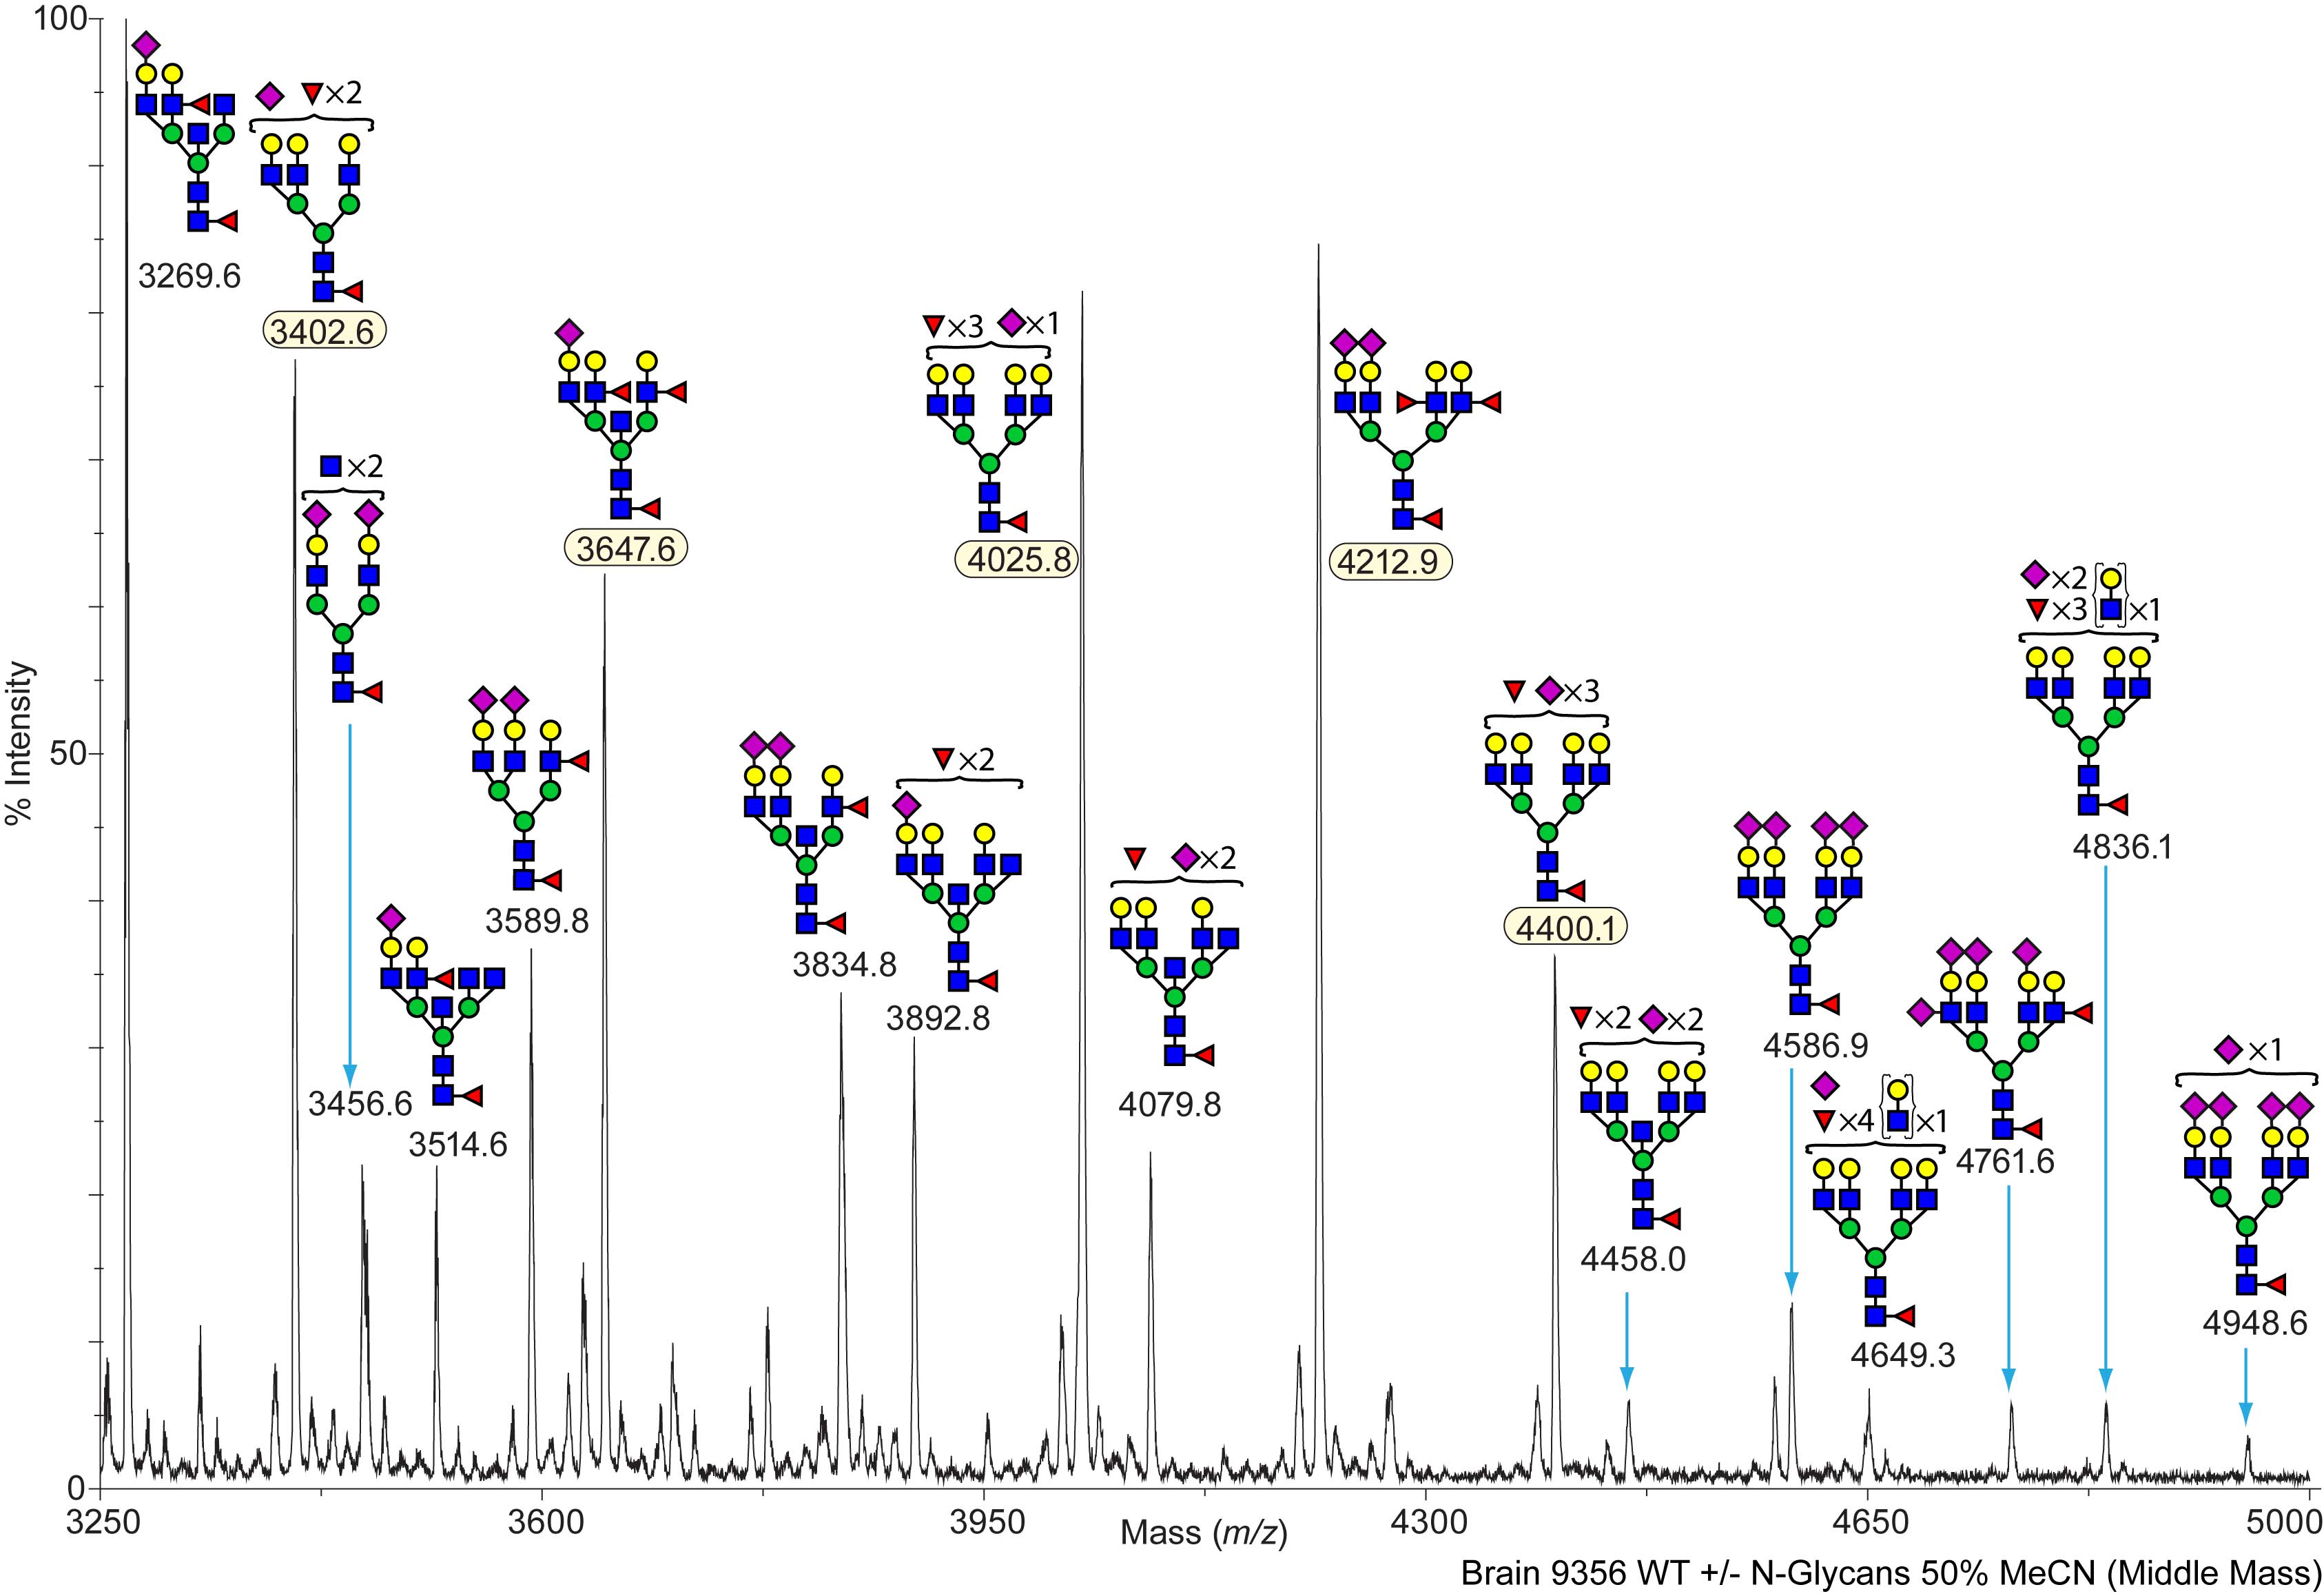
Mouse Wild Type Brain N-Linked C57BL/6 View experimental details      
Annotated file for lower mass range in JPG formatAnnotated file for higher mass range in JPG format Annotated file for lower mass range in PDF formatAnnotated file for higher mass range in PDF format
View Mass Spectrum data as text View Mass Peak file   Interactive Mass Spectrum Viewer
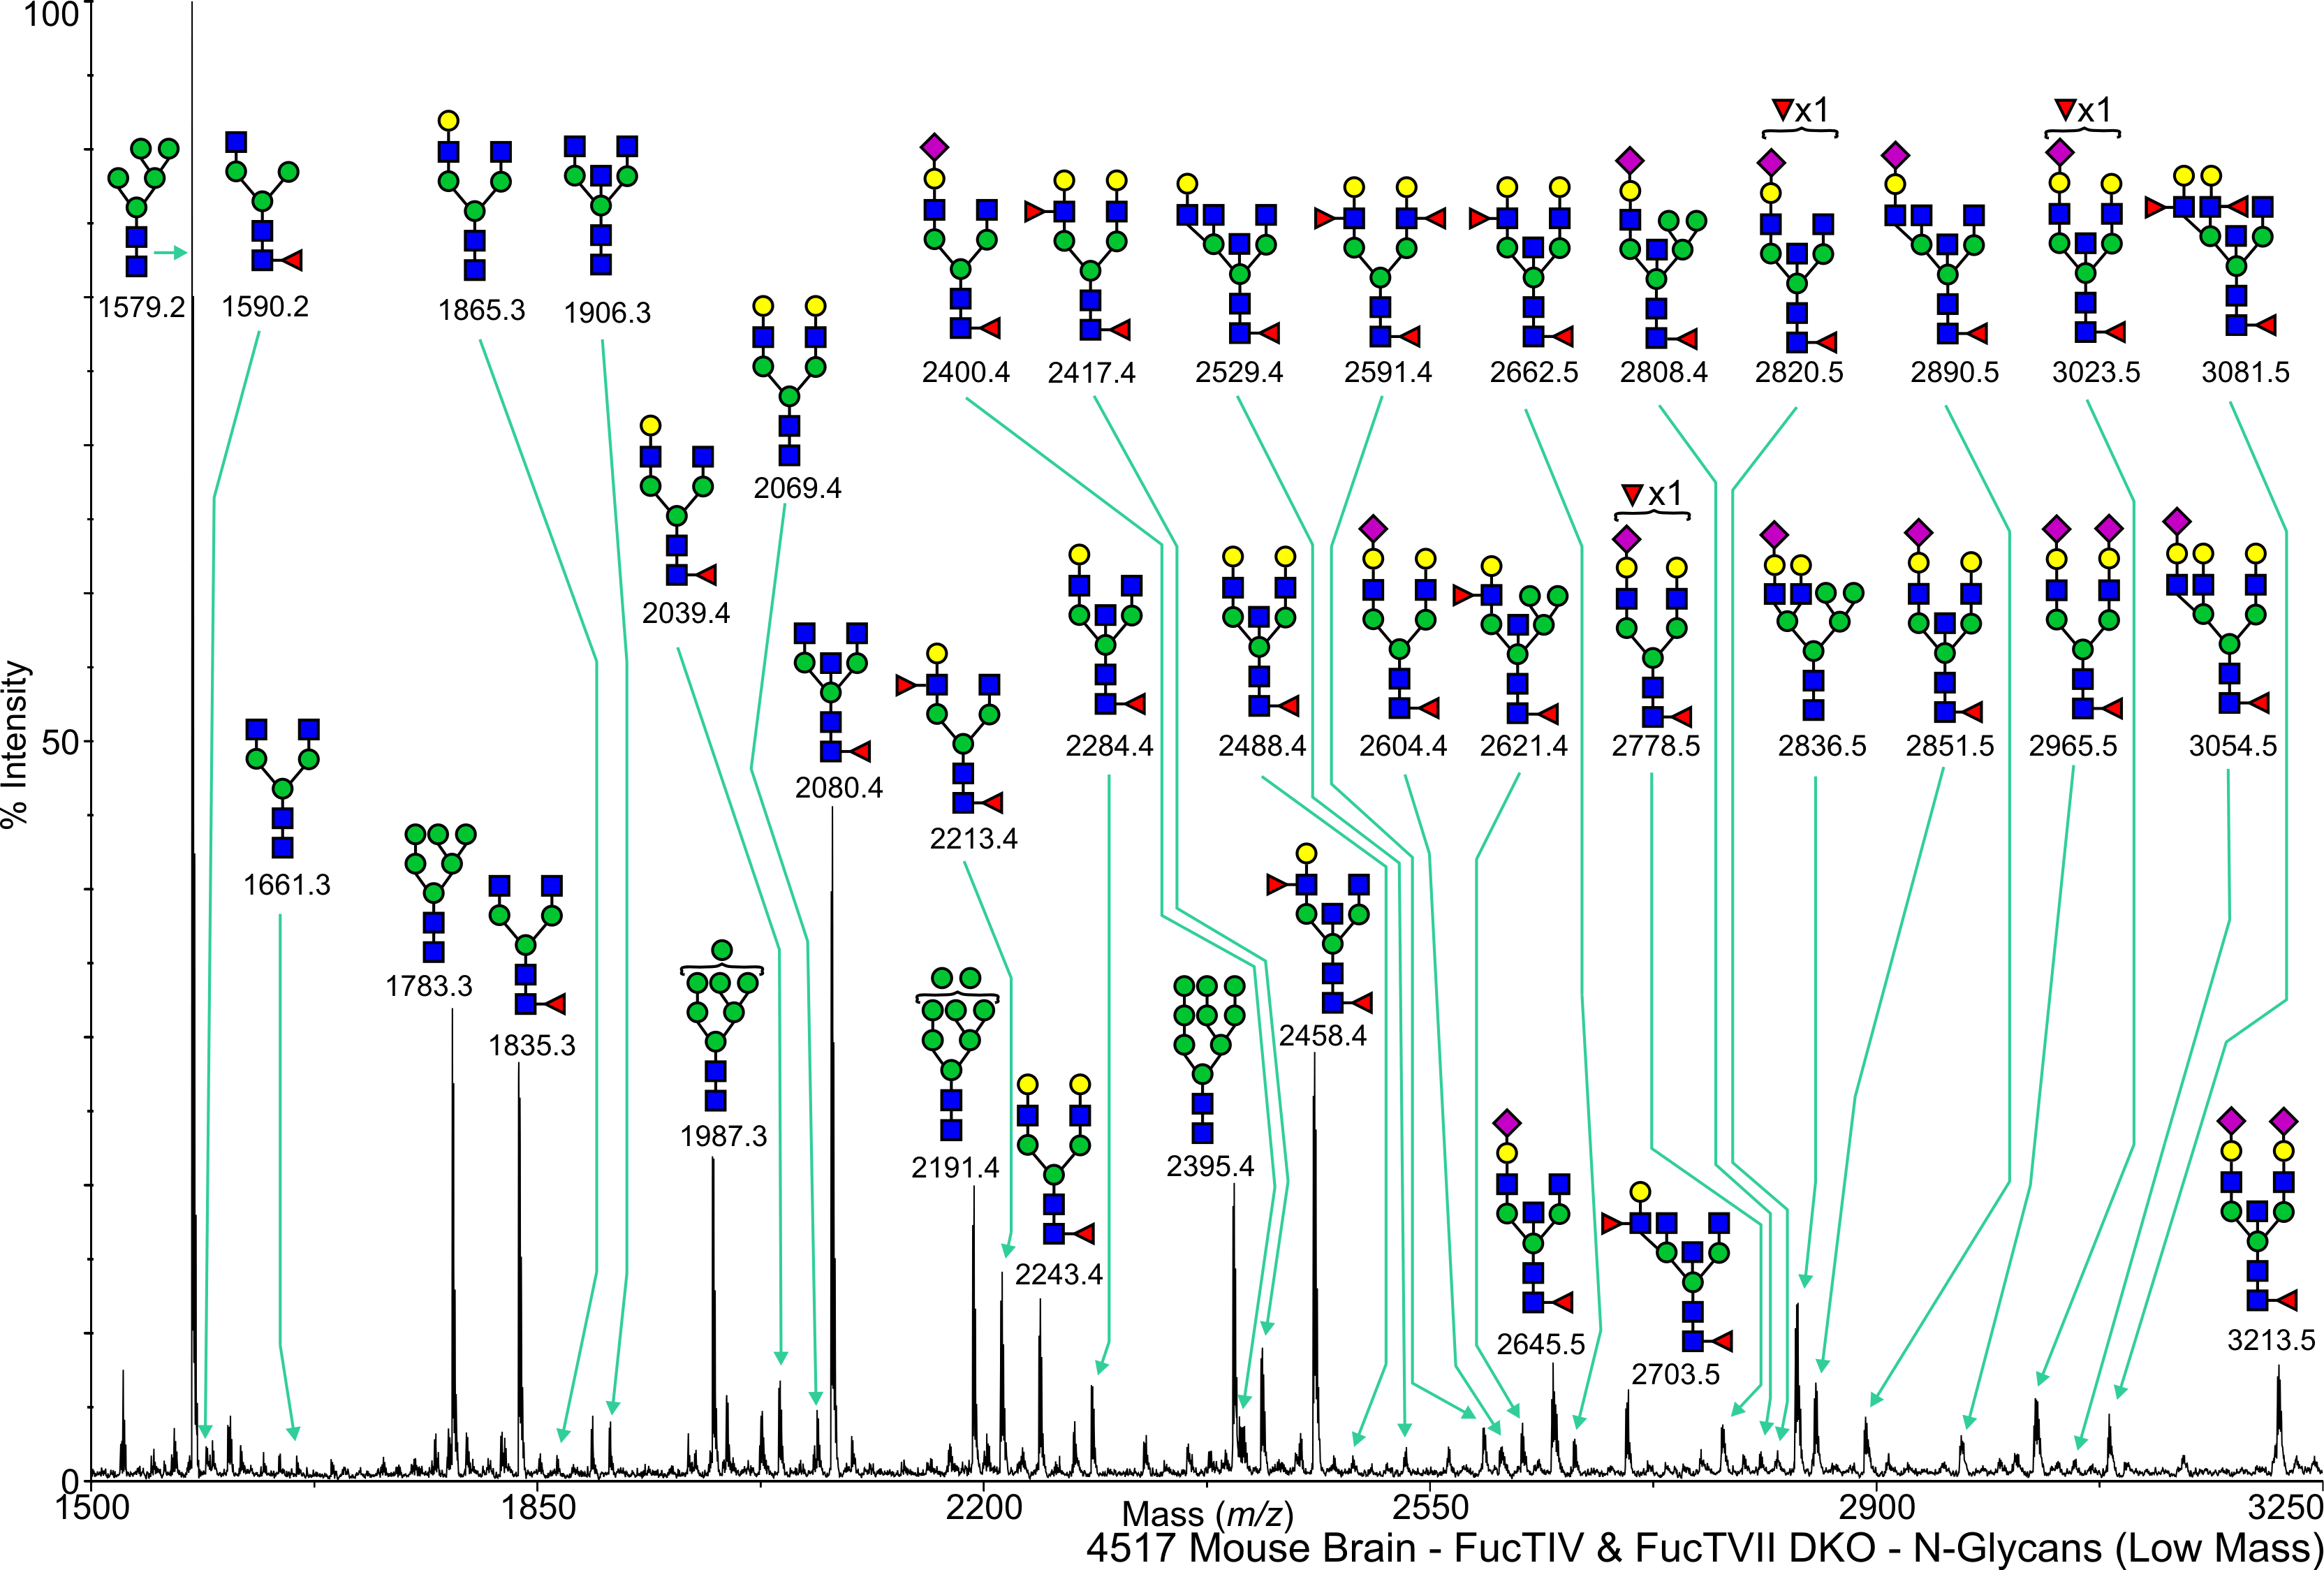
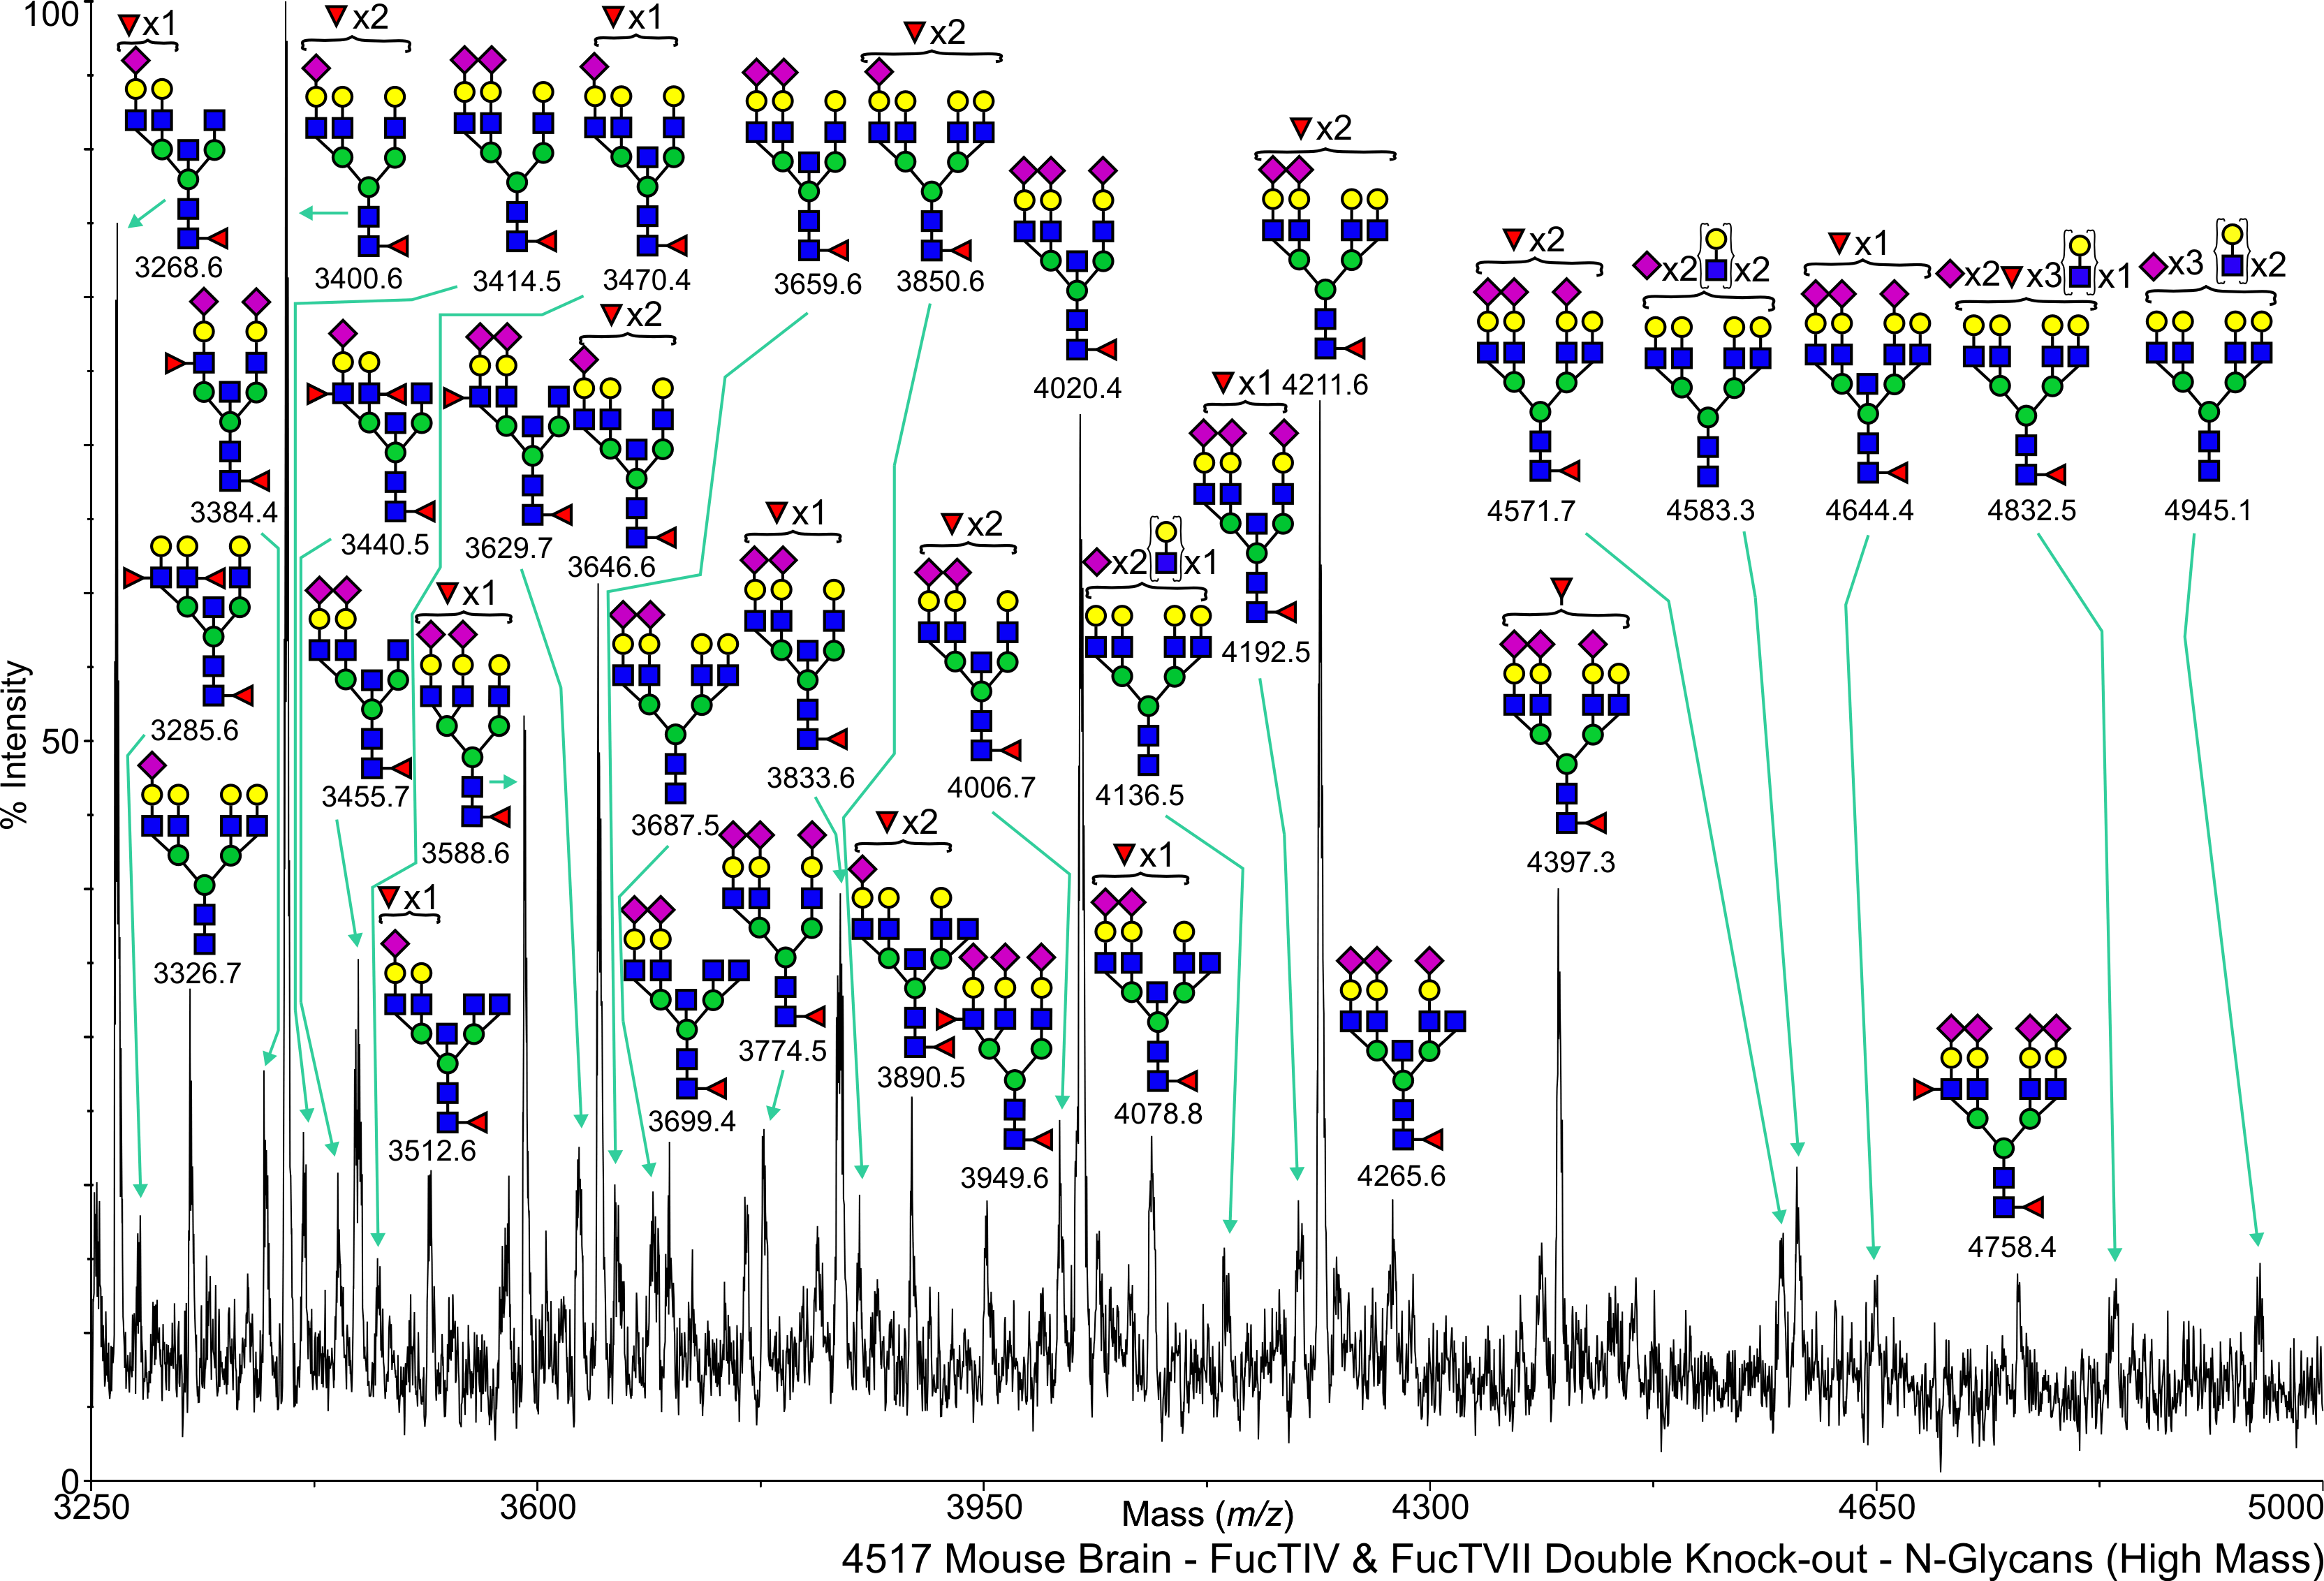
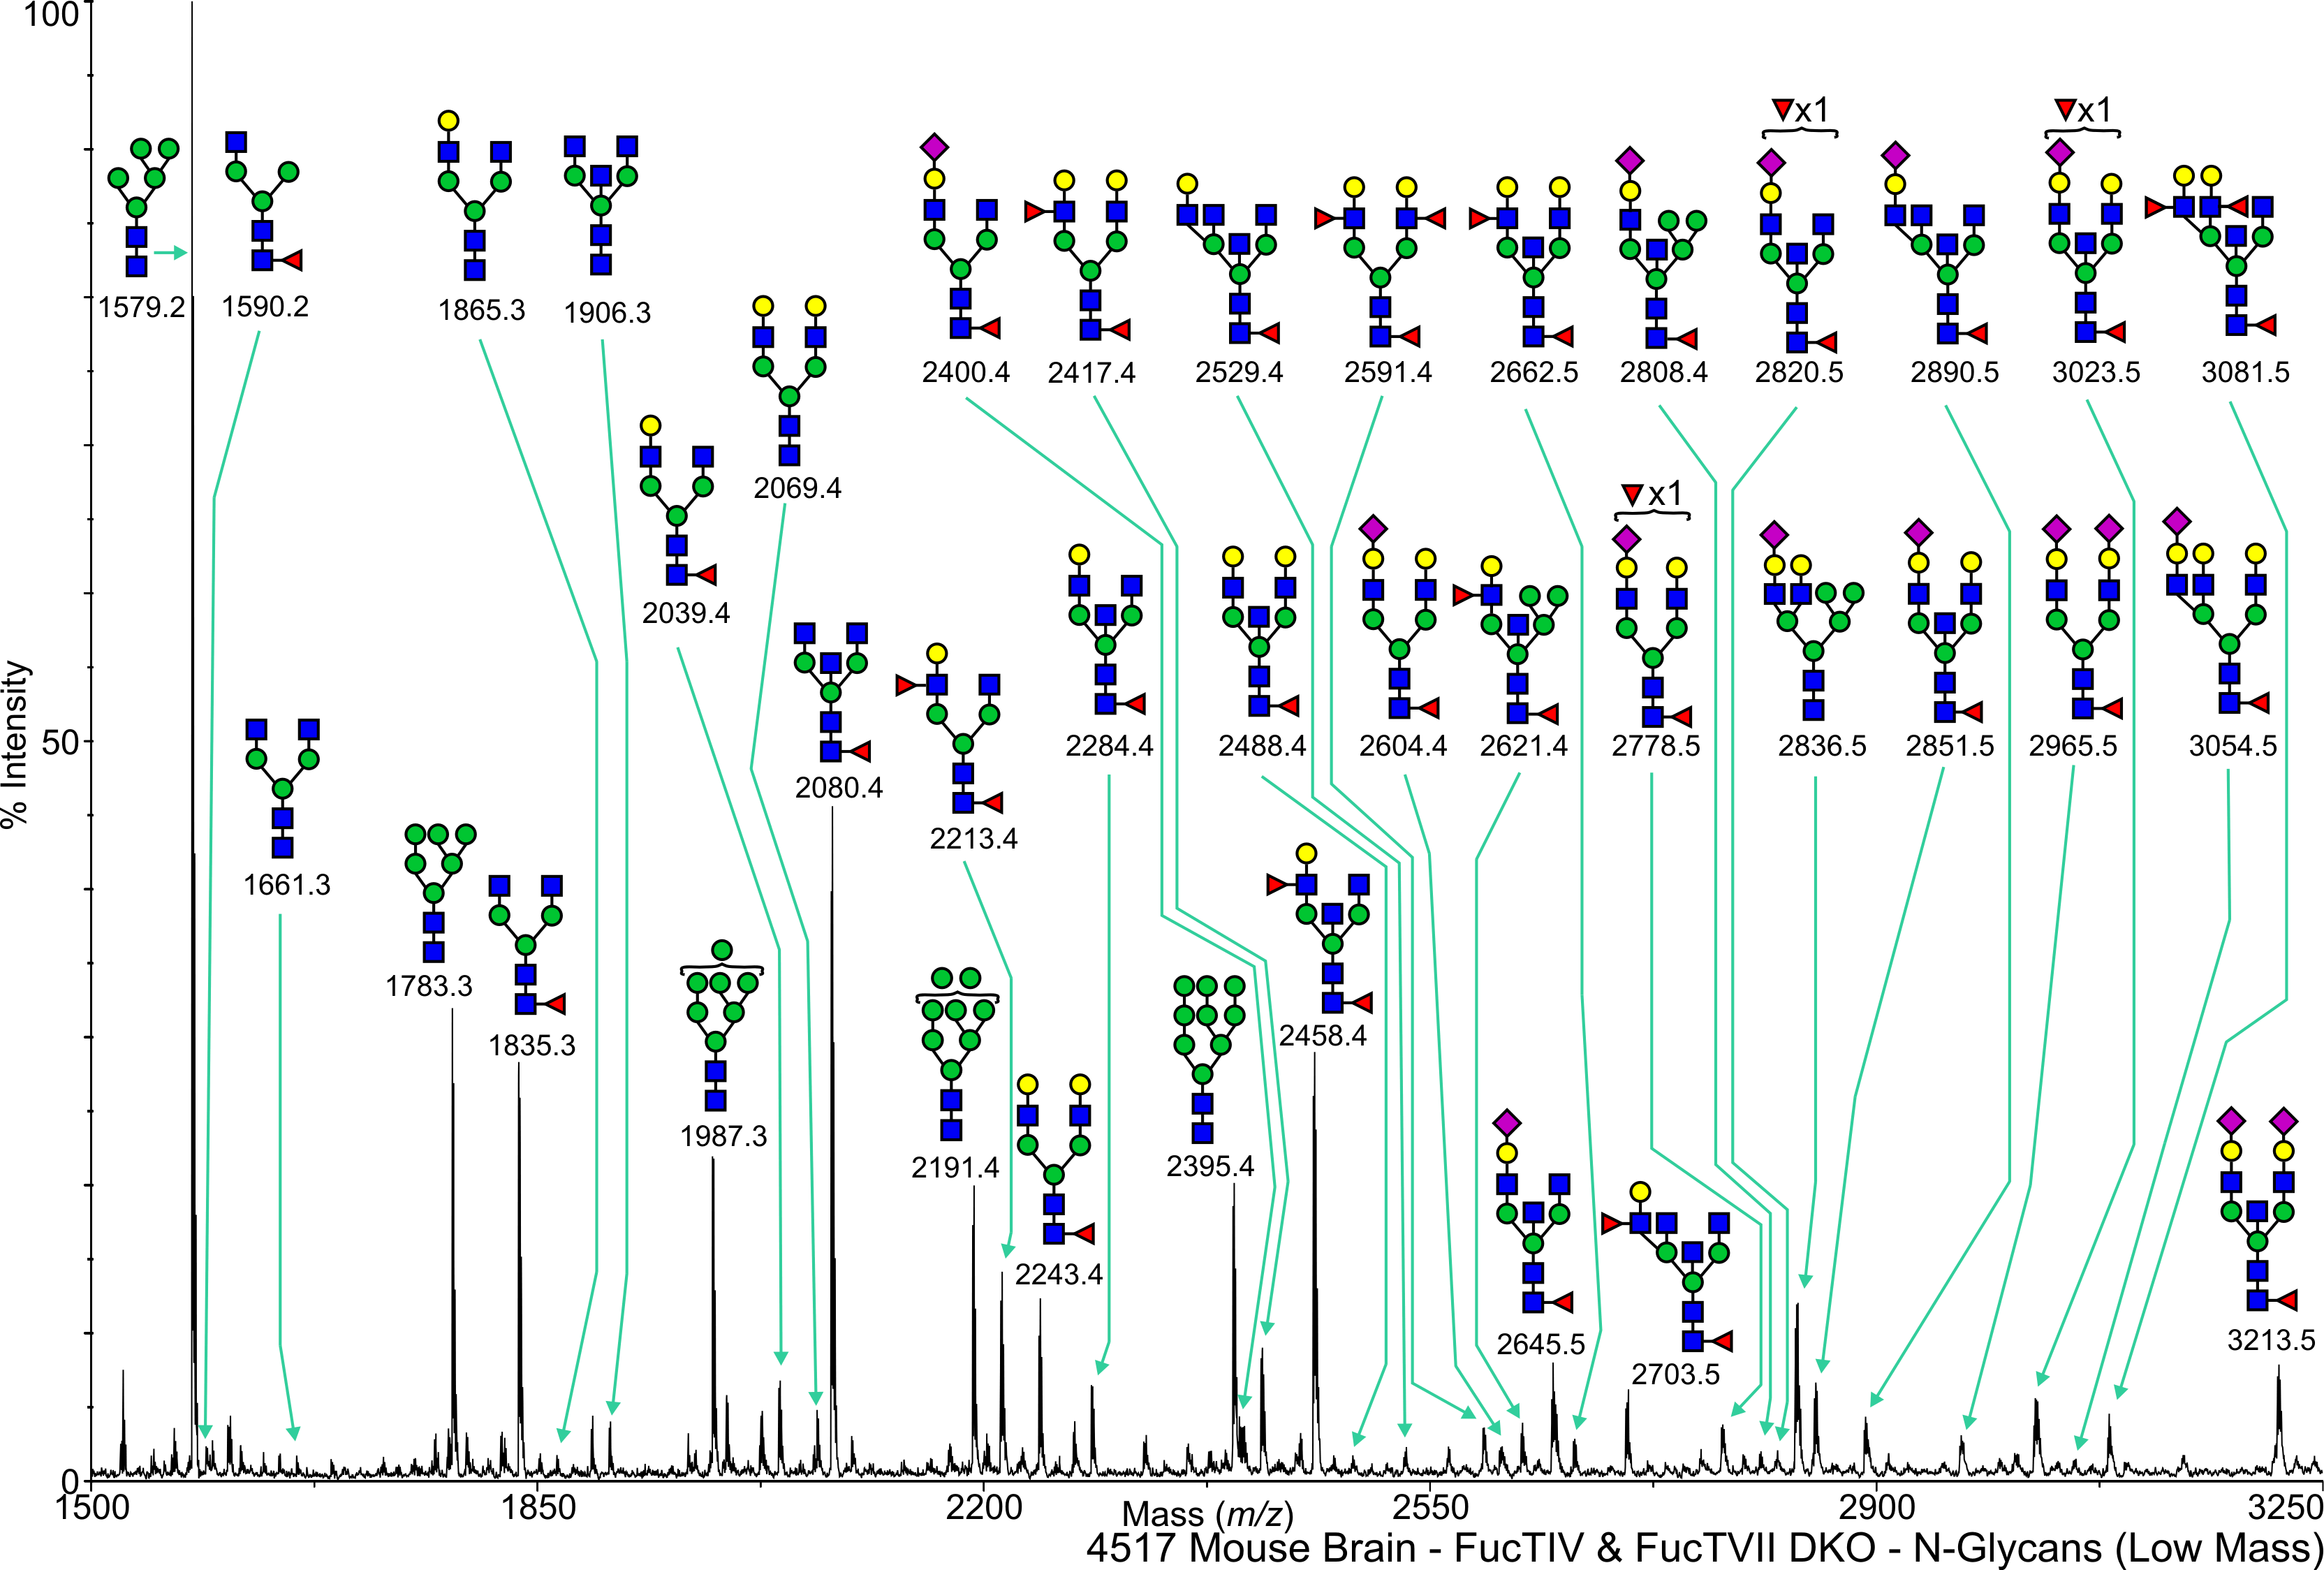
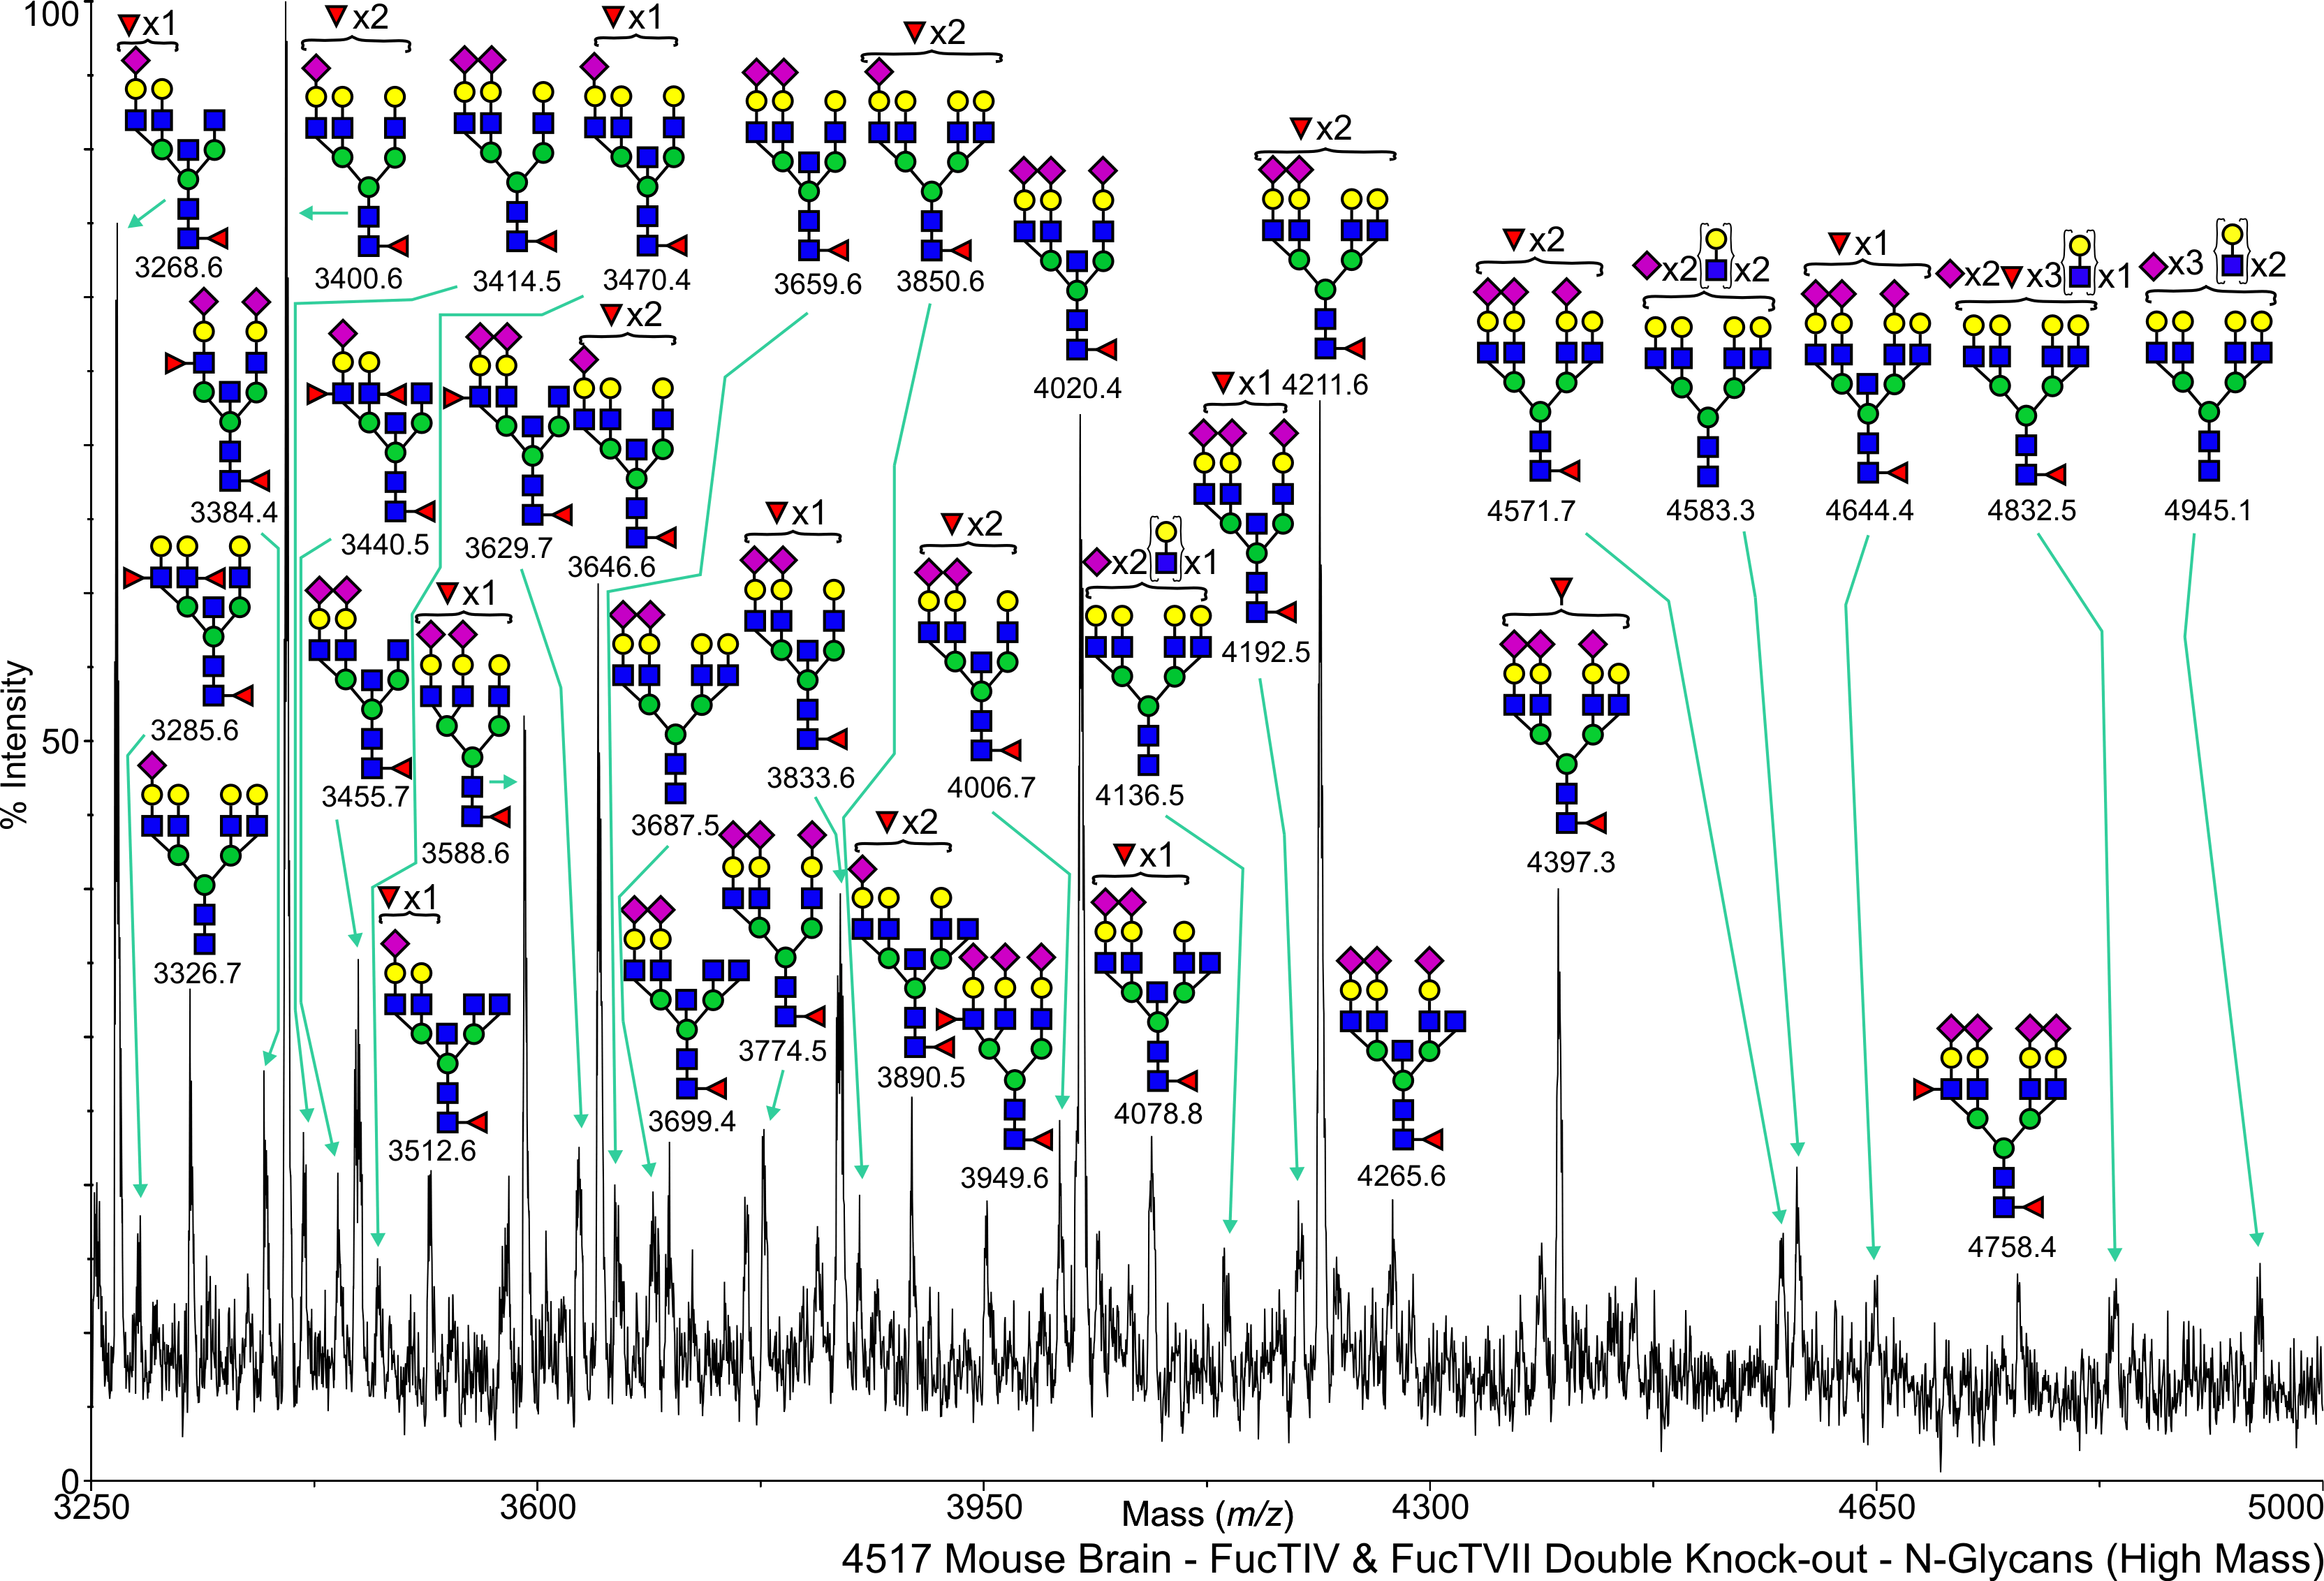
FC Mouse Fuct IV + VII Brain N-Linked C57BL/6 View experimental details      
Annotated file for lower mass range in JPG formatAnnotated file for higher mass range in JPG format Annotated file for lower mass range in PDF formatAnnotated file for higher mass range in PDF format
View Mass Spectrum data as text View Mass Peak file   Interactive Mass Spectrum Viewer
GT Mouse Gal 3 Brain N-Linked C57BL/6 View experimental details      
   
View Mass Spectrum data as text      
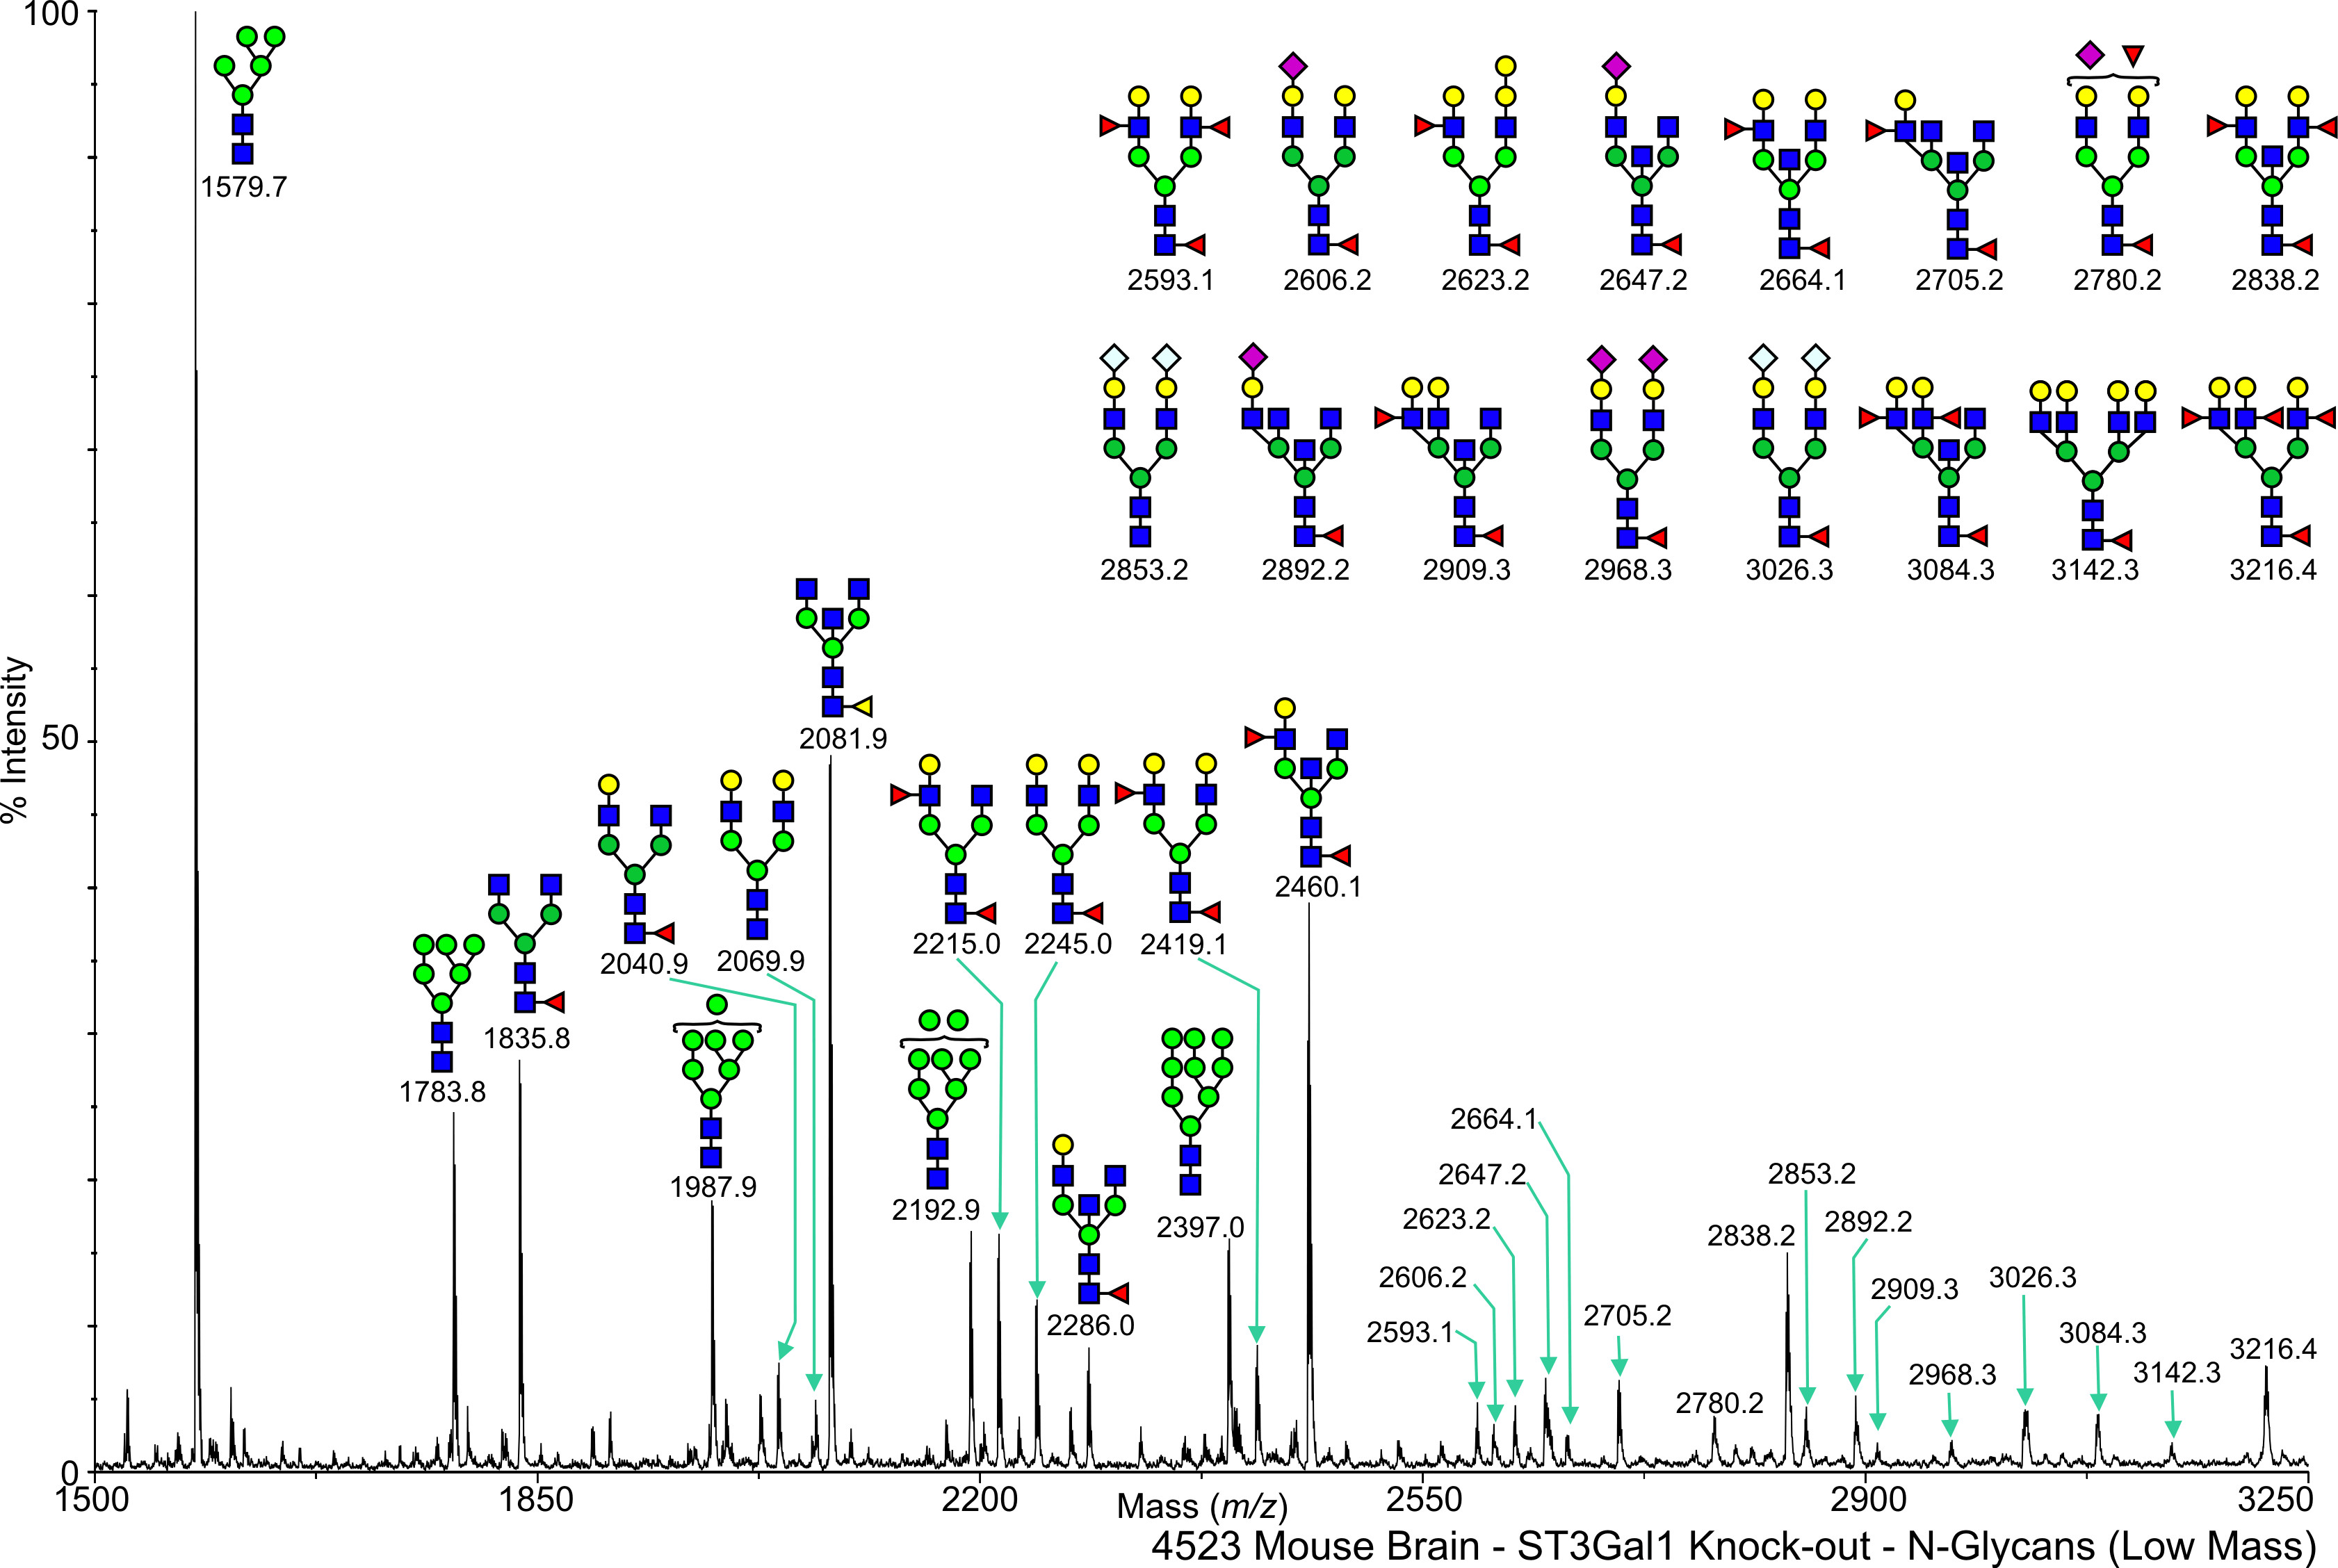
ST Mouse ST3 Gal 1 Brain N-Linked C57BL/6 View experimental details      
Annotated file in JPG format Annotated file in PDF format
View Mass Spectrum data as text View Mass Peak file   Interactive Mass Spectrum Viewer
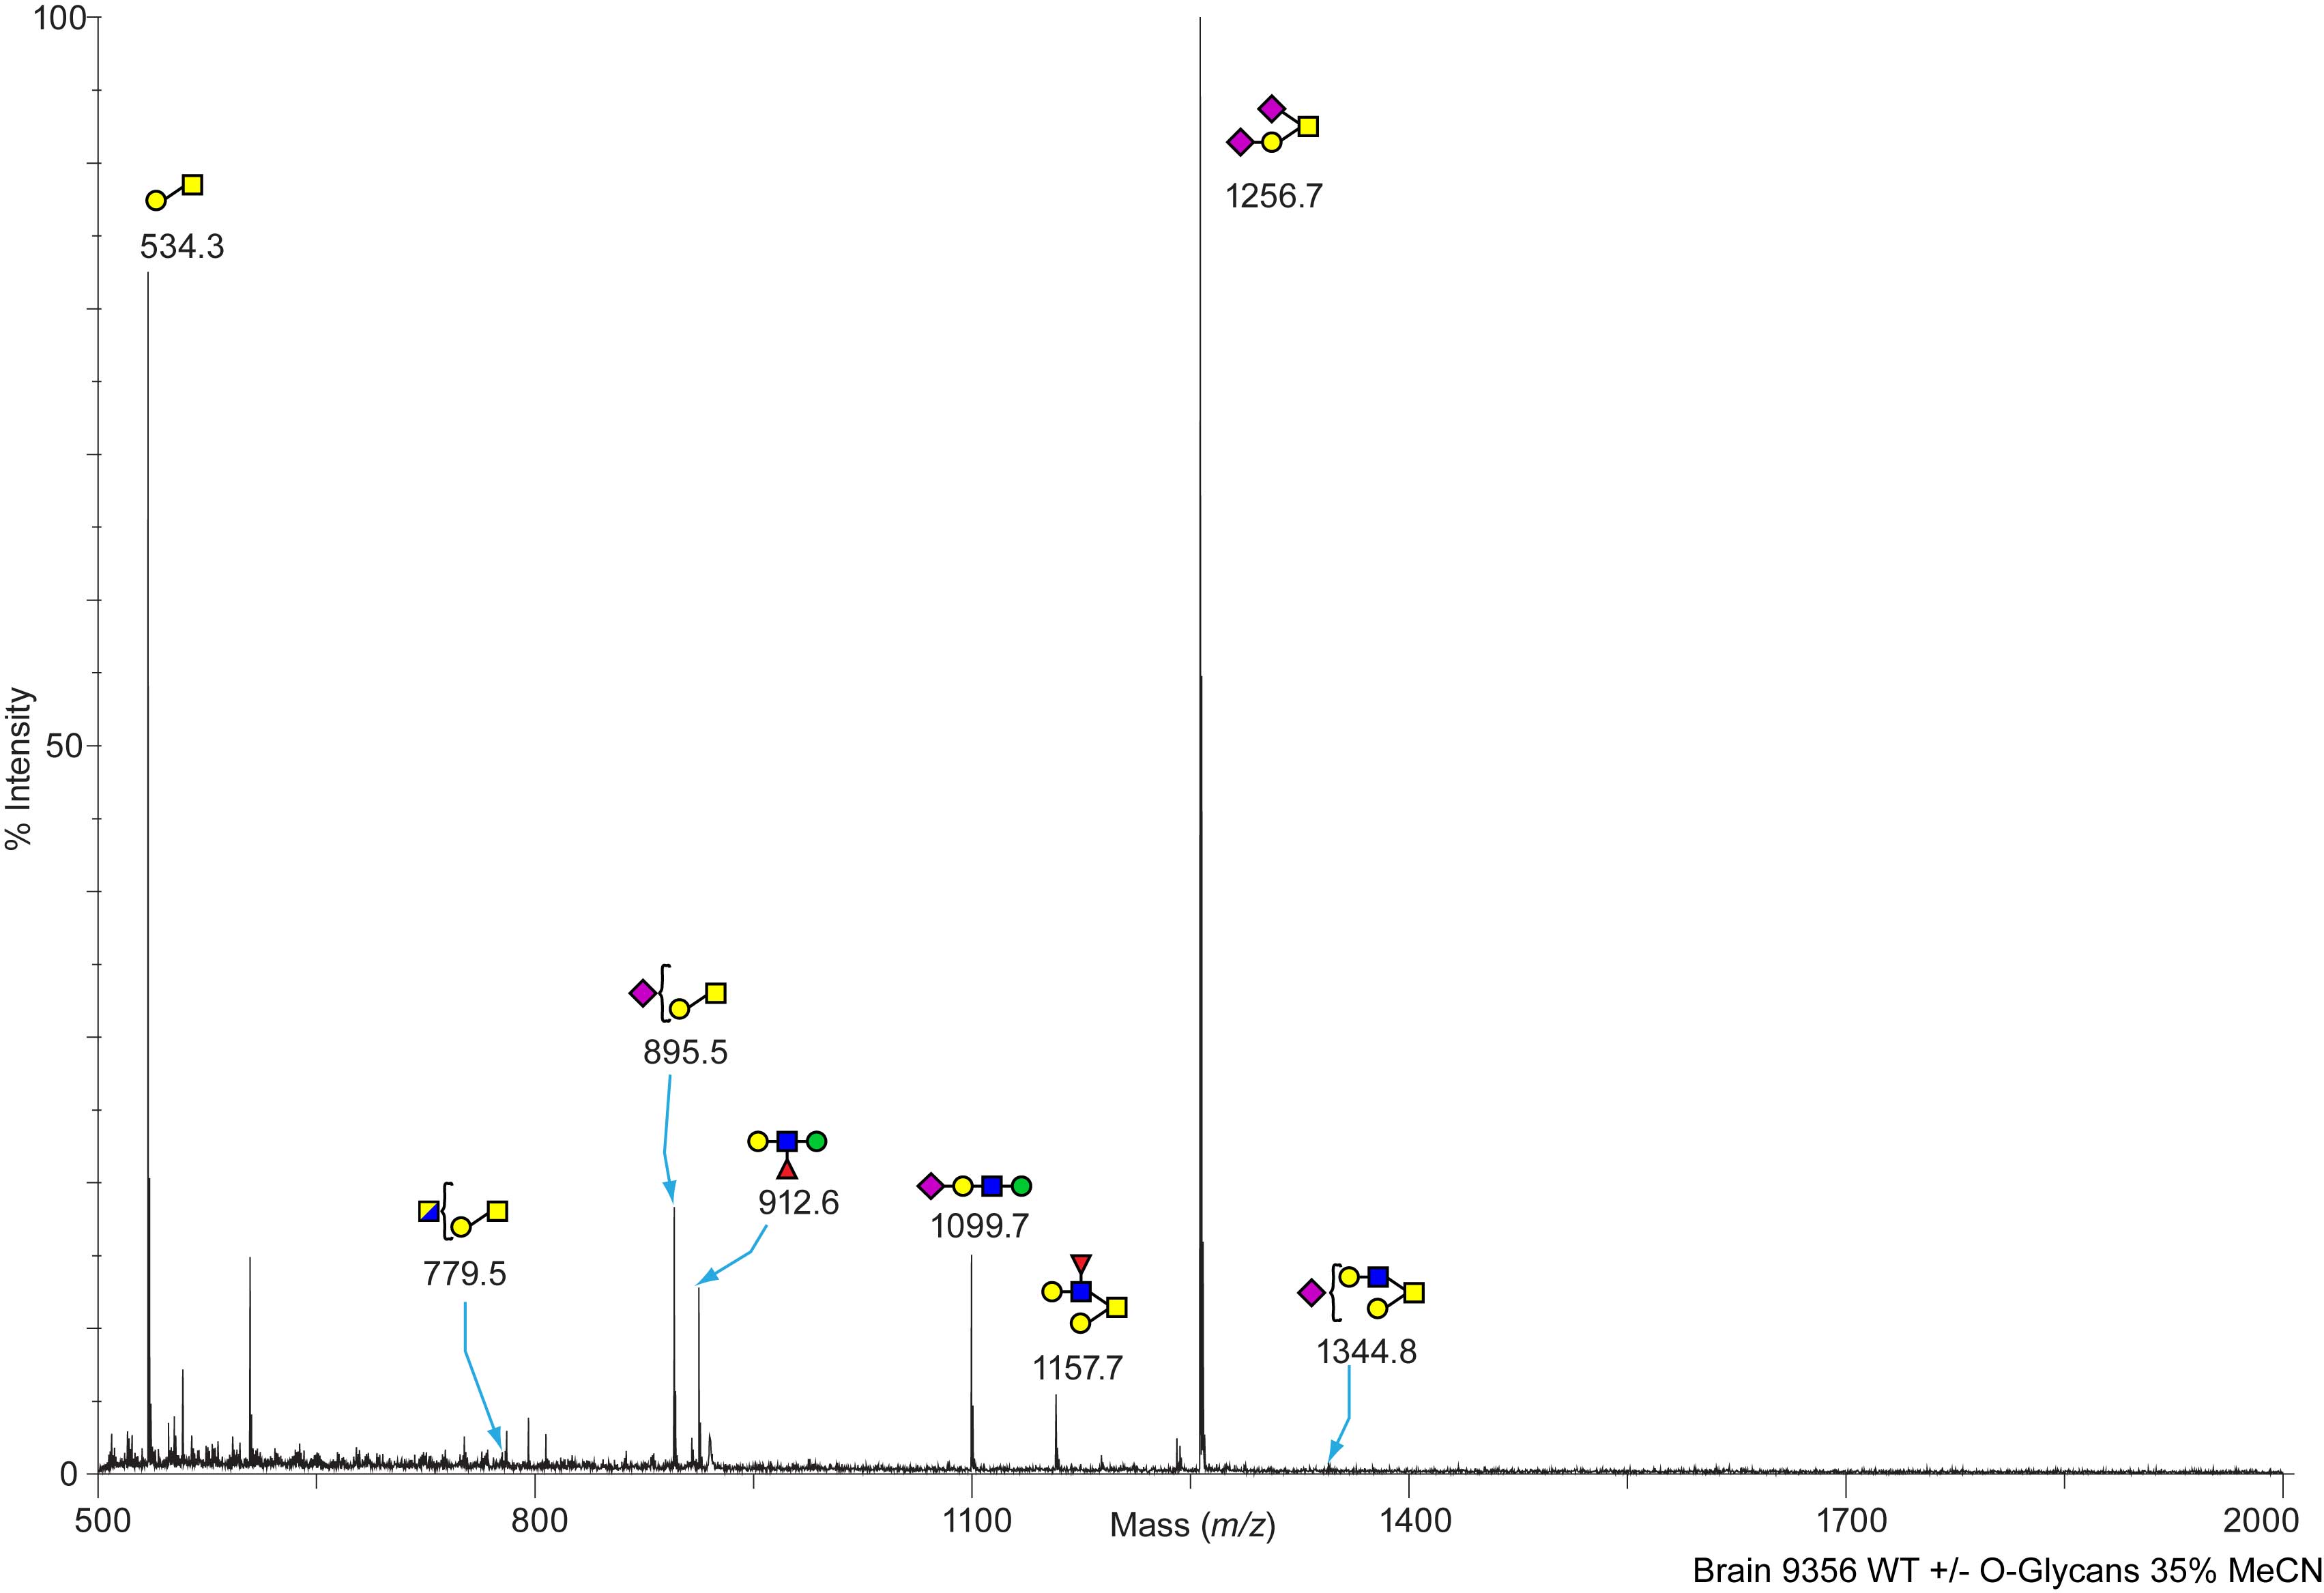
Mouse Wild Type Brain O-Linked C57BL/6 View experimental details      
   
View Mass Spectrum data as text      
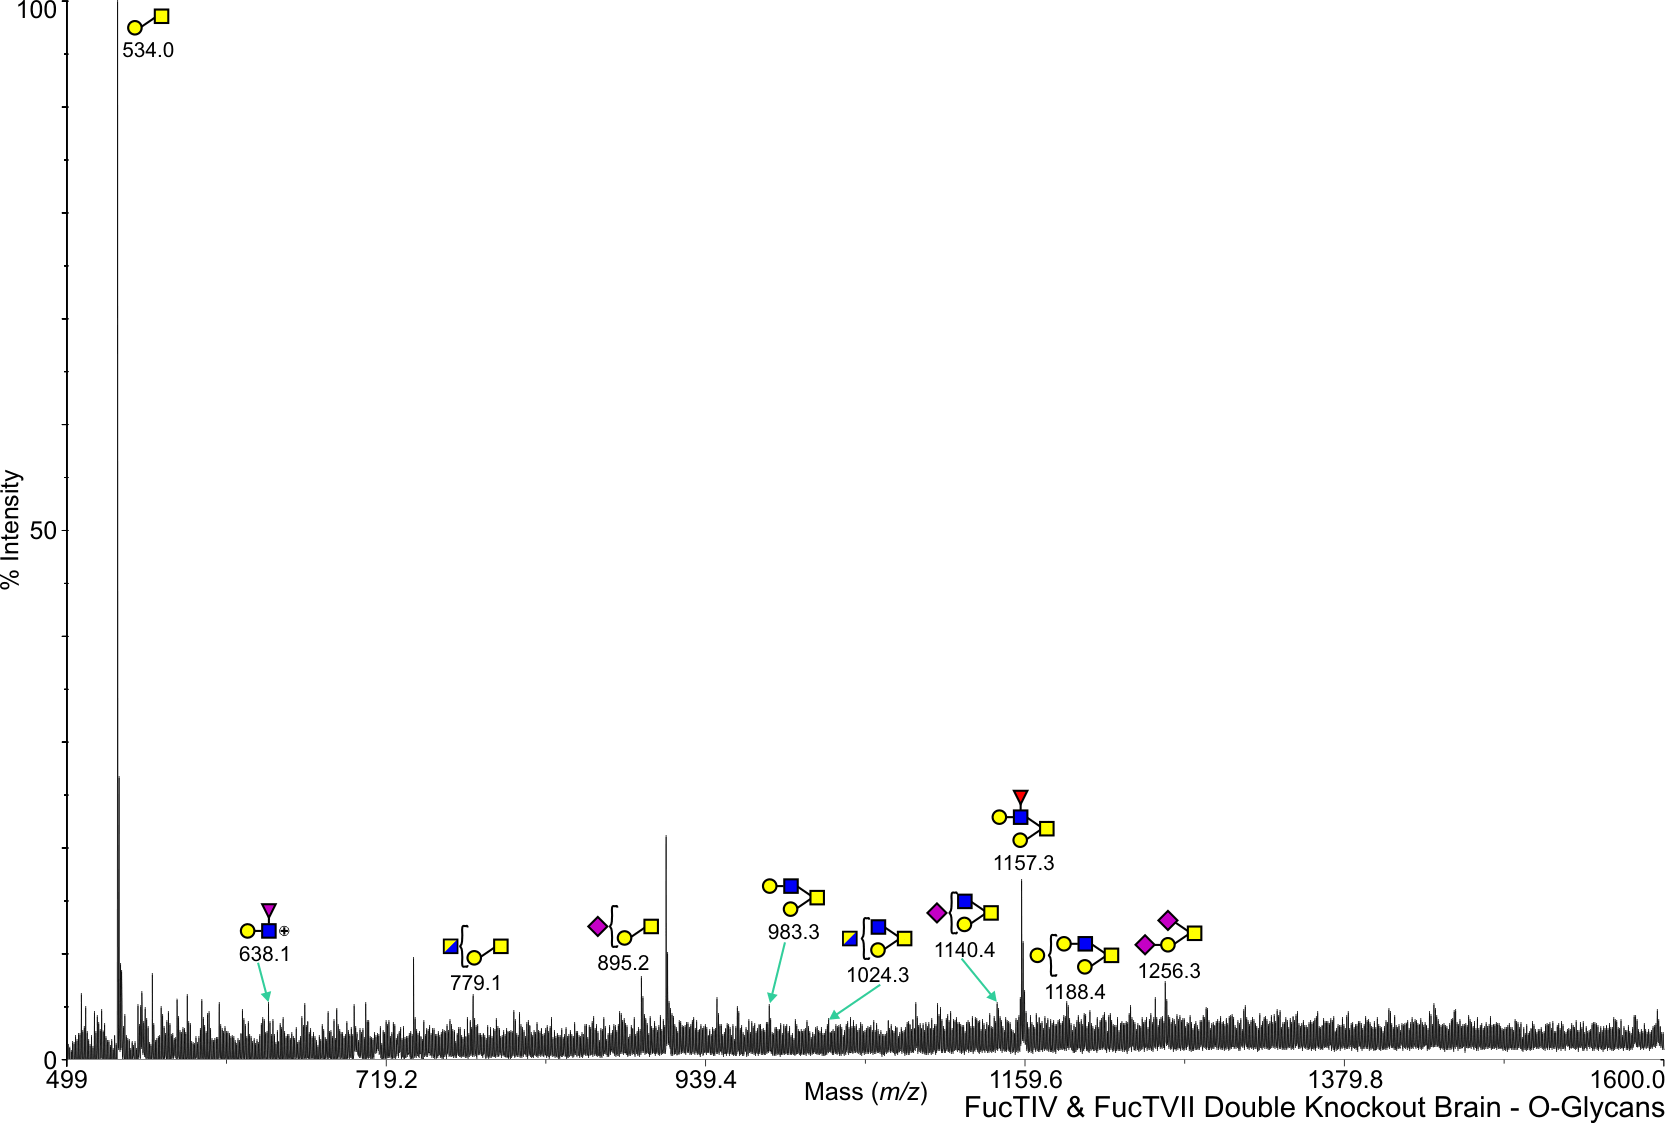
FC Mouse Fuct IV + VII Brain O-Linked C57BL/6 View experimental details      
Annotated file in JPG format Annotated file in PDF format
View Mass Spectrum data as text View Mass Peak file   Interactive Mass Spectrum Viewer
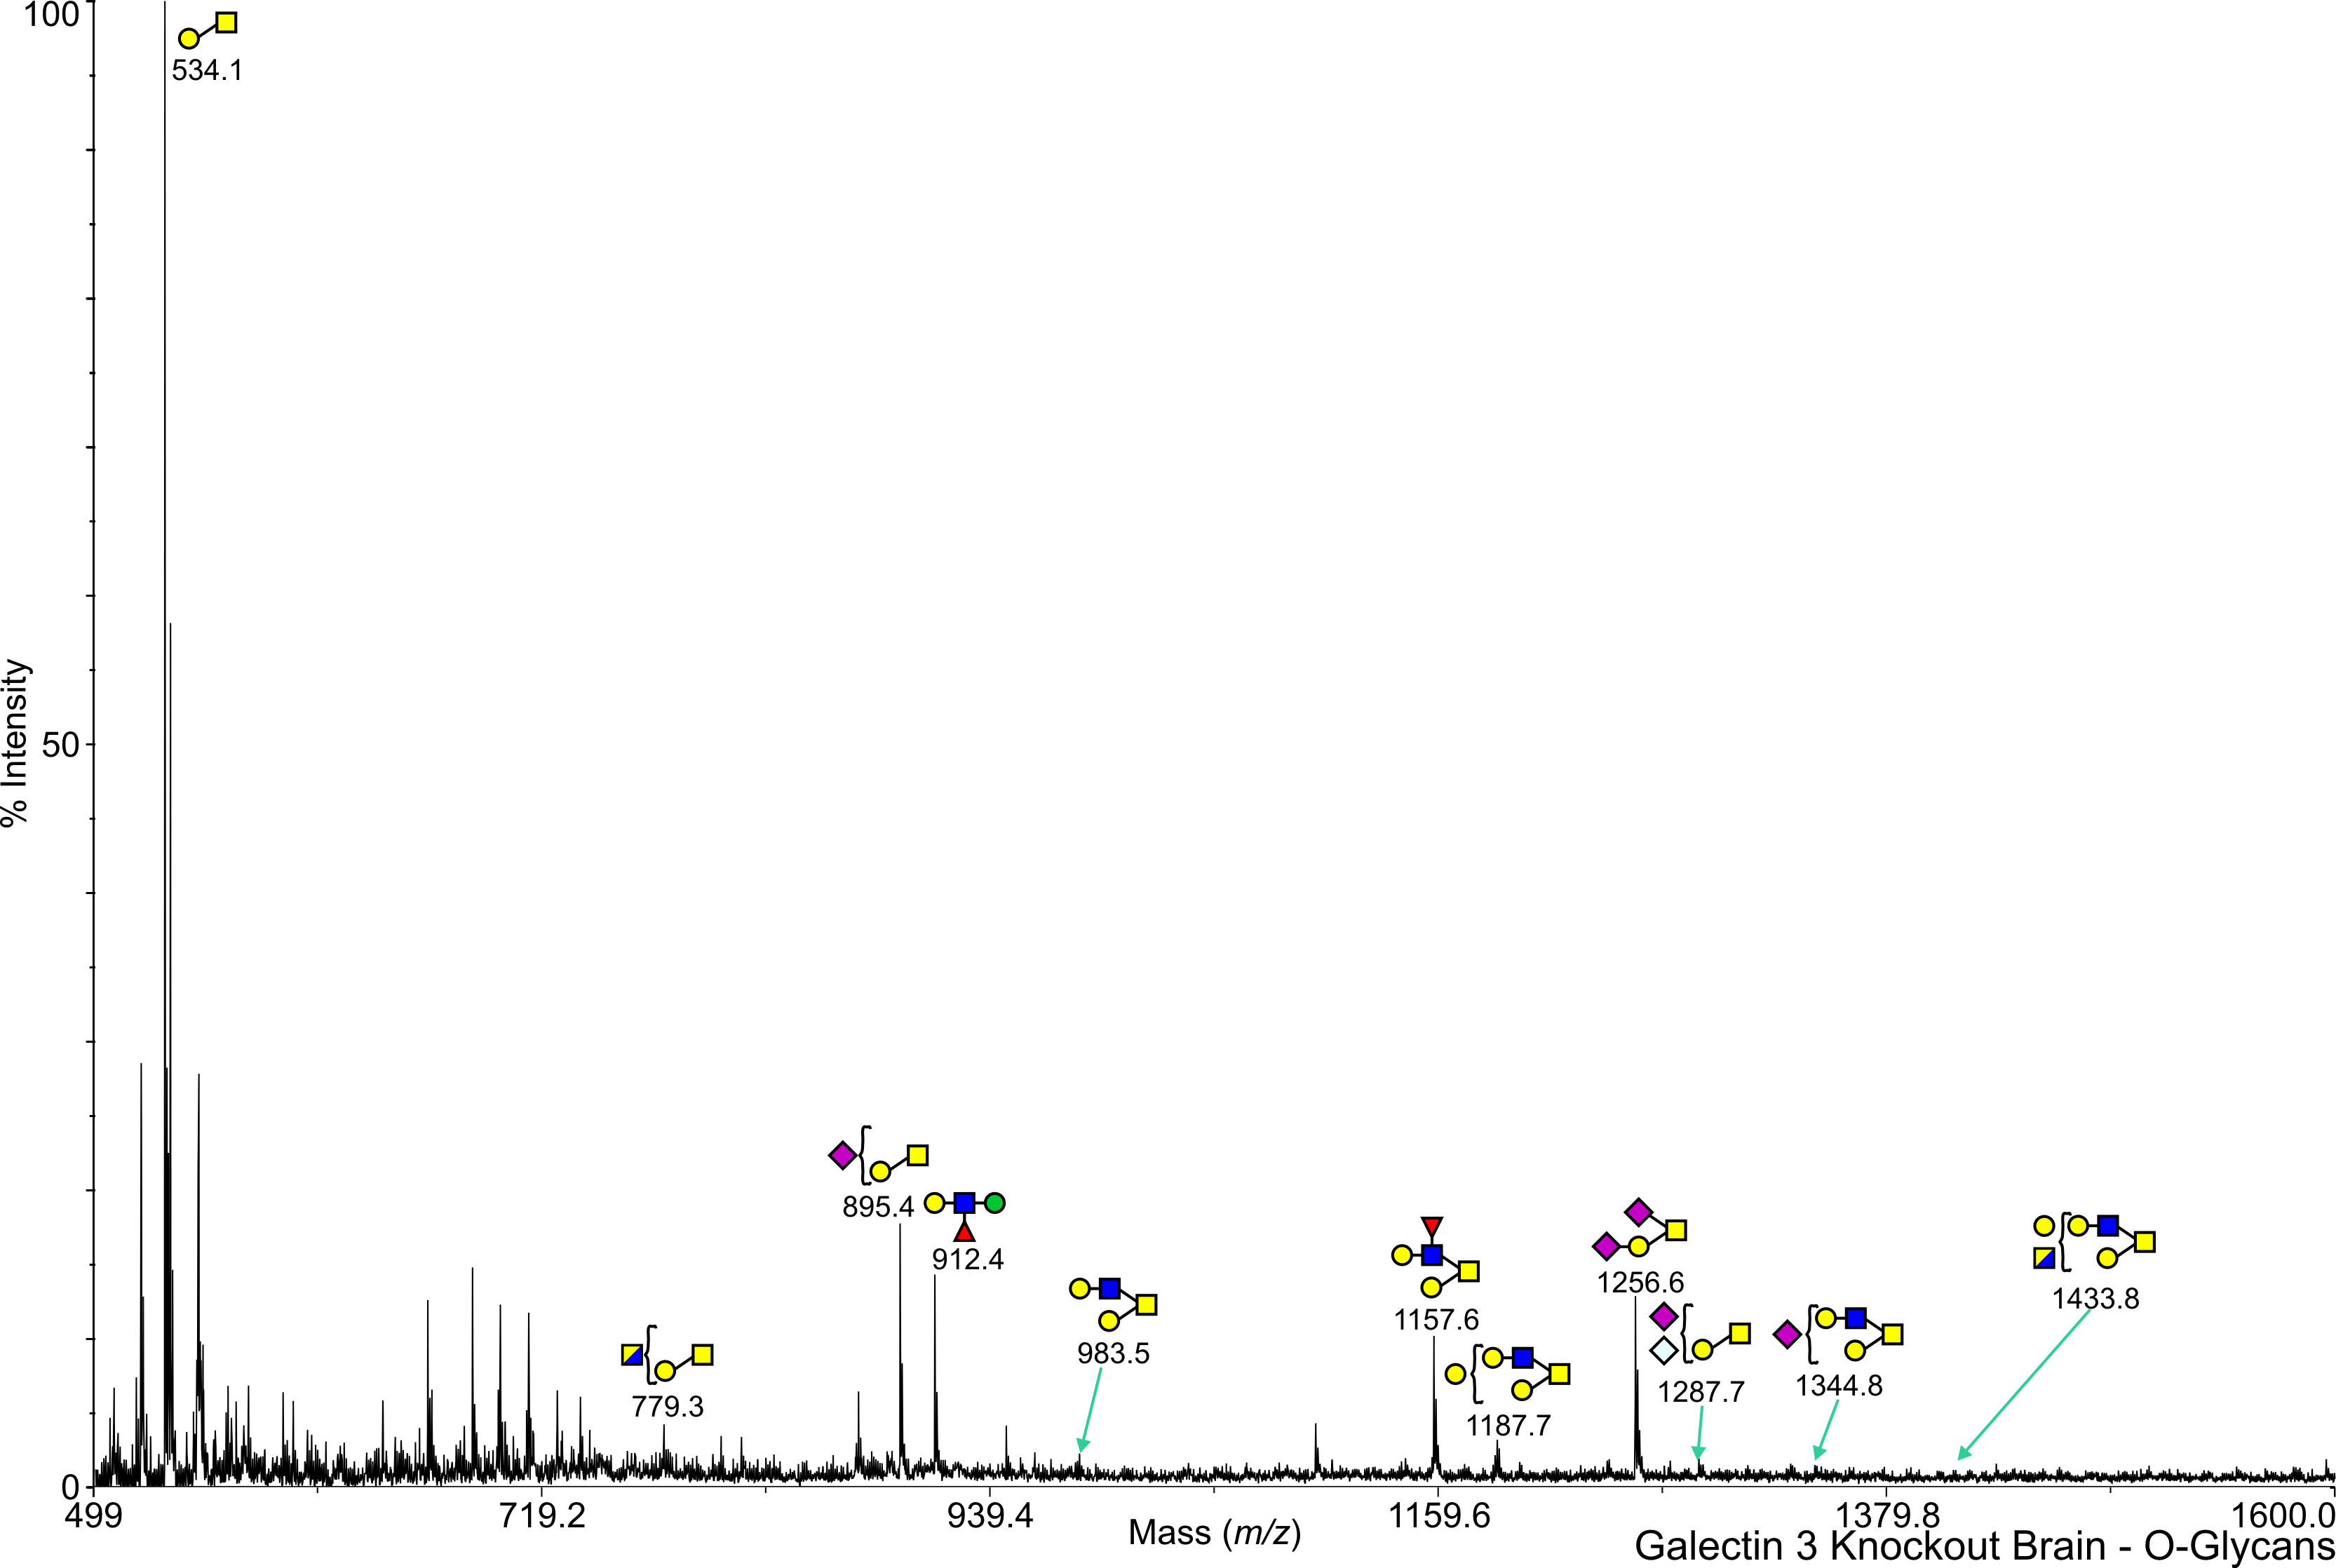
GT Mouse Gal 3 Brain O-Linked C57BL/6 View experimental details      
Annotated file in JPG format Annotated file in PDF format
View Mass Spectrum data as text View Mass Peak file   Interactive Mass Spectrum Viewer
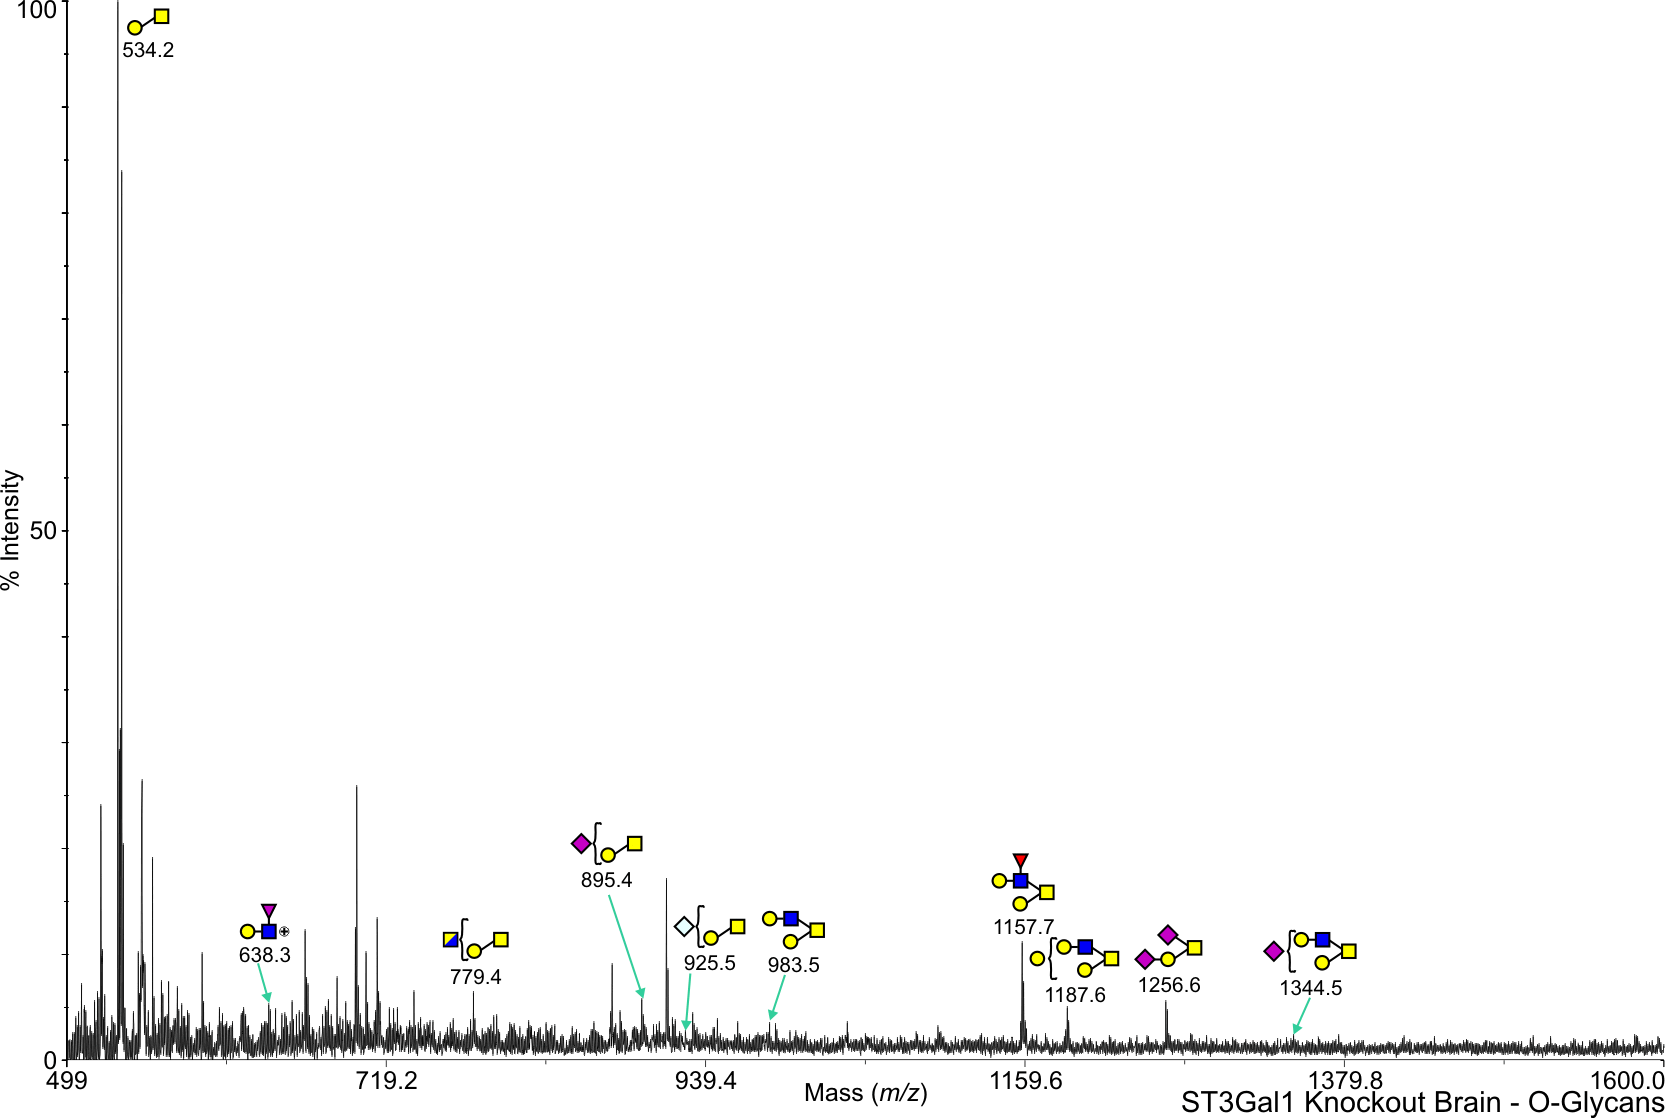
ST Mouse ST3 Gal 1 Brain O-Linked C57BL/6 View experimental details      
Annotated file in JPG format Annotated file in PDF format
View Mass Spectrum data as text View Mass Peak file   Interactive Mass Spectrum Viewer
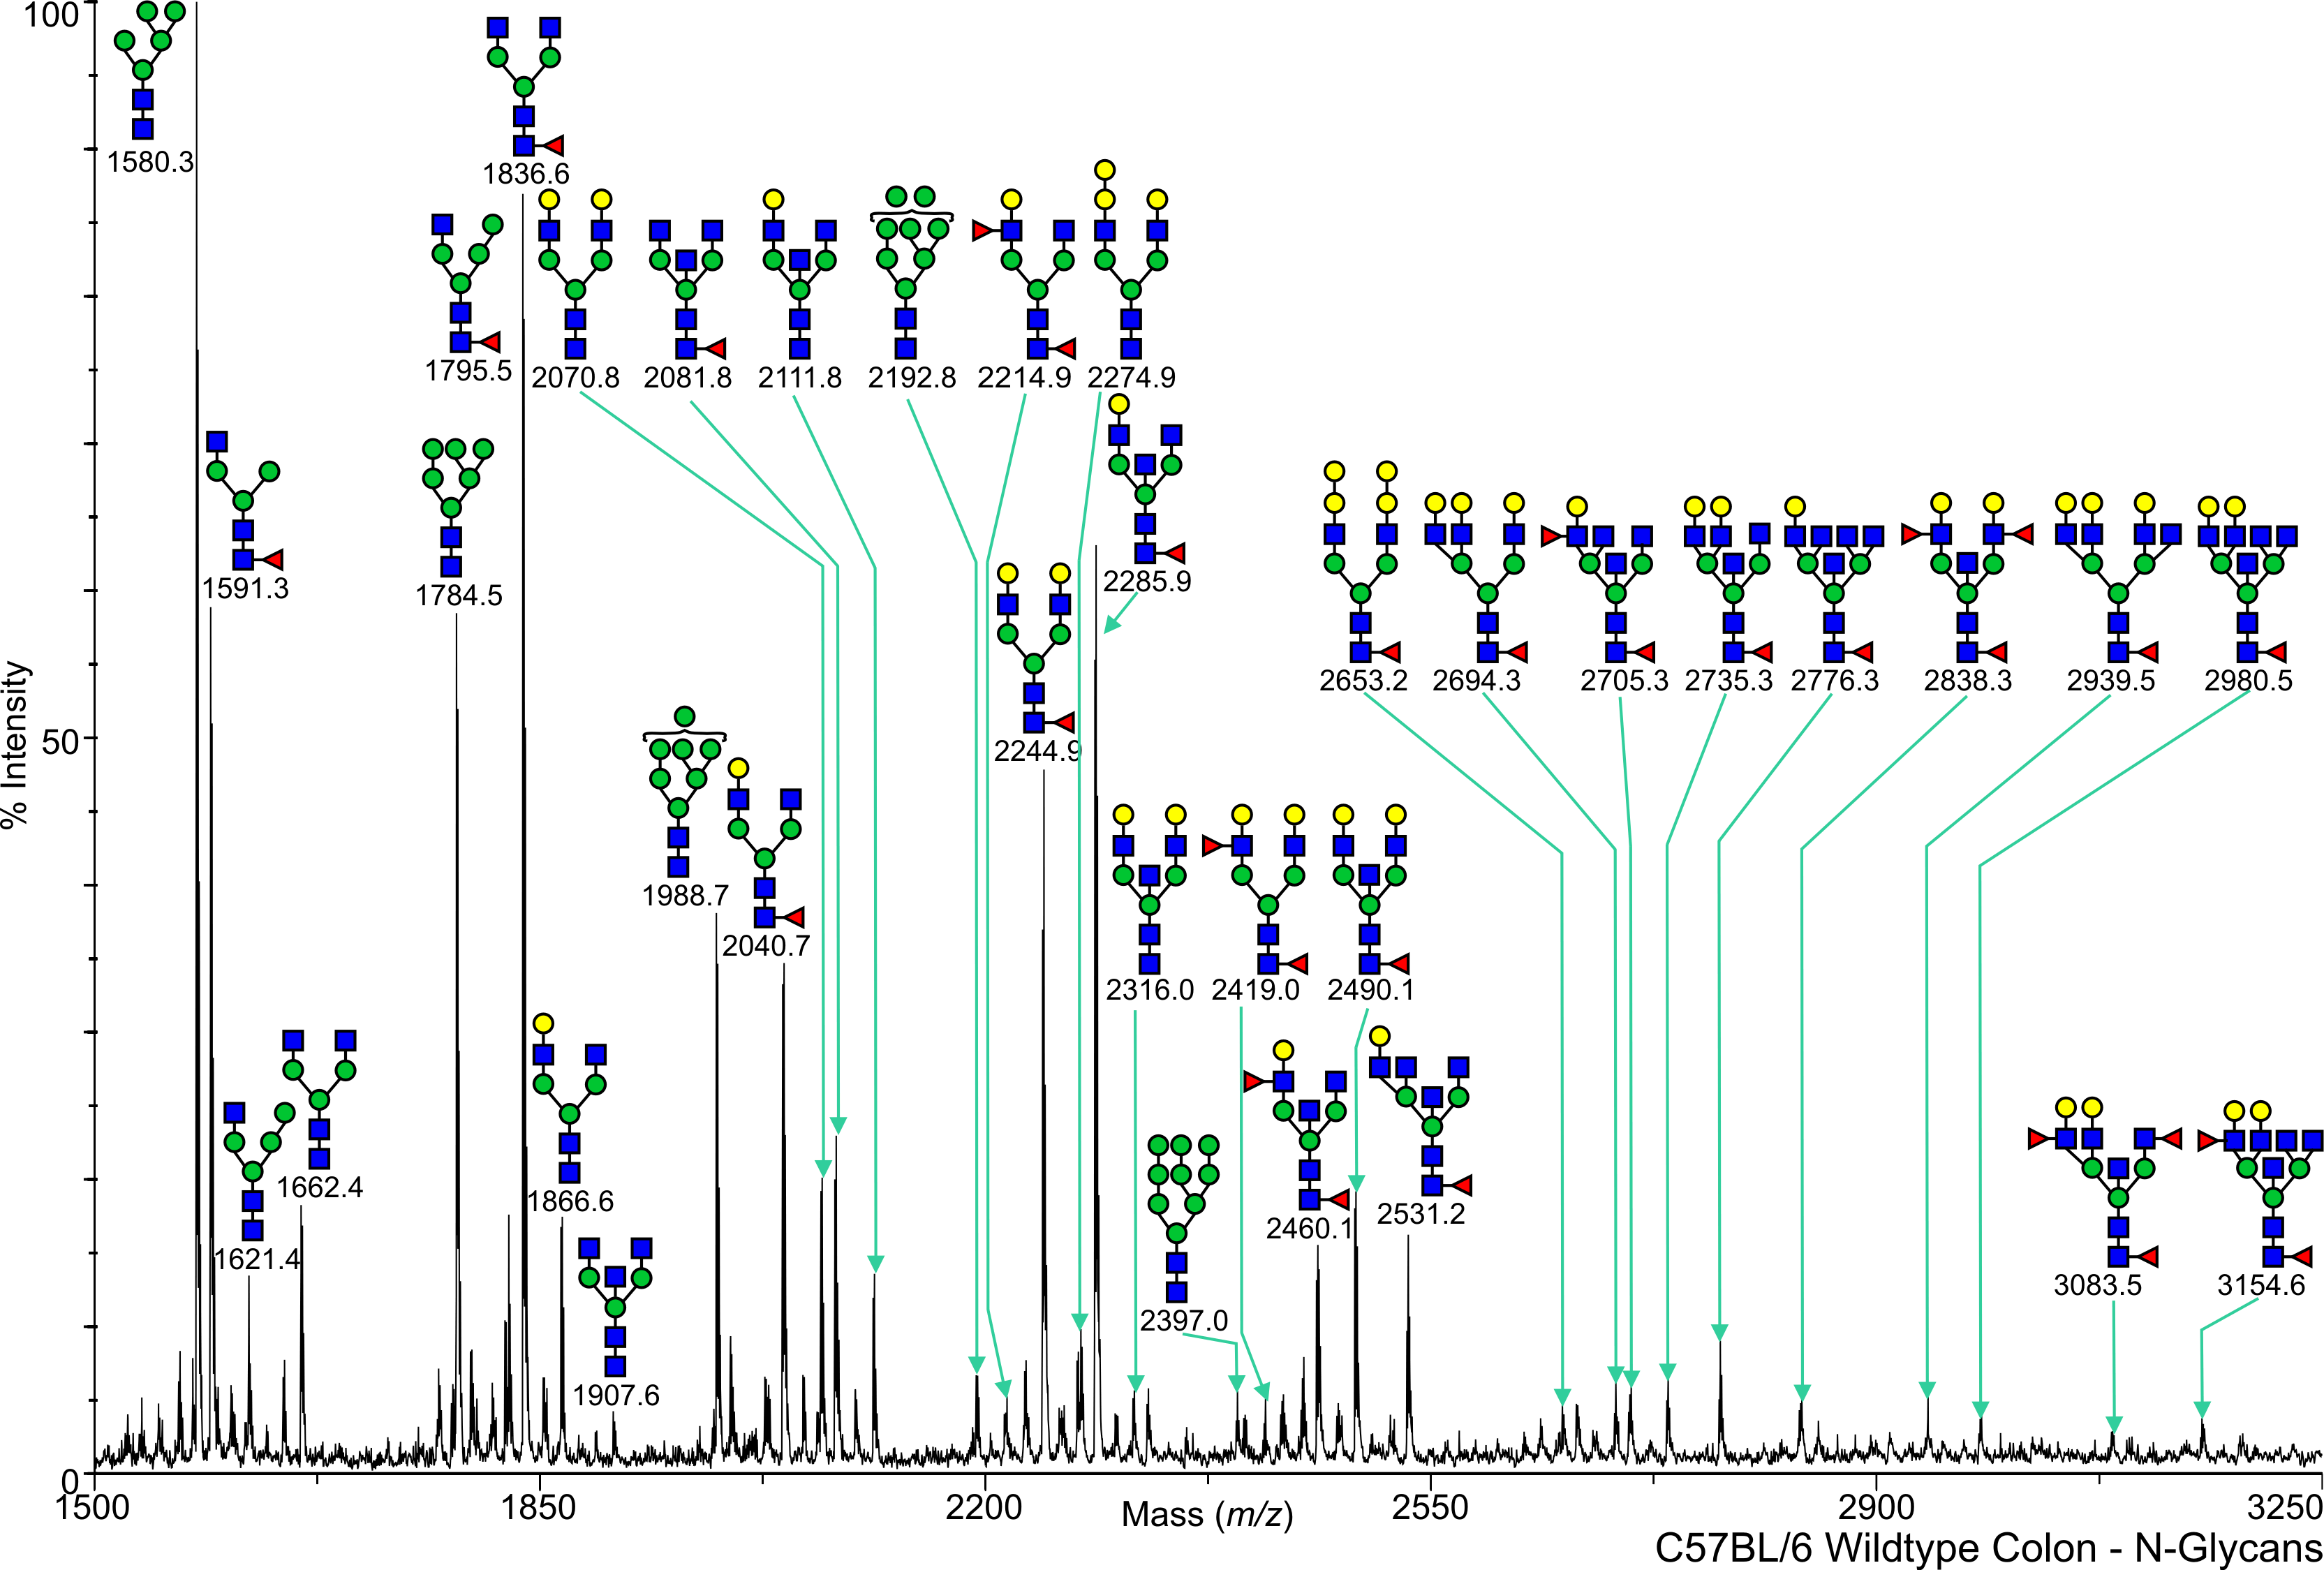
Mouse Wild Type Colon N-Linked C57BL/6 View experimental details      
Annotated file in JPG format Annotated file in PDF format
View Mass Spectrum data as text View Mass Peak file   Interactive Mass Spectrum Viewer
FC Mouse Fuct IV + VII Colon N-Linked C57BL/6 View experimental details      
   
View Mass Spectrum data as text      
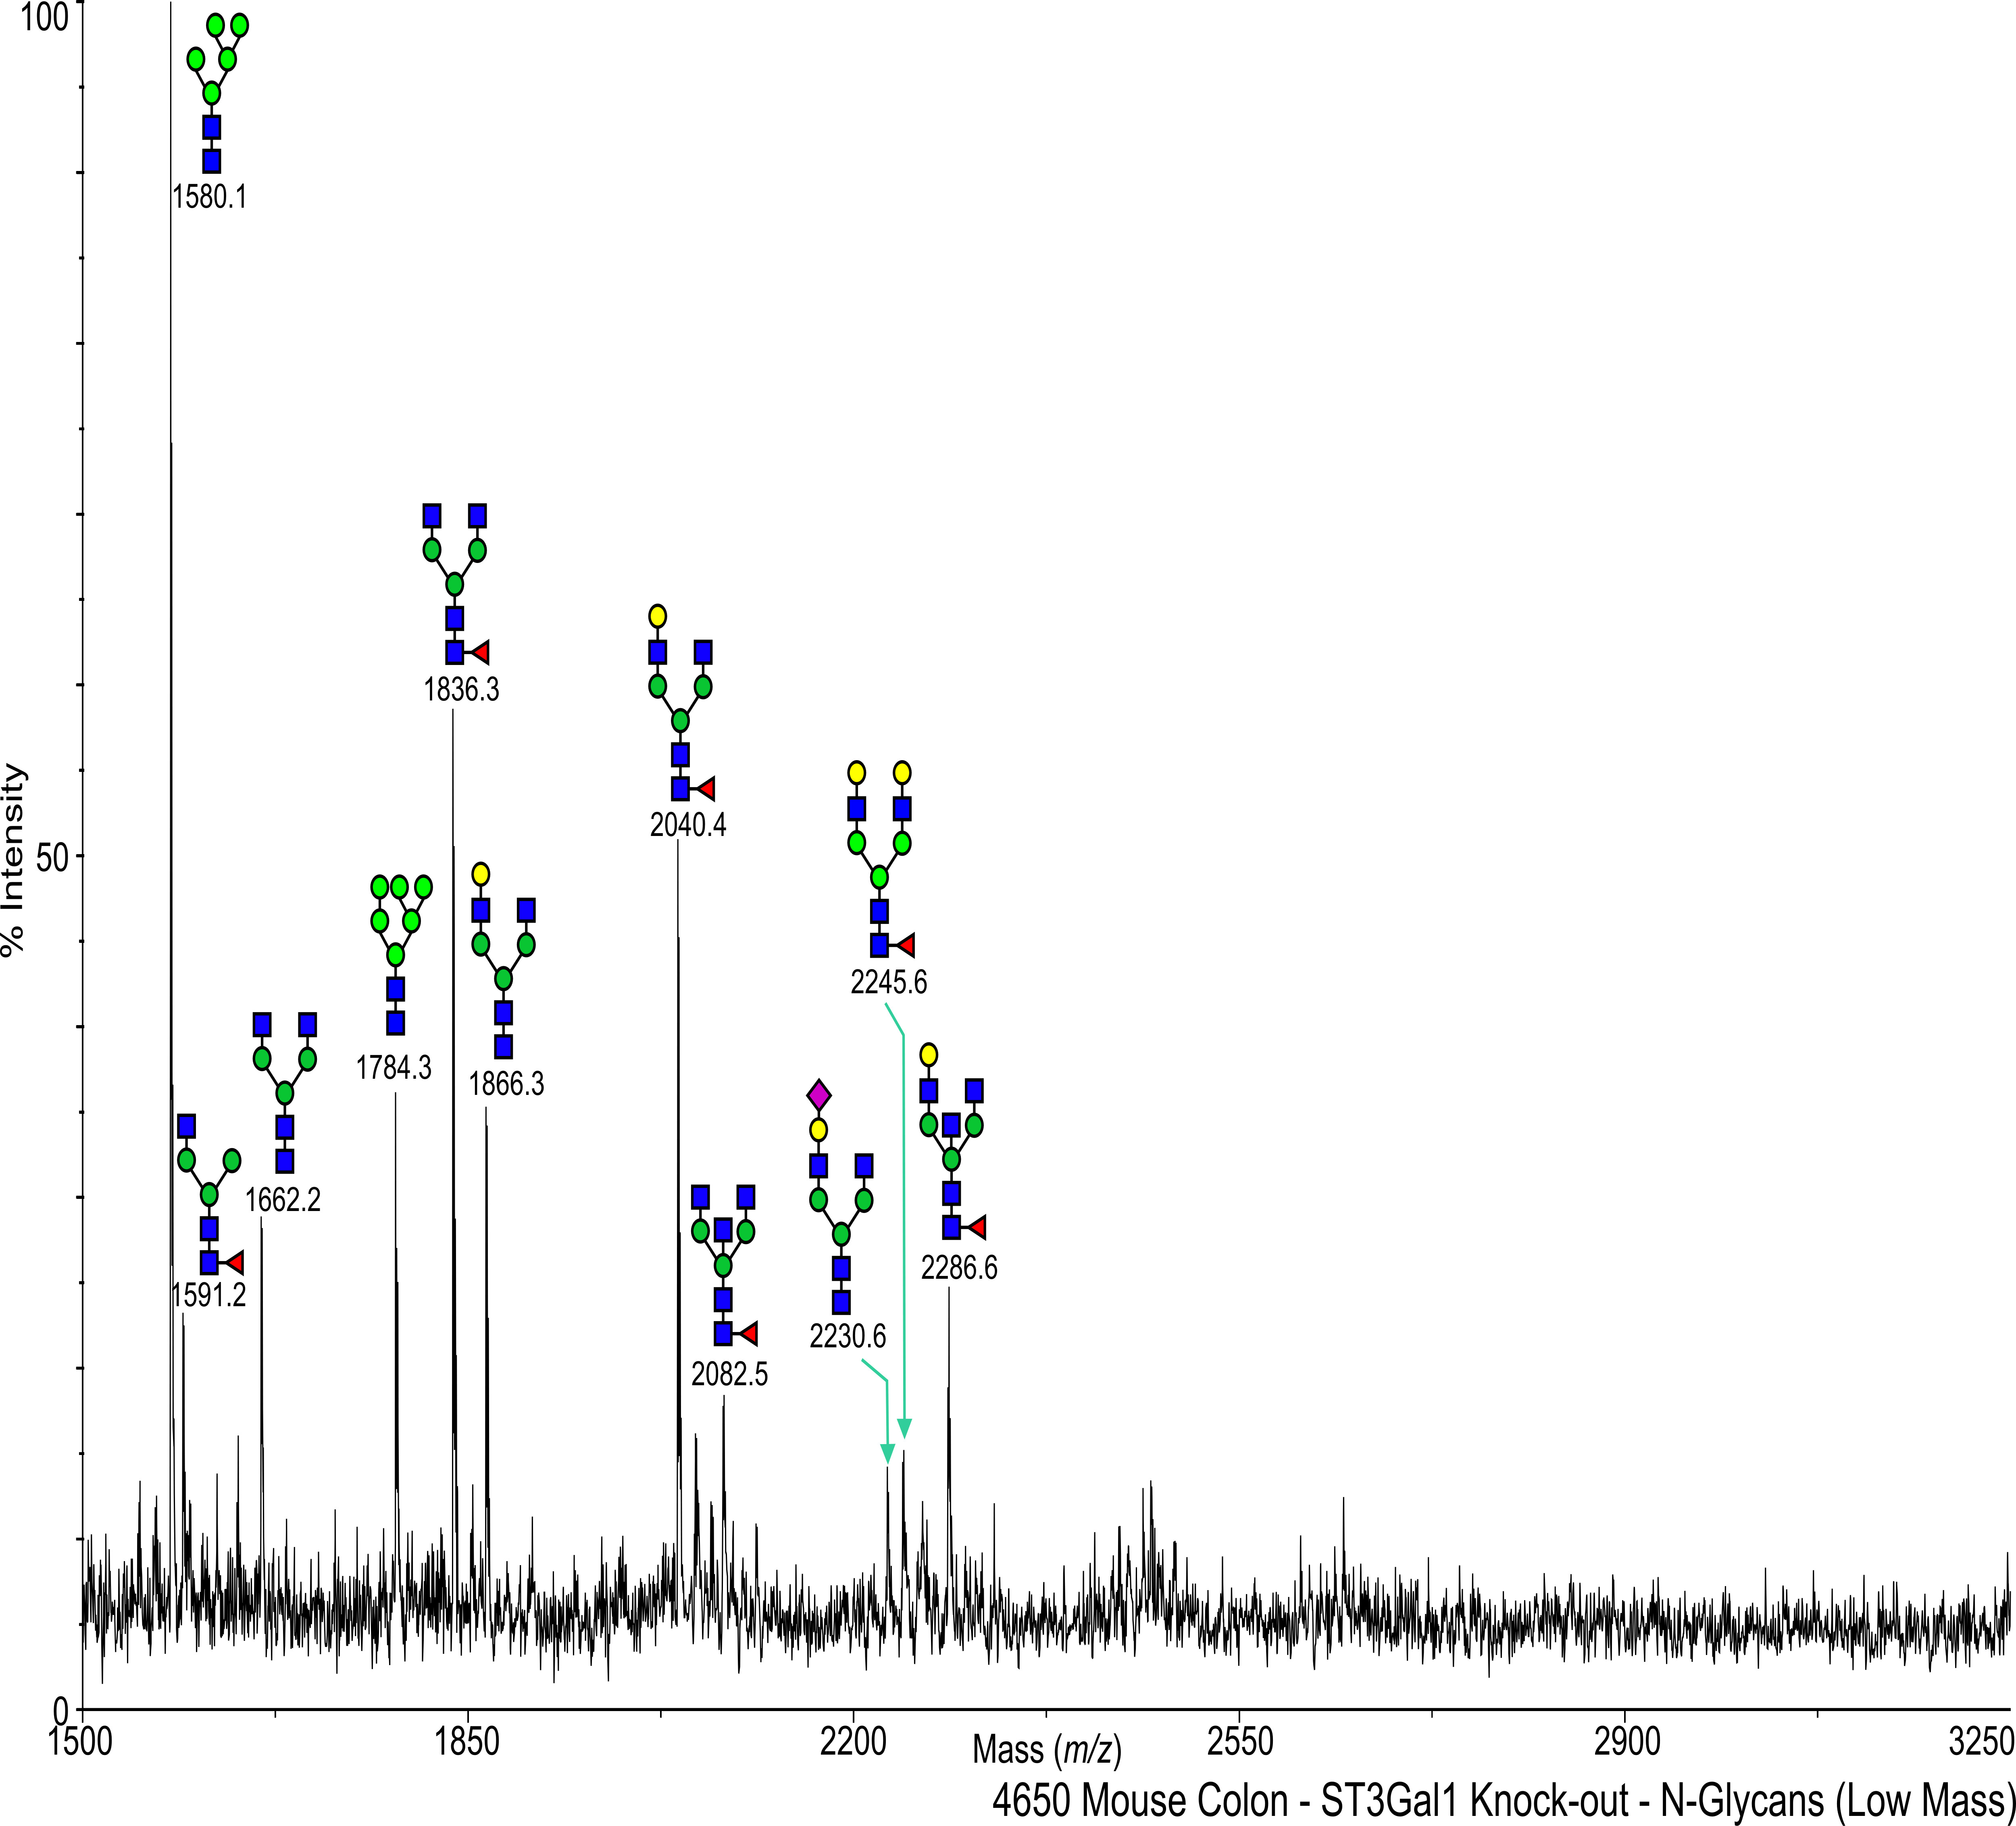
ST Mouse ST3 Gal 1 Colon N-Linked C57BL/6 View experimental details      
Annotated file in JPG format Annotated file in PDF format
View Mass Spectrum data as text View Mass Peak file   Interactive Mass Spectrum Viewer
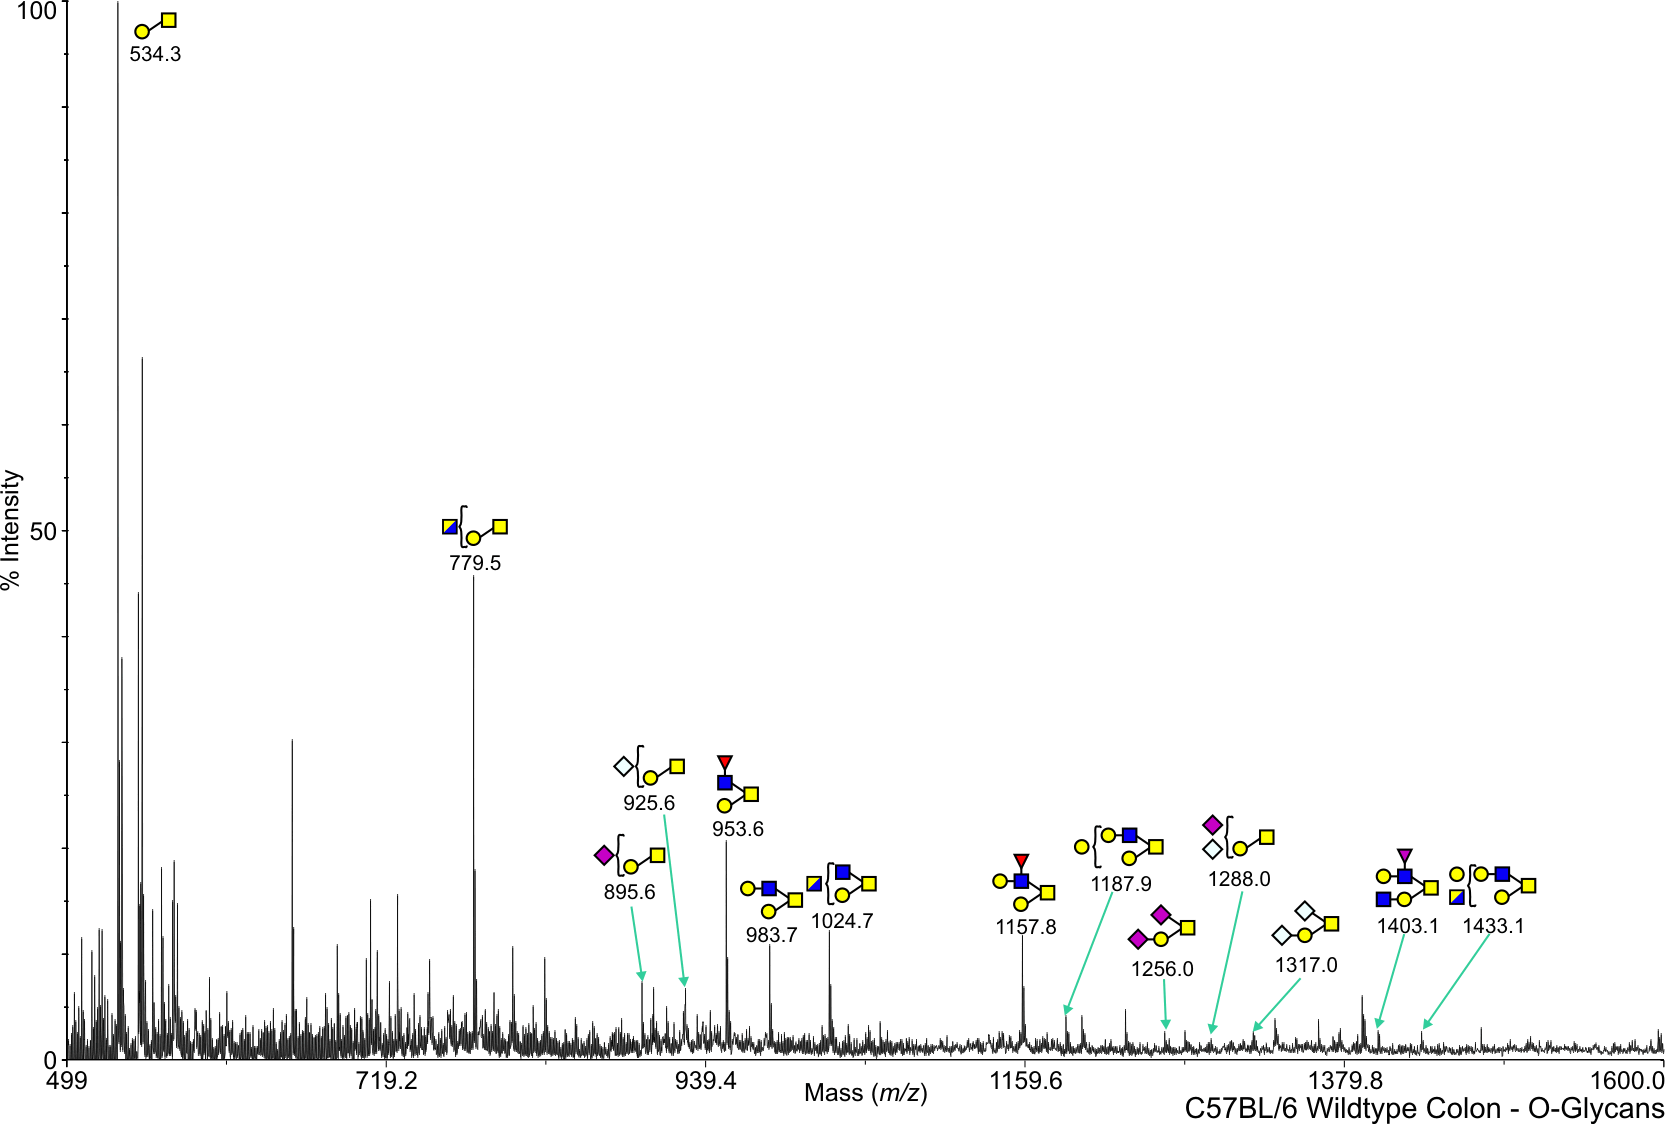
Mouse Wild Type Colon O-Linked C57BL/6 View experimental details      
Annotated file in JPG format Annotated file in PDF format
View Mass Spectrum data as text View Mass Peak file   Interactive Mass Spectrum Viewer
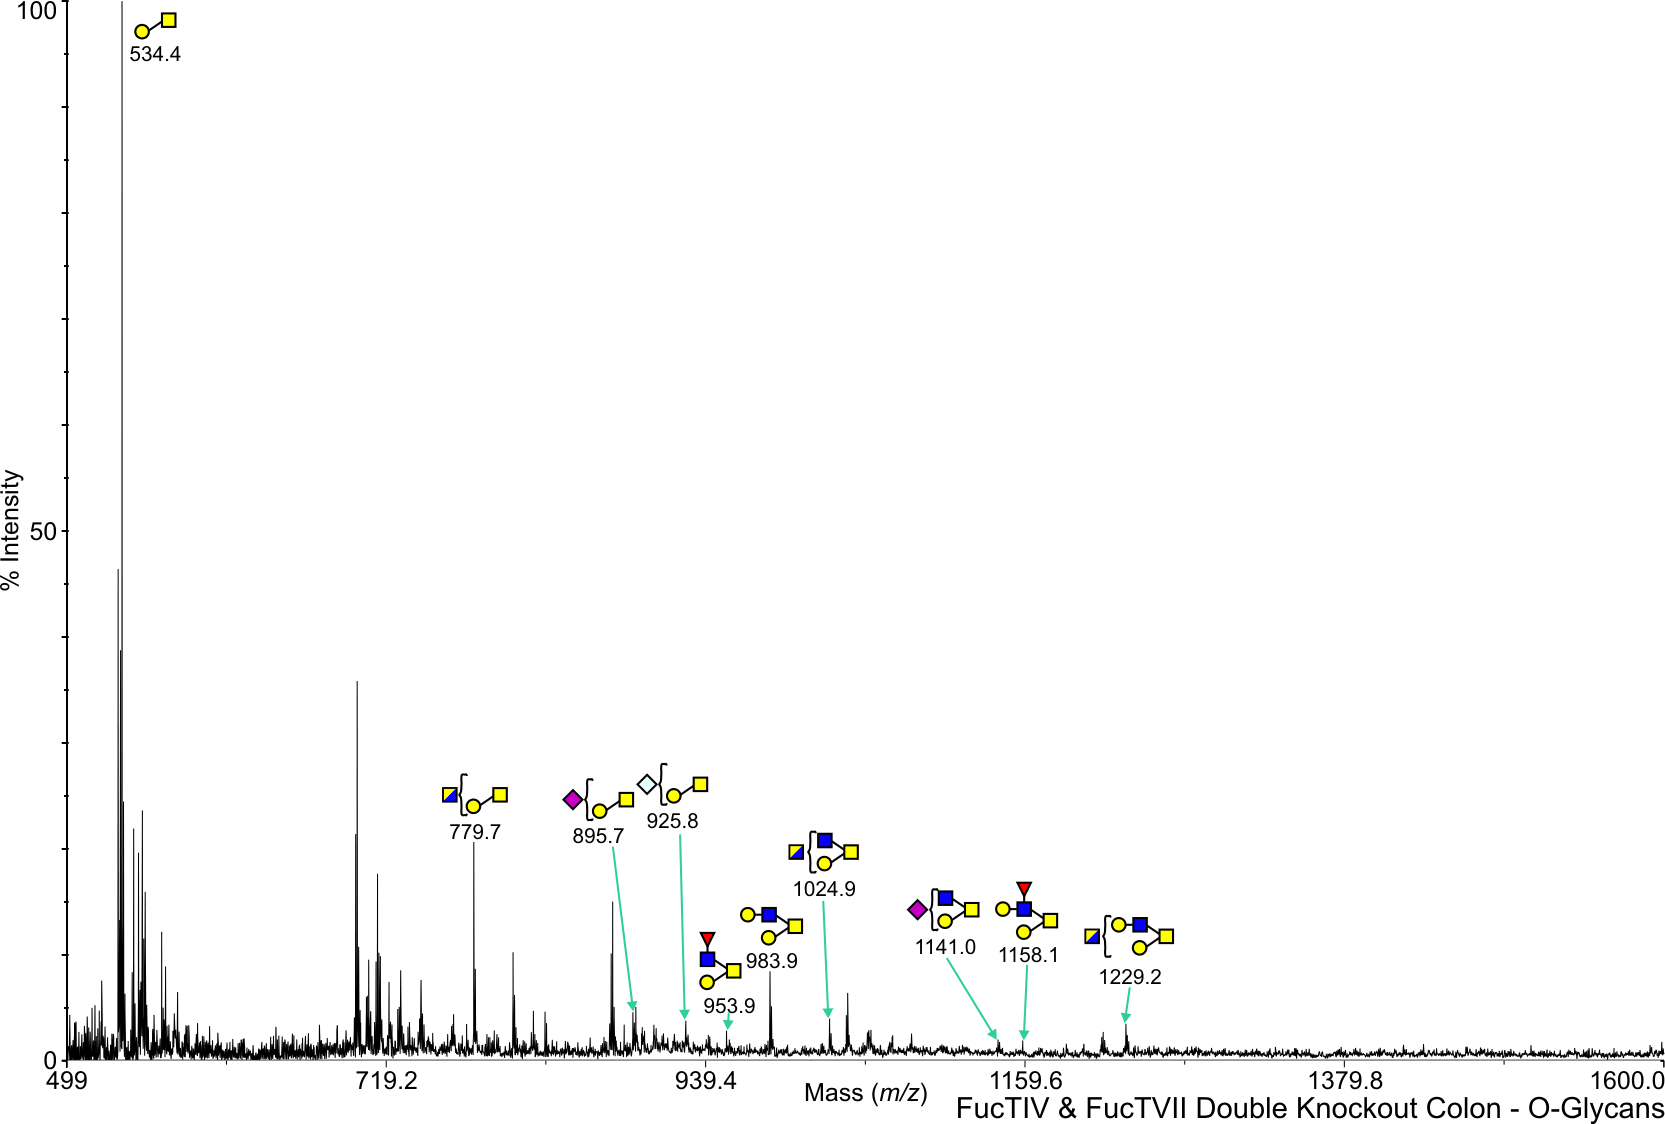
FC Mouse Fuct IV + VII Colon O-Linked C57BL/6 View experimental details      
Annotated file in JPG format Annotated file in PDF format
View Mass Spectrum data as text View Mass Peak file   Interactive Mass Spectrum Viewer
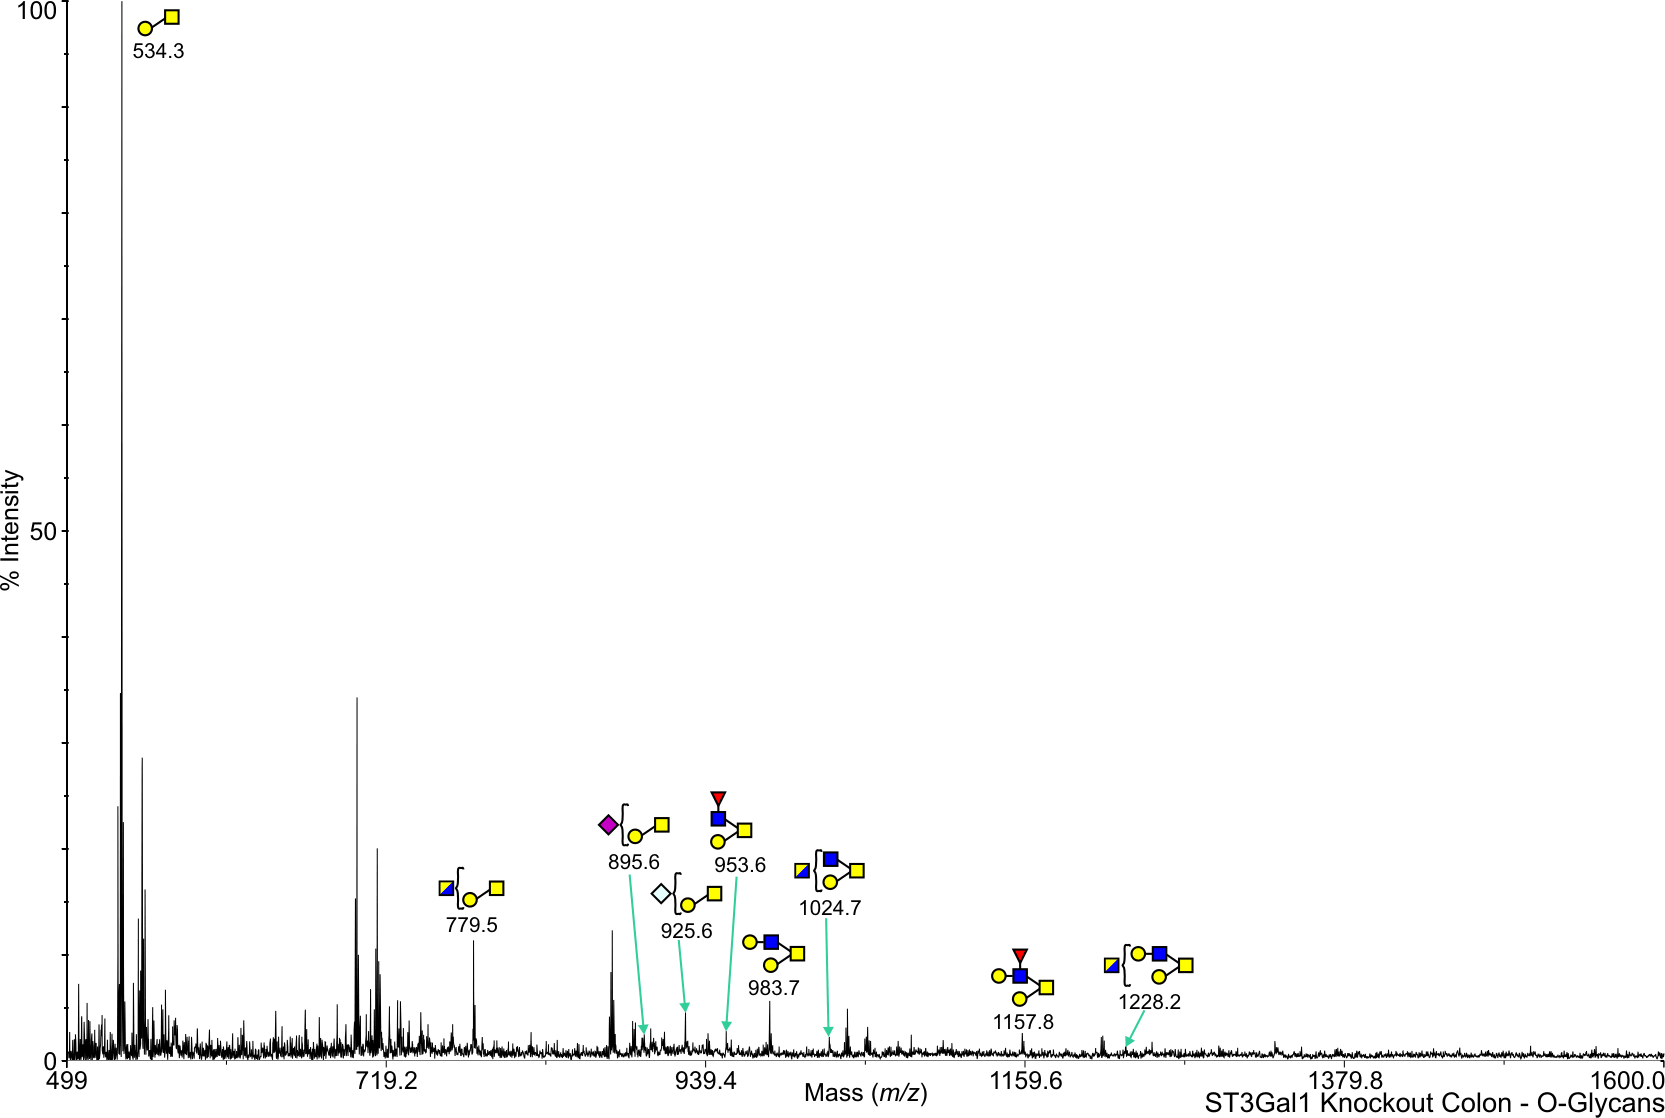
ST Mouse ST3 Gal 1 Colon O-Linked C57BL/6 View experimental details      
Annotated file in JPG format Annotated file in PDF format
View Mass Spectrum data as text View Mass Peak file   Interactive Mass Spectrum Viewer
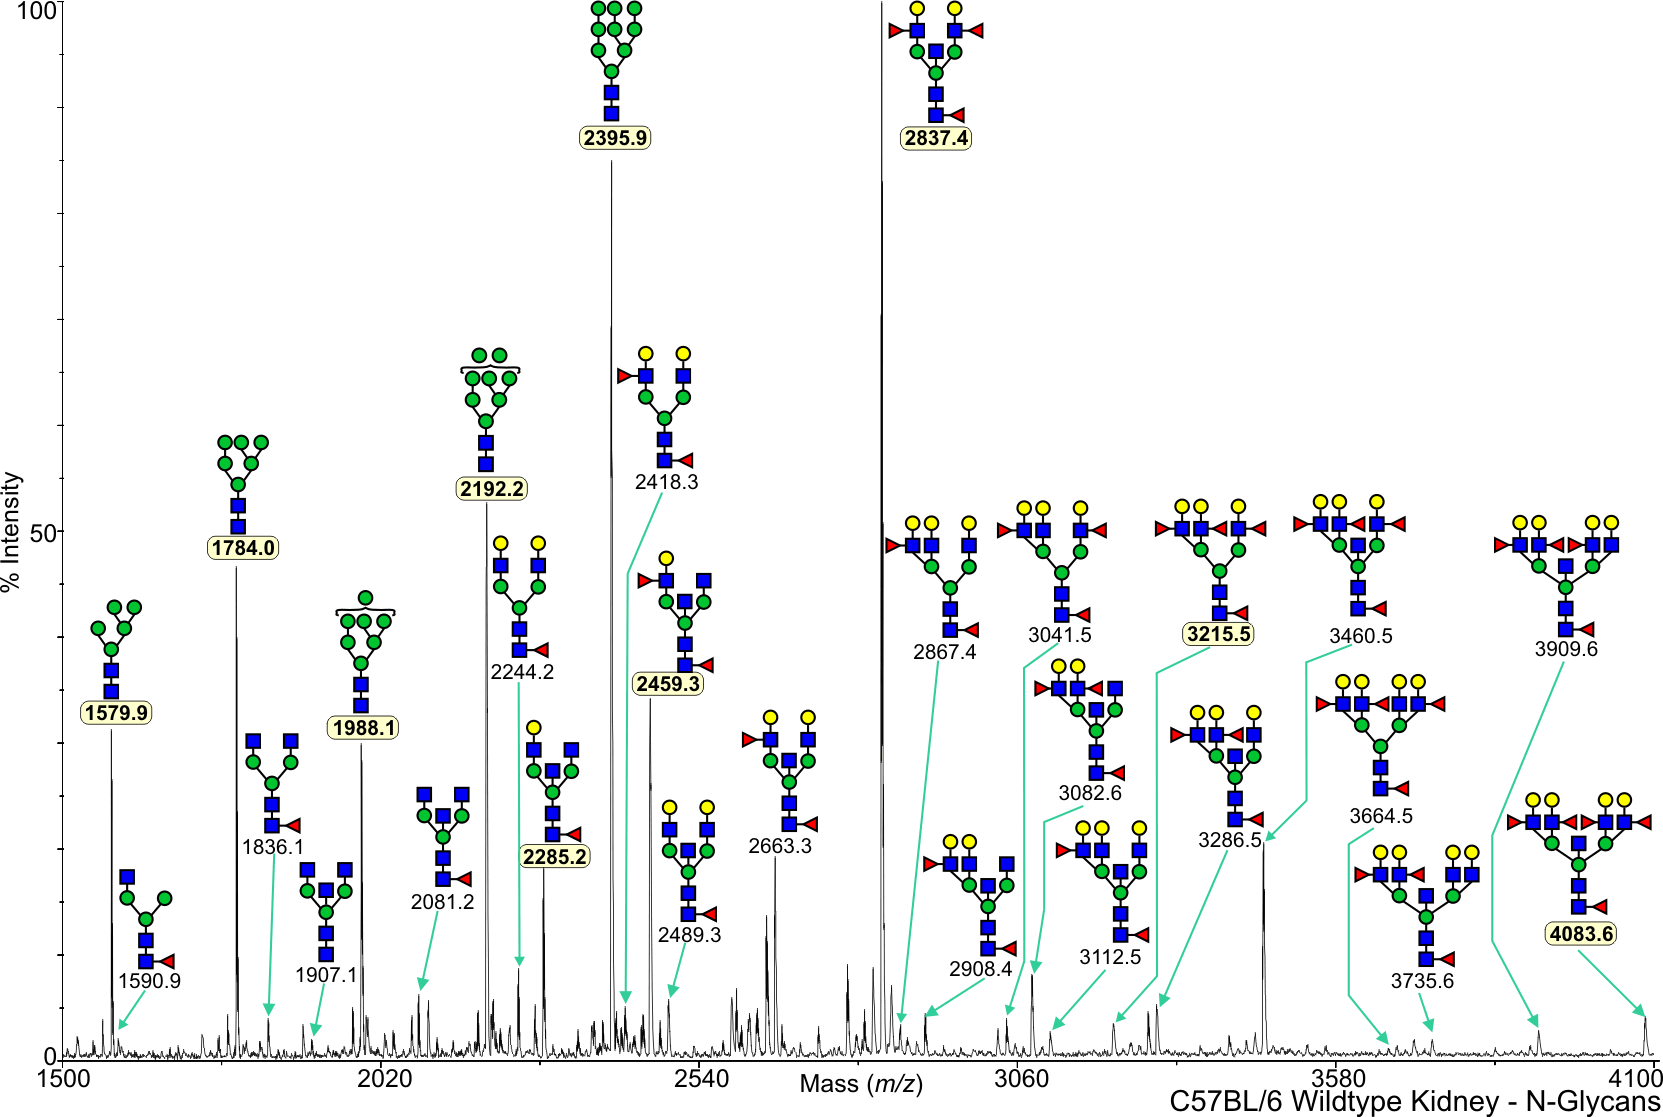
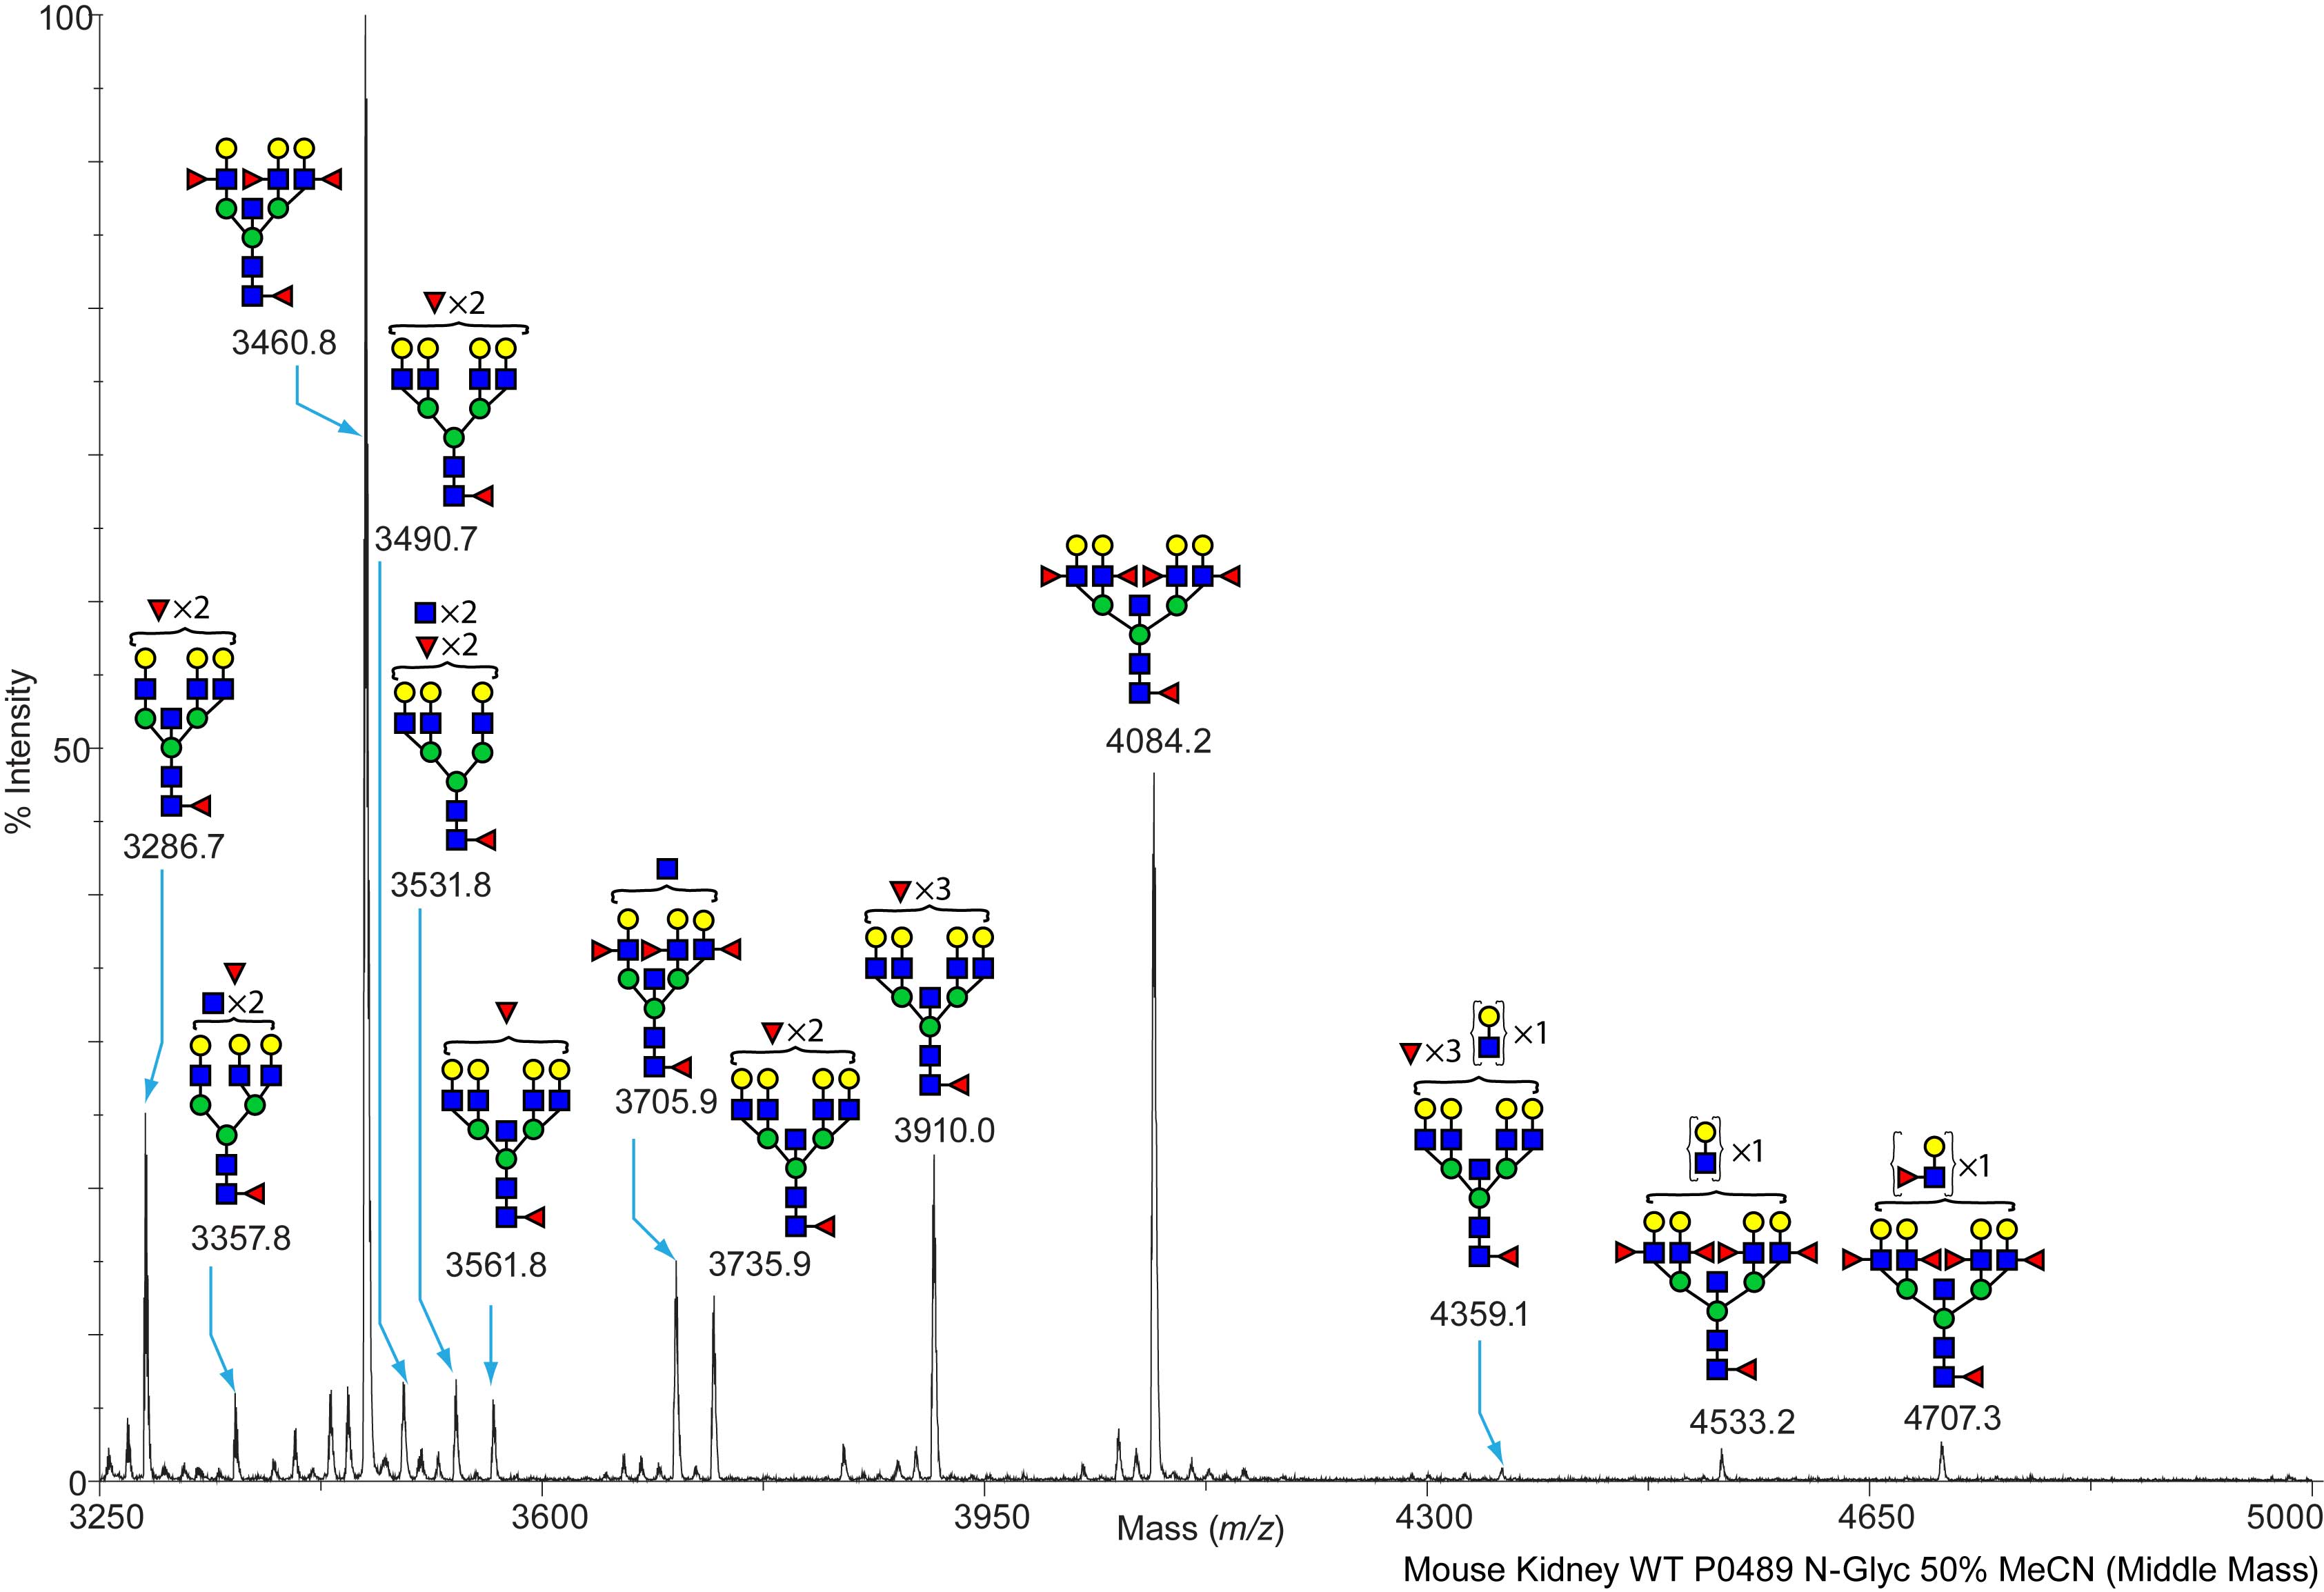
Mouse Wild Type Kidney N-Linked C57BL/6 View experimental details      
Annotated file in JPG format Annotated file in PDF format
View Mass Spectrum data as text View Mass Peak file   Interactive Mass Spectrum Viewer
FA Mouse Fuct IV Kidney N-Linked C57BL/6 View experimental details      
Annotated file in JPG format Annotated file in PDF format
View Mass Spectrum data as text View Mass Peak file   Interactive Mass Spectrum Viewer
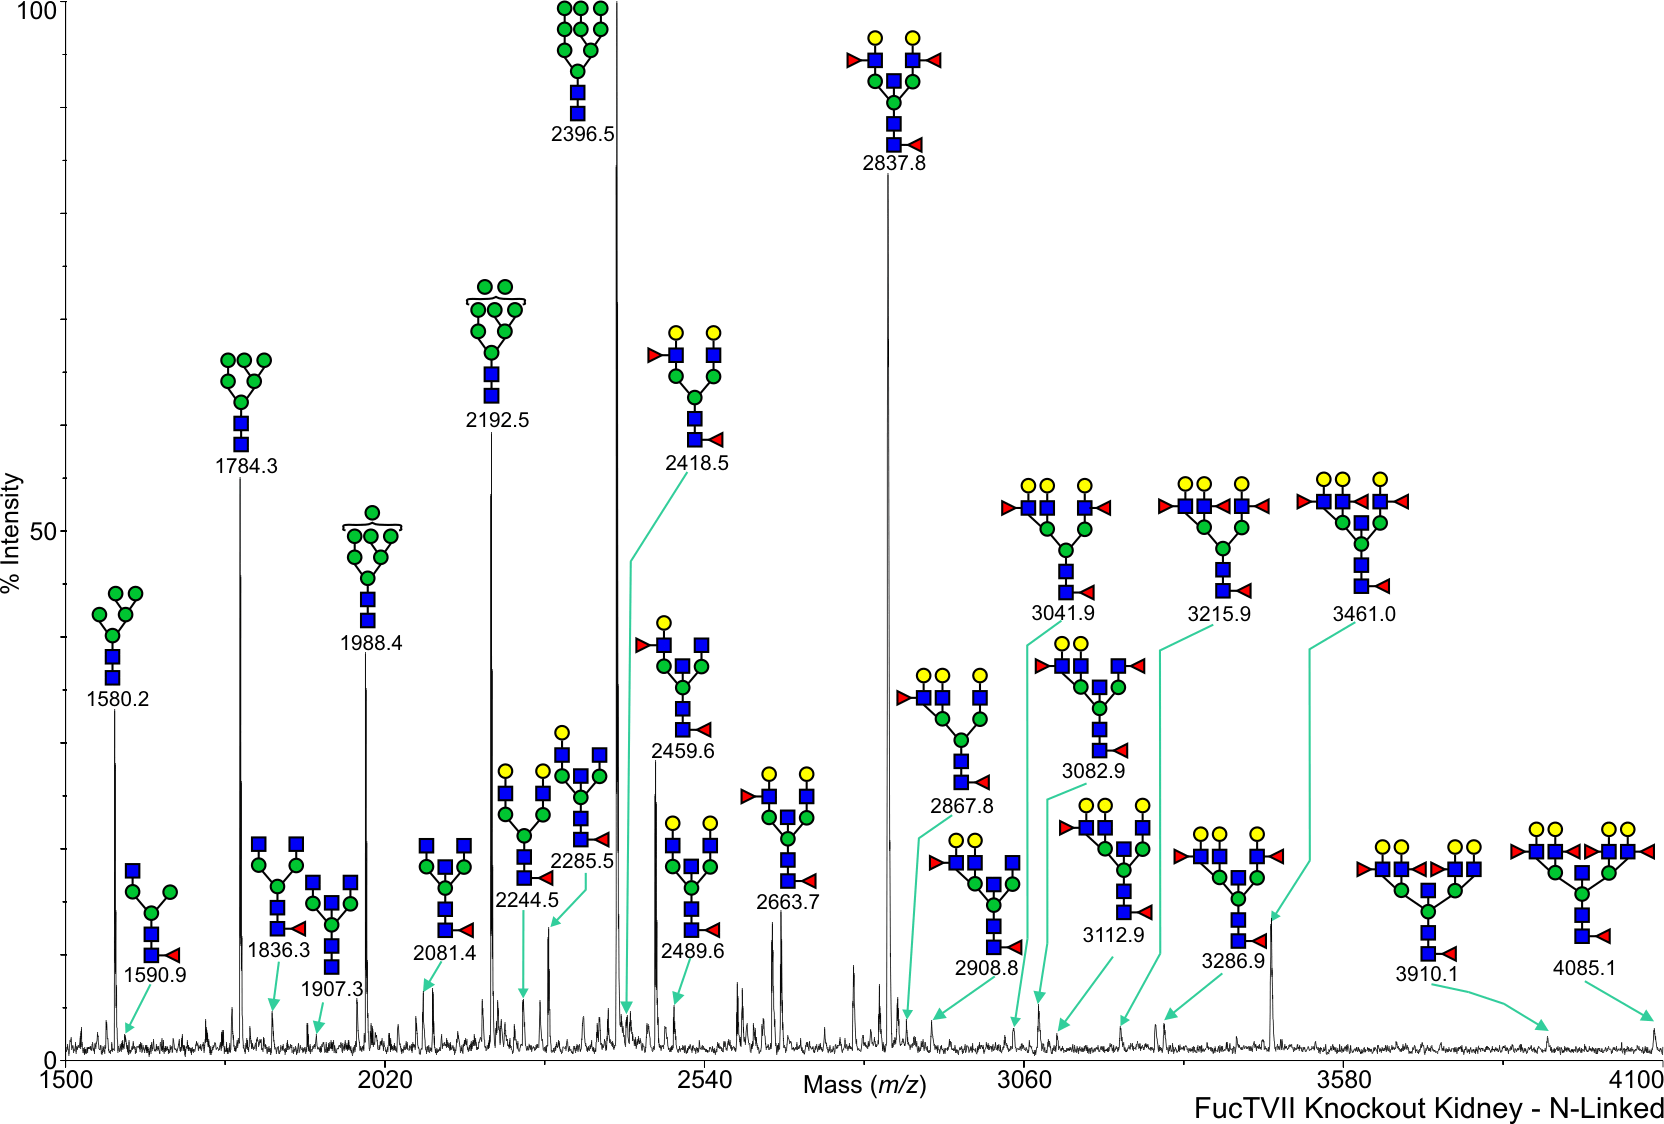
FB Mouse Fuct VII Kidney N-Linked C57BL/6 View experimental details      
Annotated file in JPG format Annotated file in PDF format
View Mass Spectrum data as text View Mass Peak file   Interactive Mass Spectrum Viewer
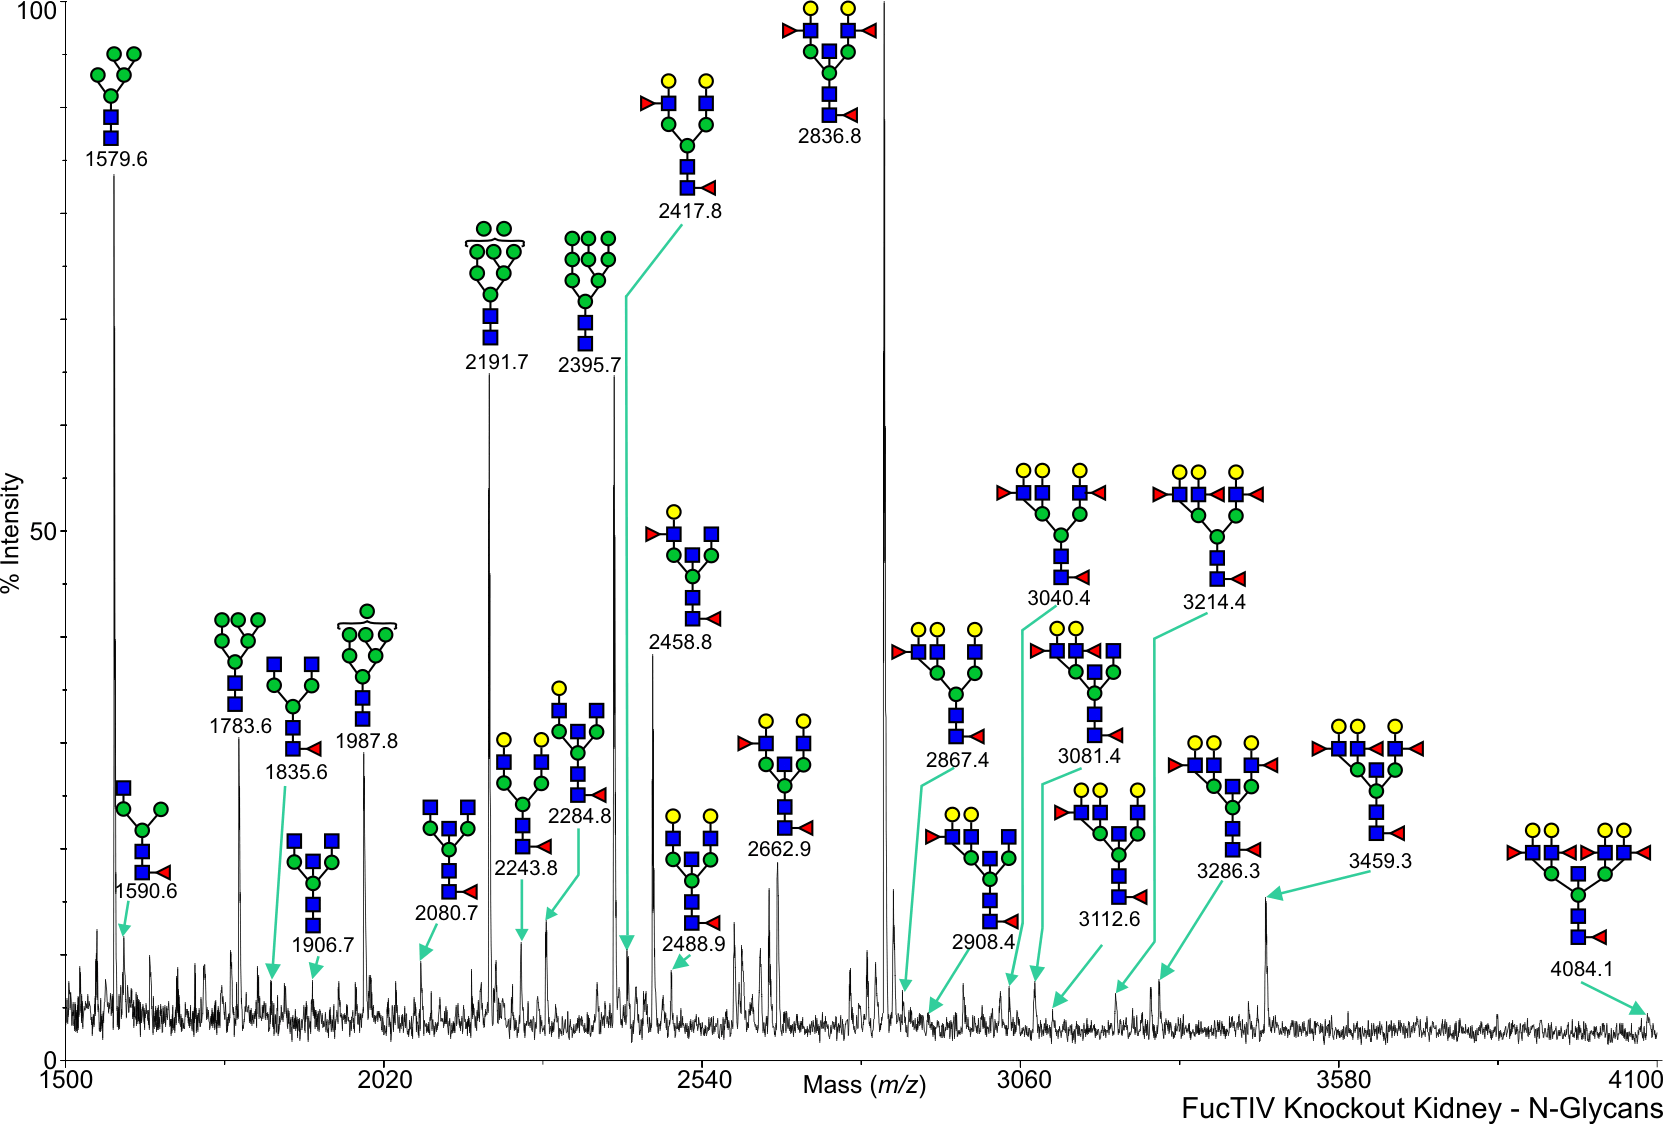
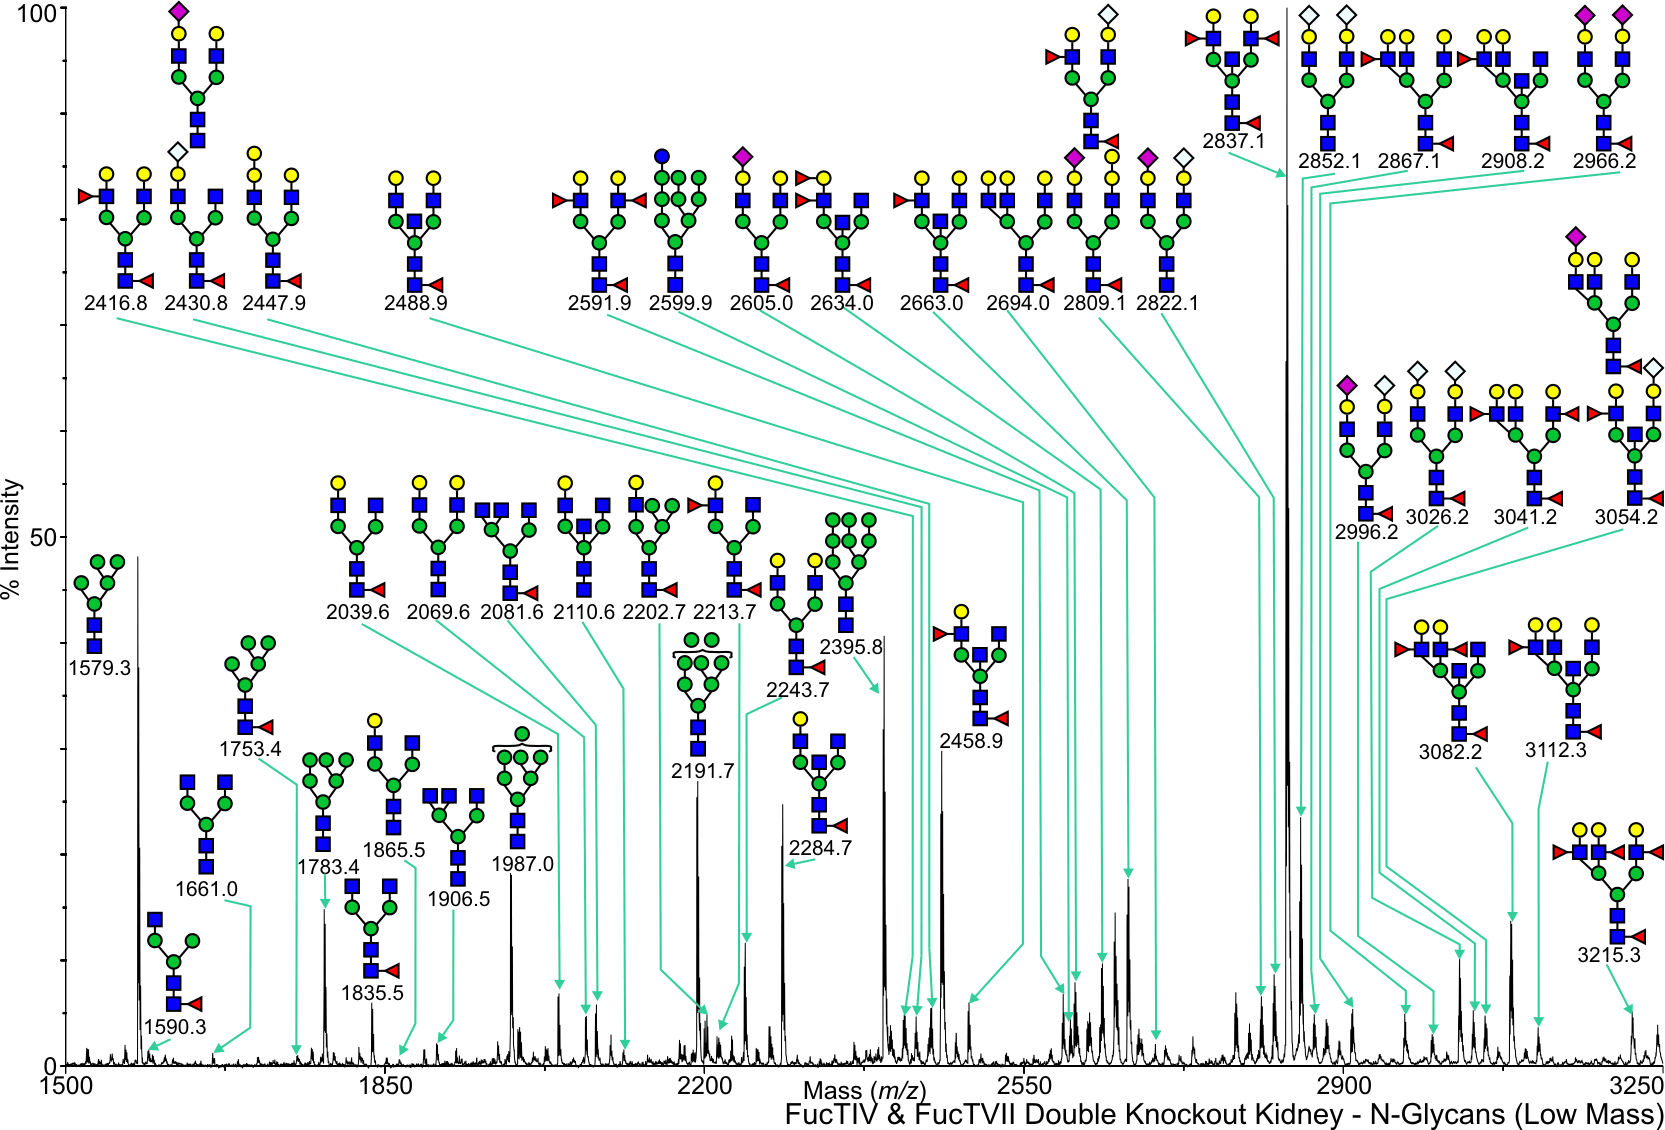
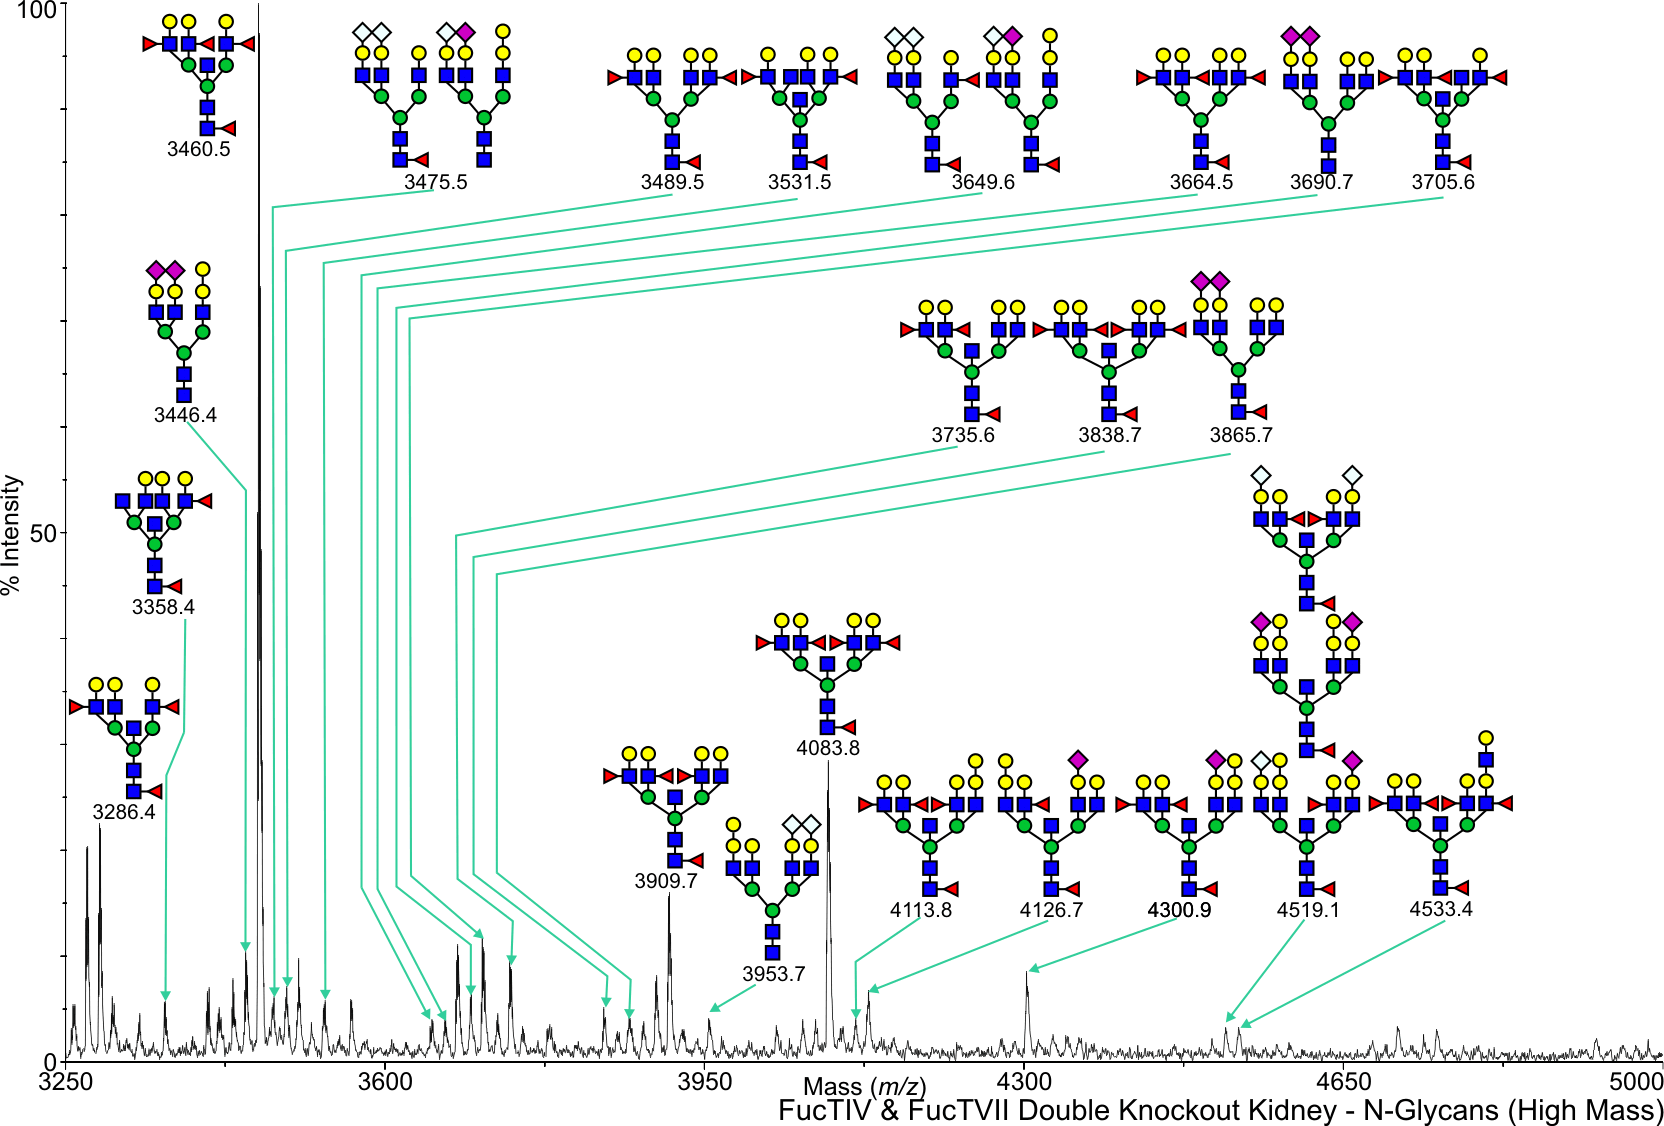
FC Mouse Fuct IV + VII Kidney N-Linked C57BL/6 View experimental details      
Annotated file for lower mass range in JPG formatAnnotated file for higher mass range in JPG format Annotated file for lower mass range in PDF formatAnnotated file for higher mass range in PDF format
View Mass Spectrum data as text View Mass Peak file   Interactive Mass Spectrum Viewer
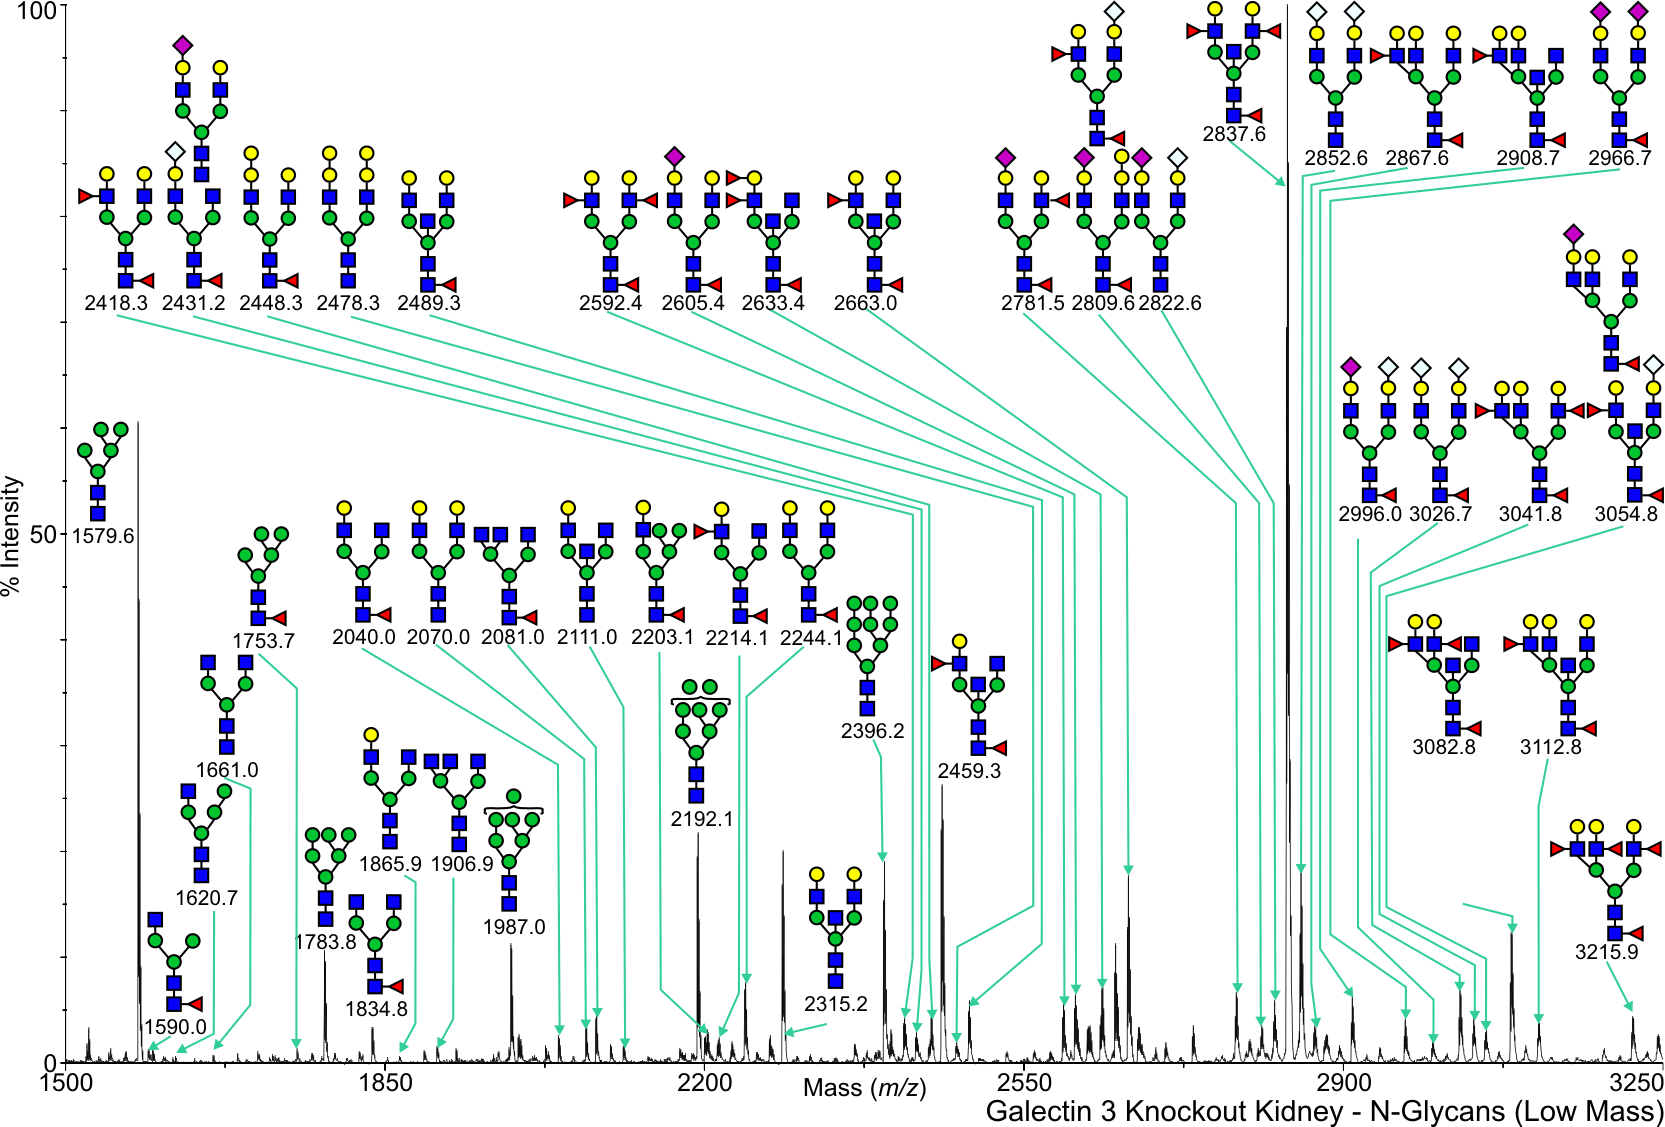
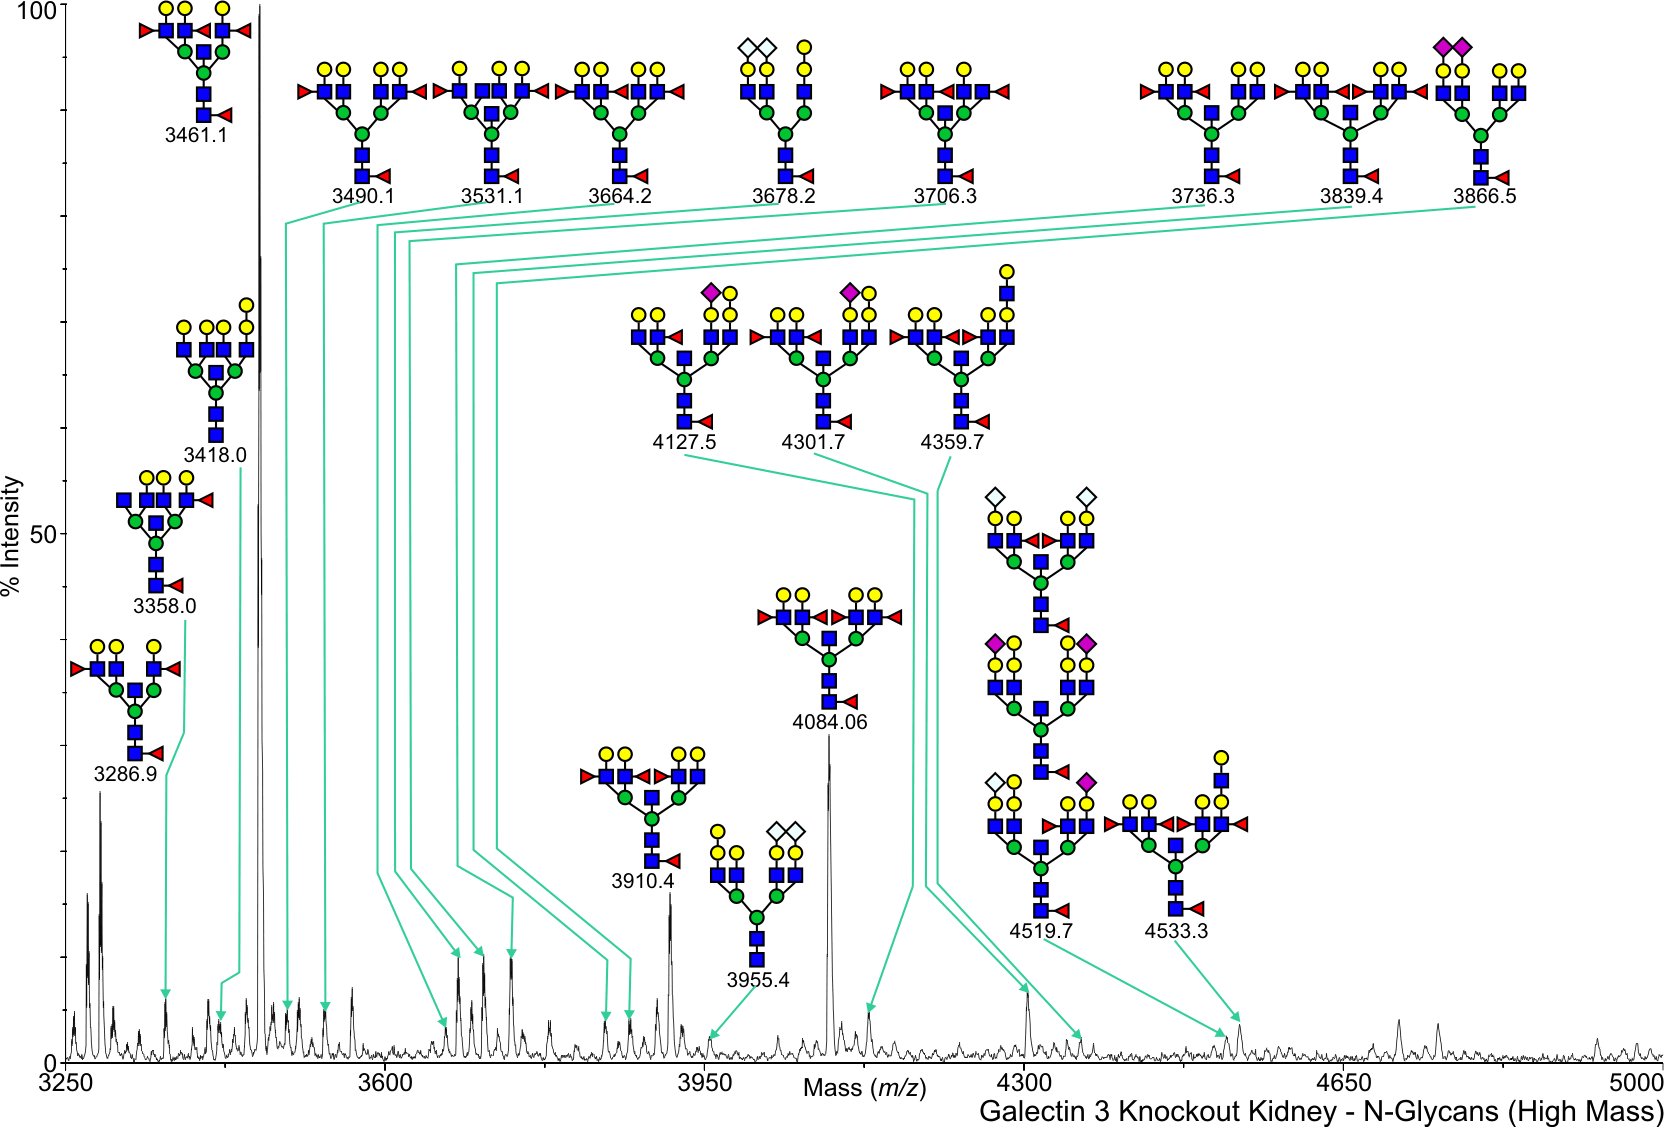
GT Mouse Gal 3 Kidney N-Linked C57BL/6 View experimental details      
Annotated file for lower mass range in JPG formatAnnotated file for higher mass range in JPG format Annotated file for lower mass range in PDF formatAnnotated file for higher mass range in PDF format
View Mass Spectrum data as text View Mass Peak file   Interactive Mass Spectrum Viewer
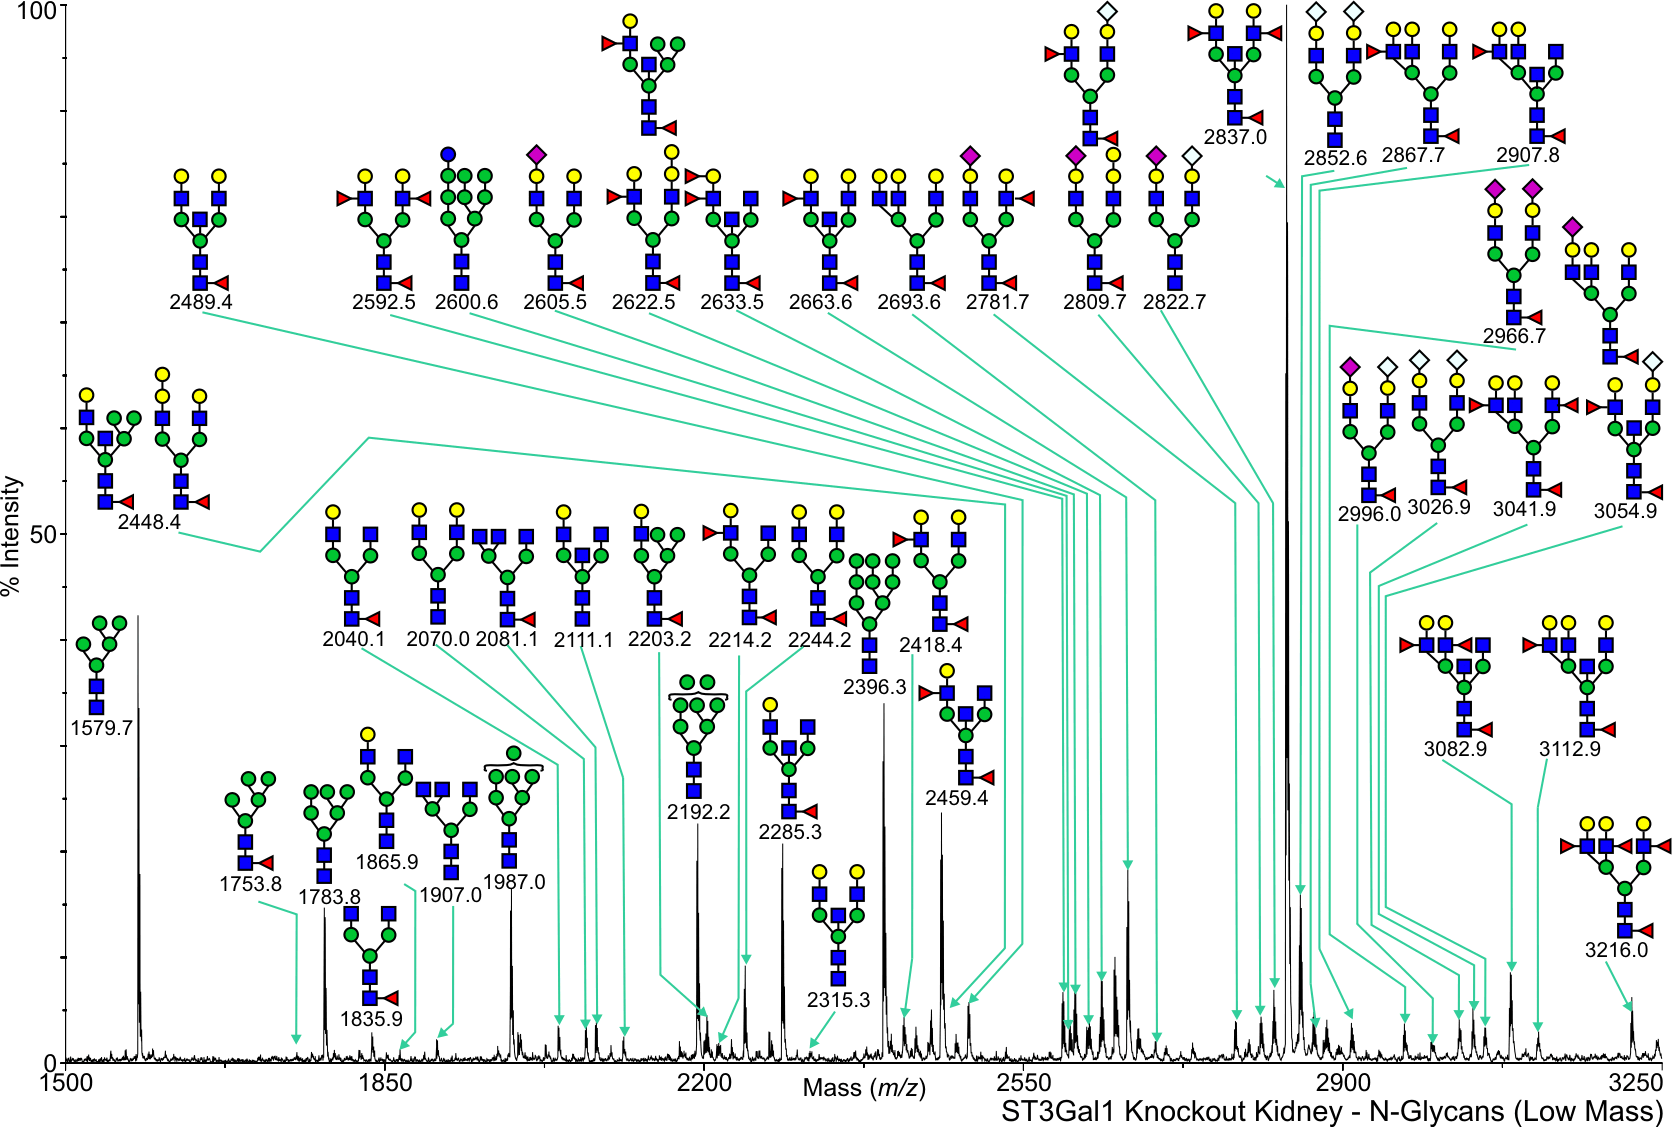
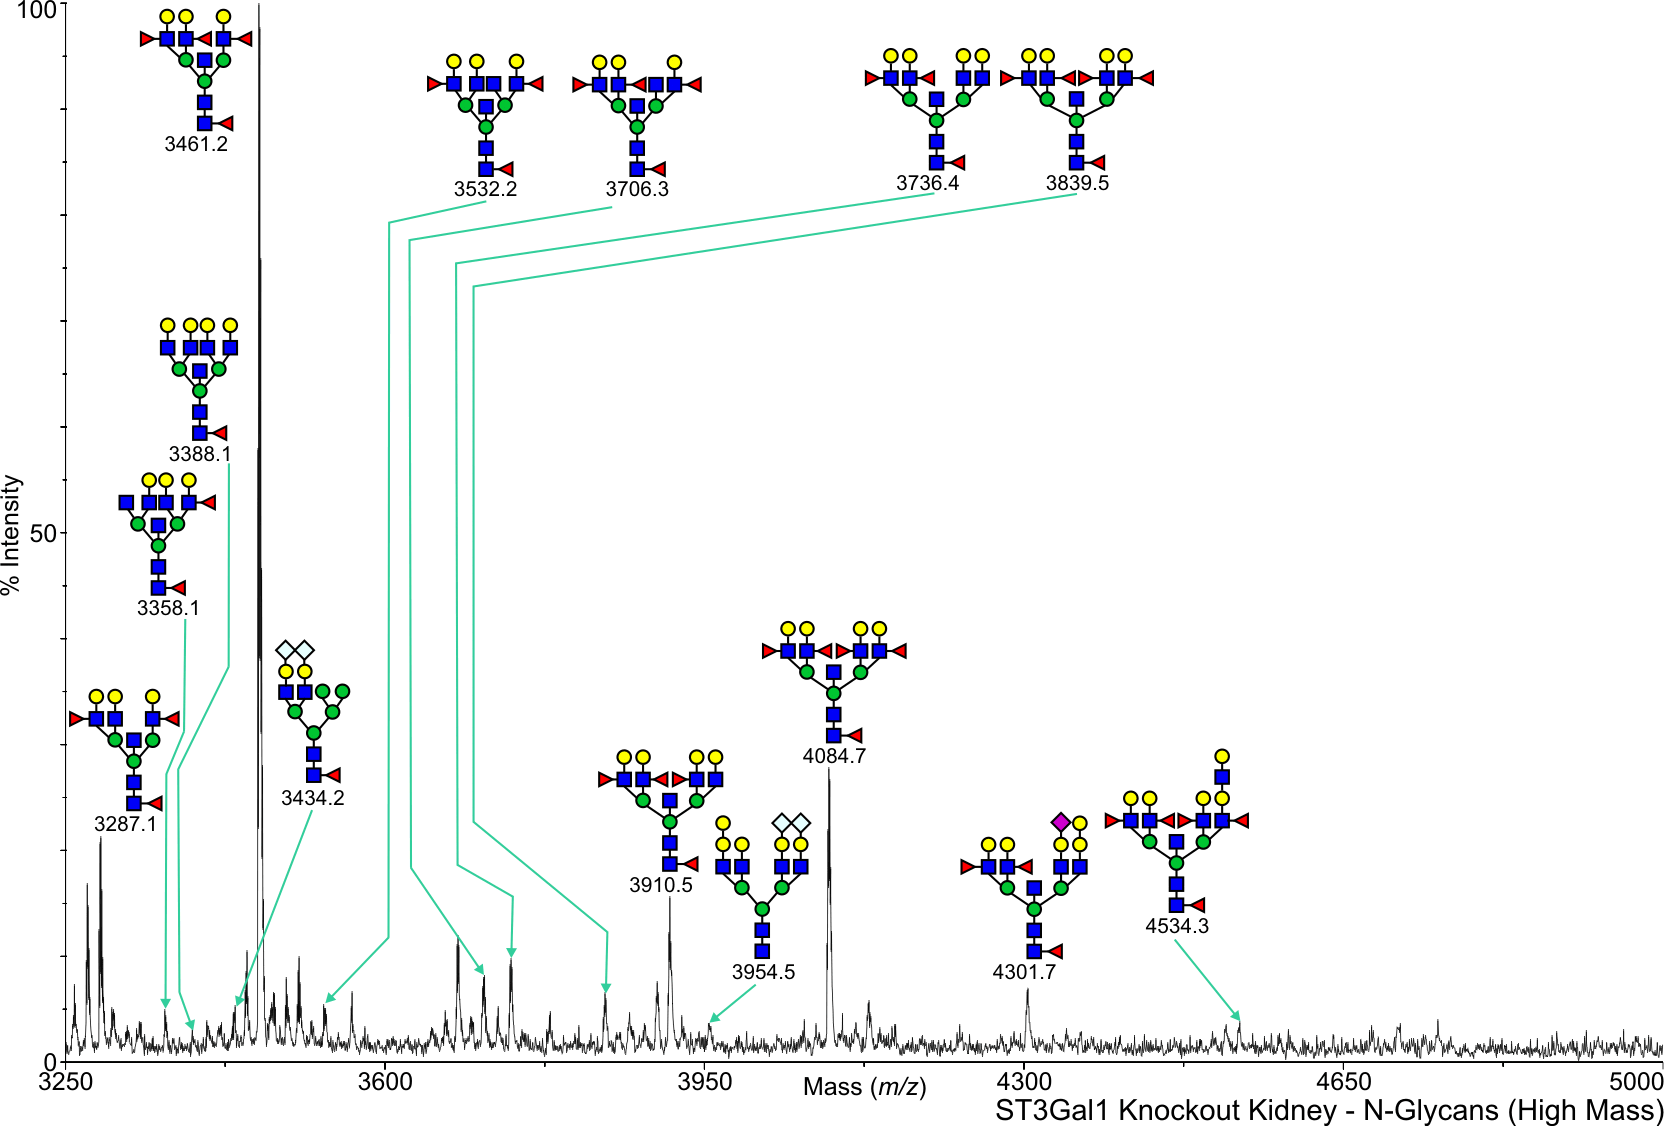
ST Mouse ST3 Gal 1 Kidney N-Linked C57BL/6 View experimental details      
Annotated file for lower mass range in JPG formatAnnotated file for higher mass range in JPG format Annotated file for lower mass range in PDF formatAnnotated file for higher mass range in PDF format
View Mass Spectrum data as text View Mass Peak file   Interactive Mass Spectrum Viewer
MG Mouse Core 2 GlcNAcT Kidney N-Linked C57BL/6 View experimental details      
Annotated file for lower mass range in JPG formatAnnotated file for higher mass range in JPG format Annotated file for lower mass range in PDF formatAnnotated file for higher mass range in PDF format
View Mass Spectrum data as text View Mass Peak file   Interactive Mass Spectrum Viewer
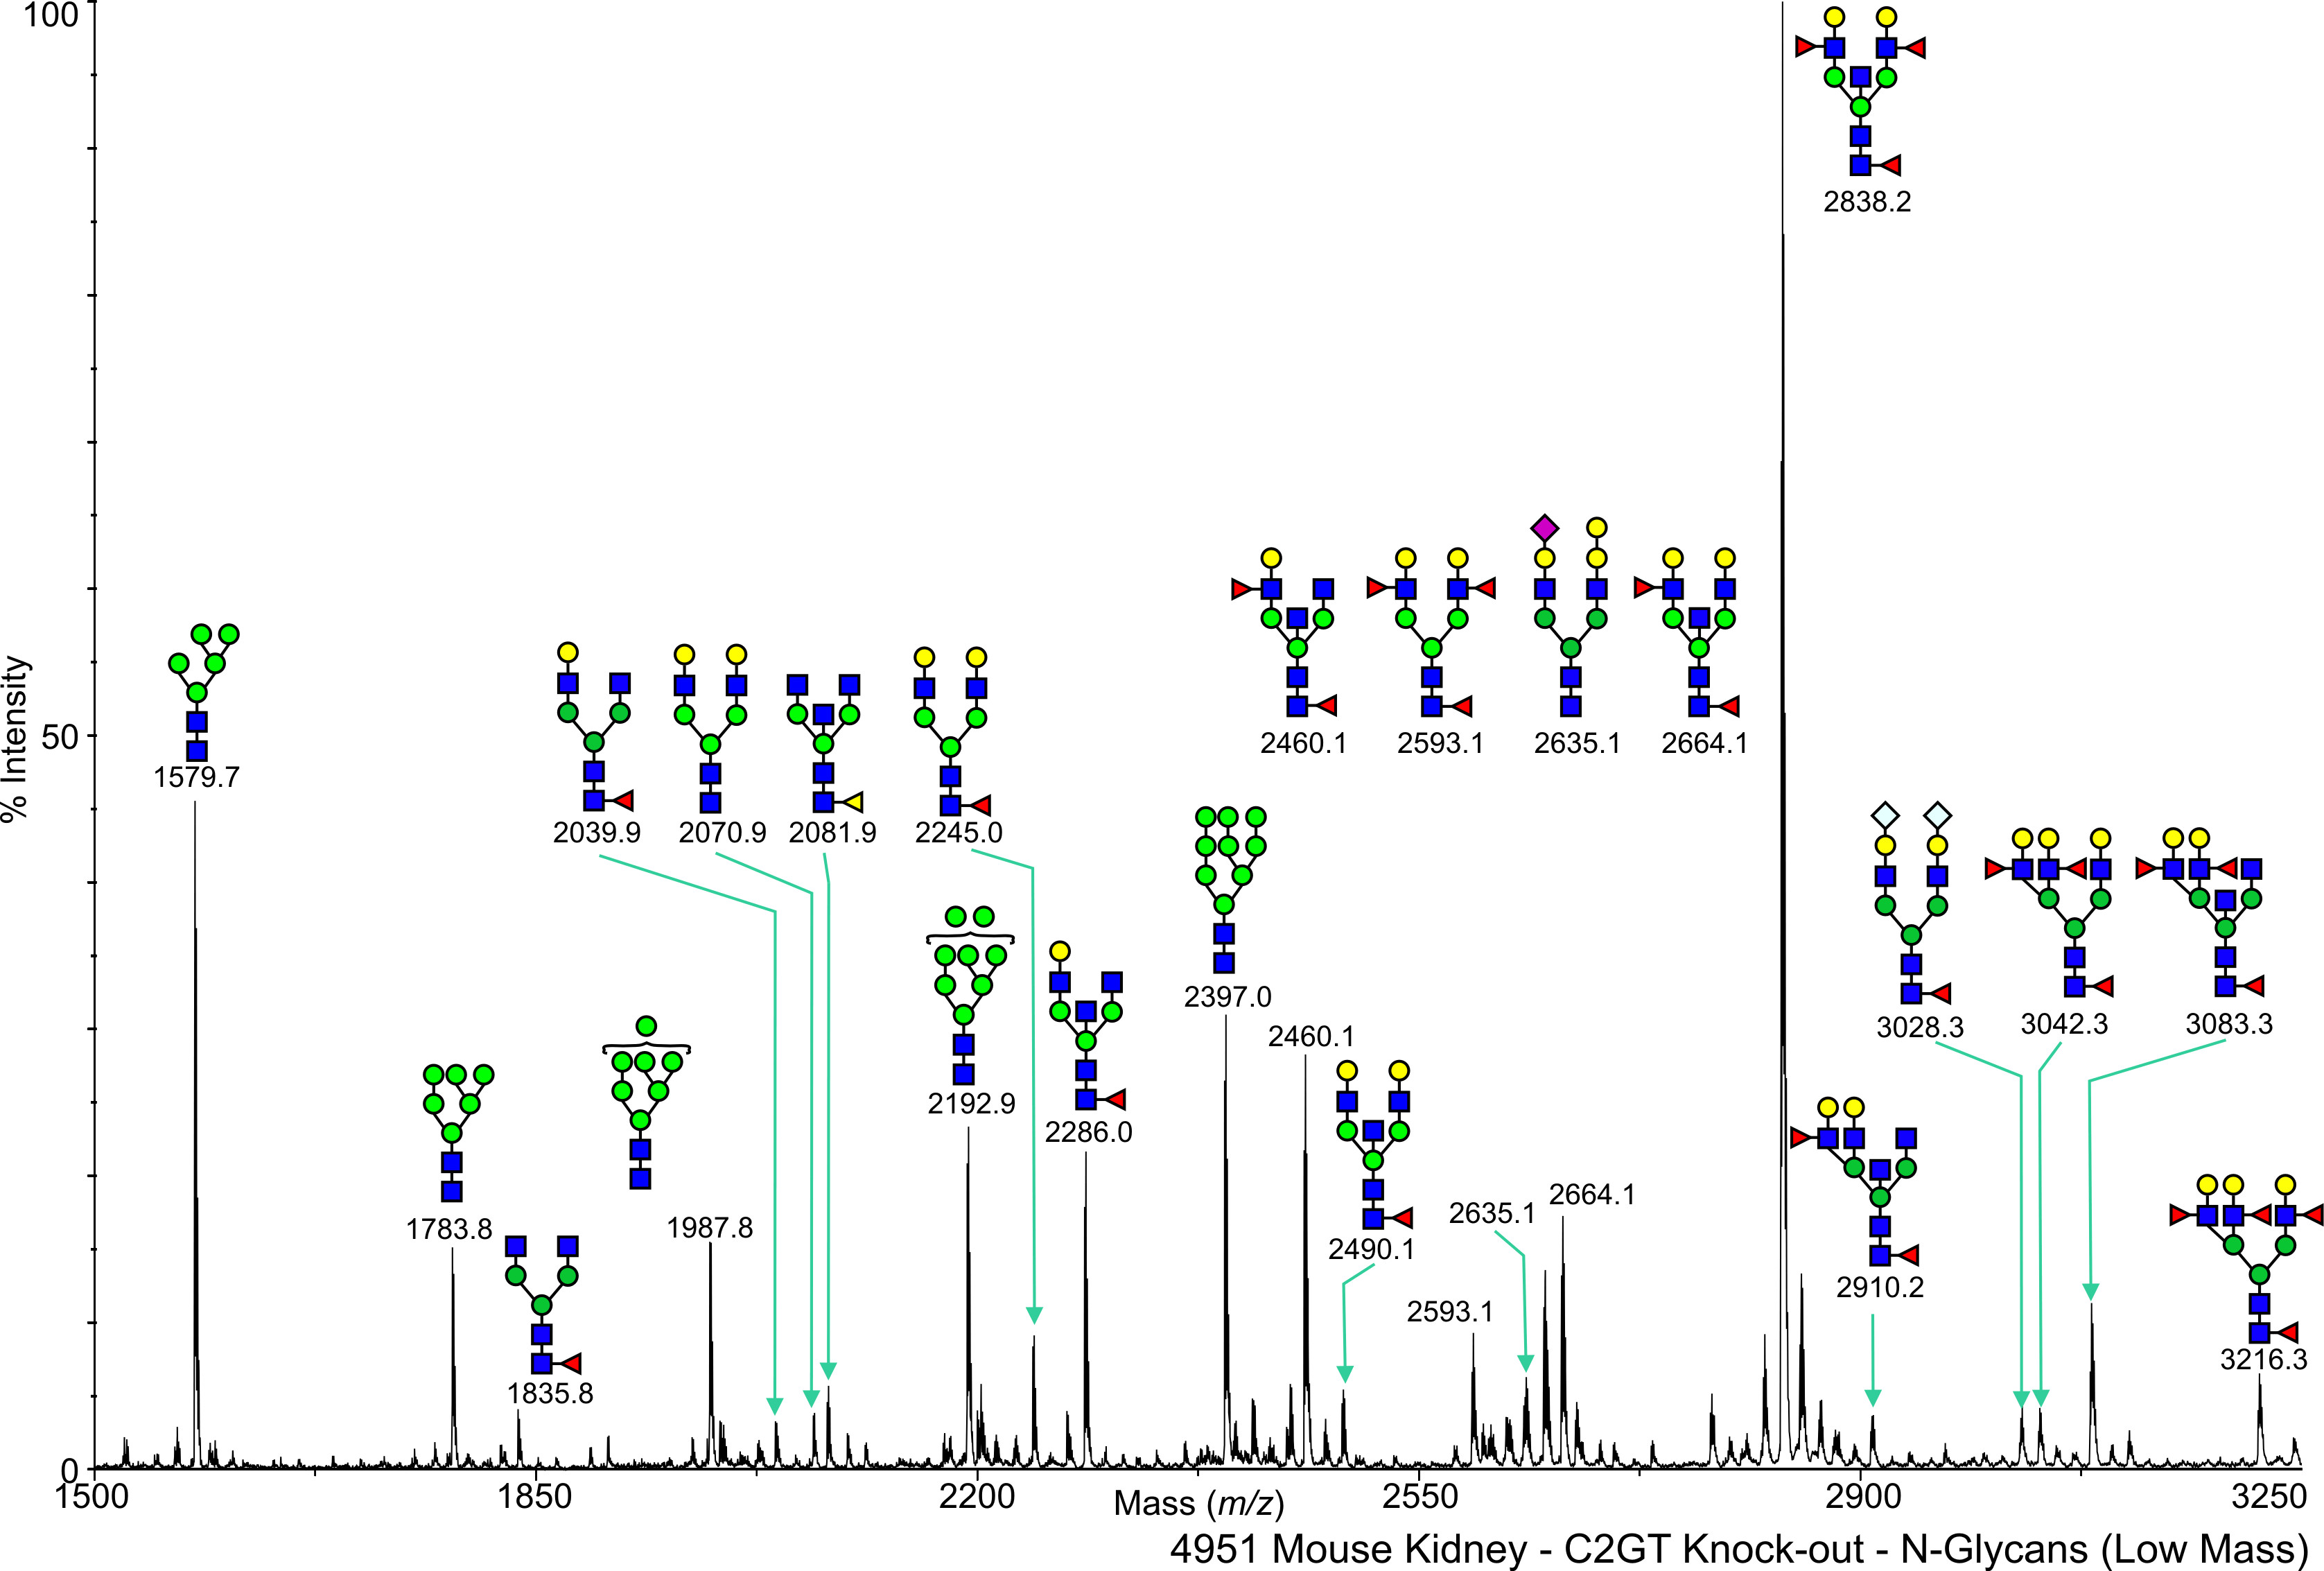
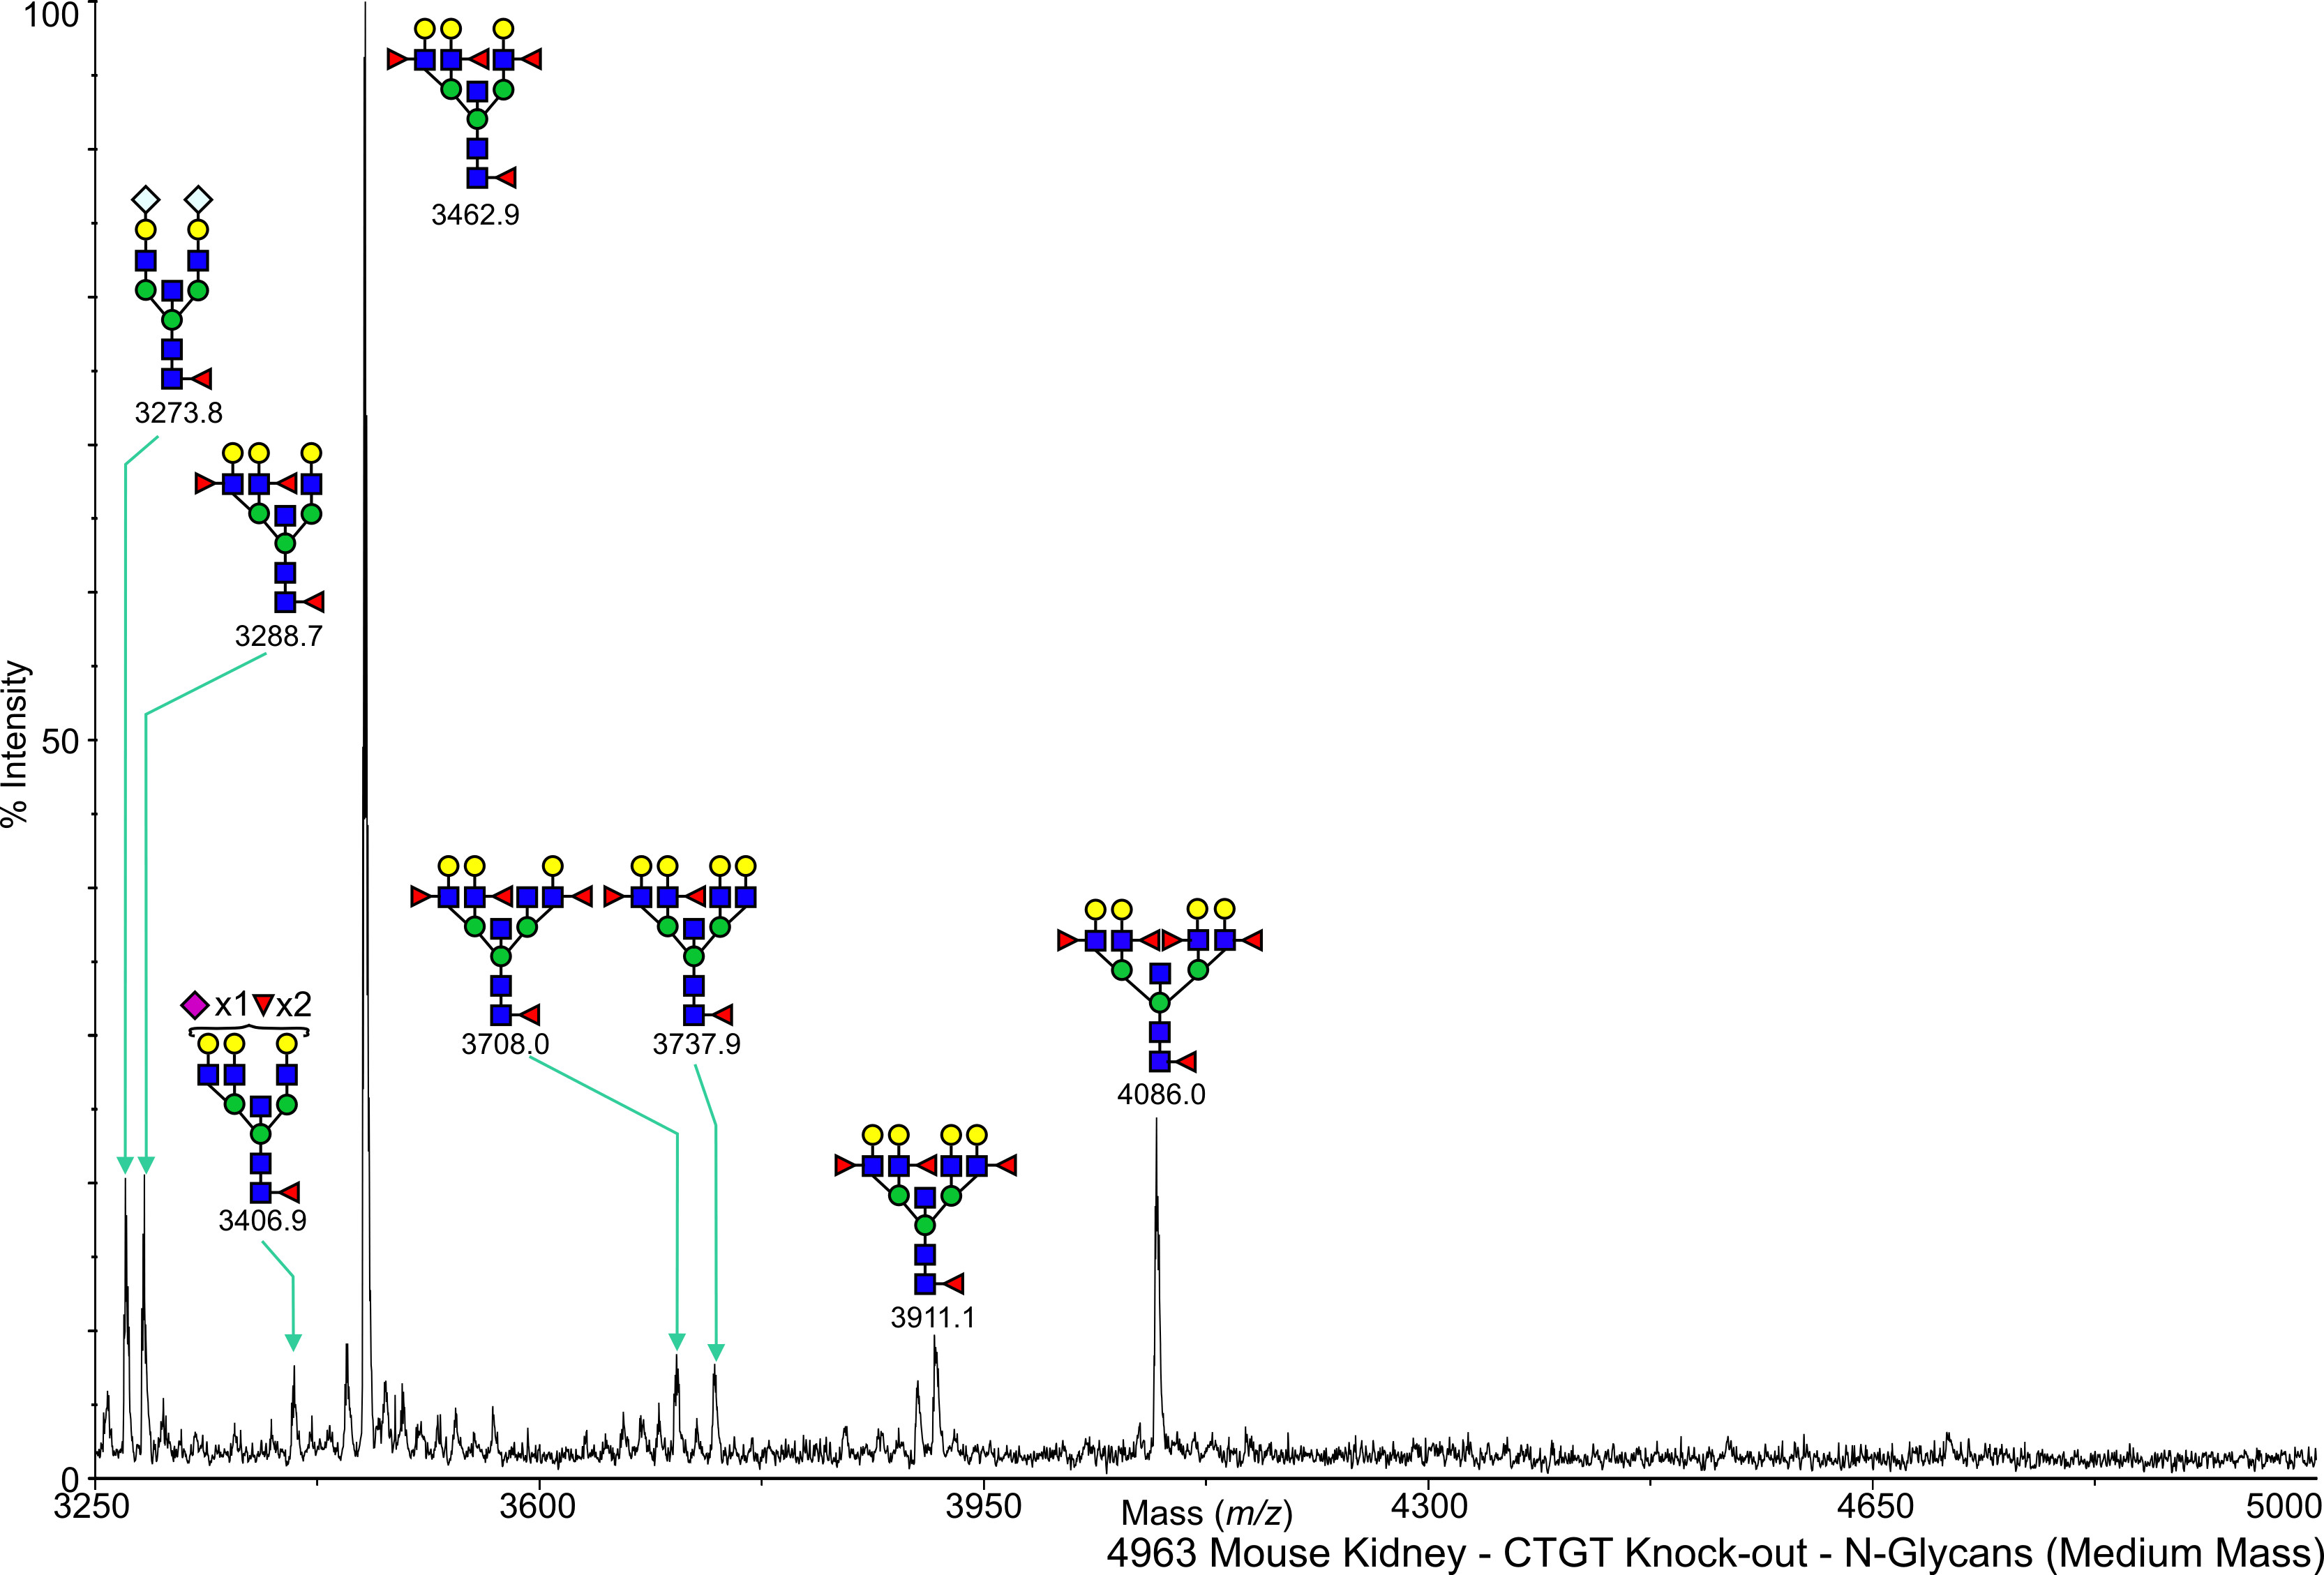
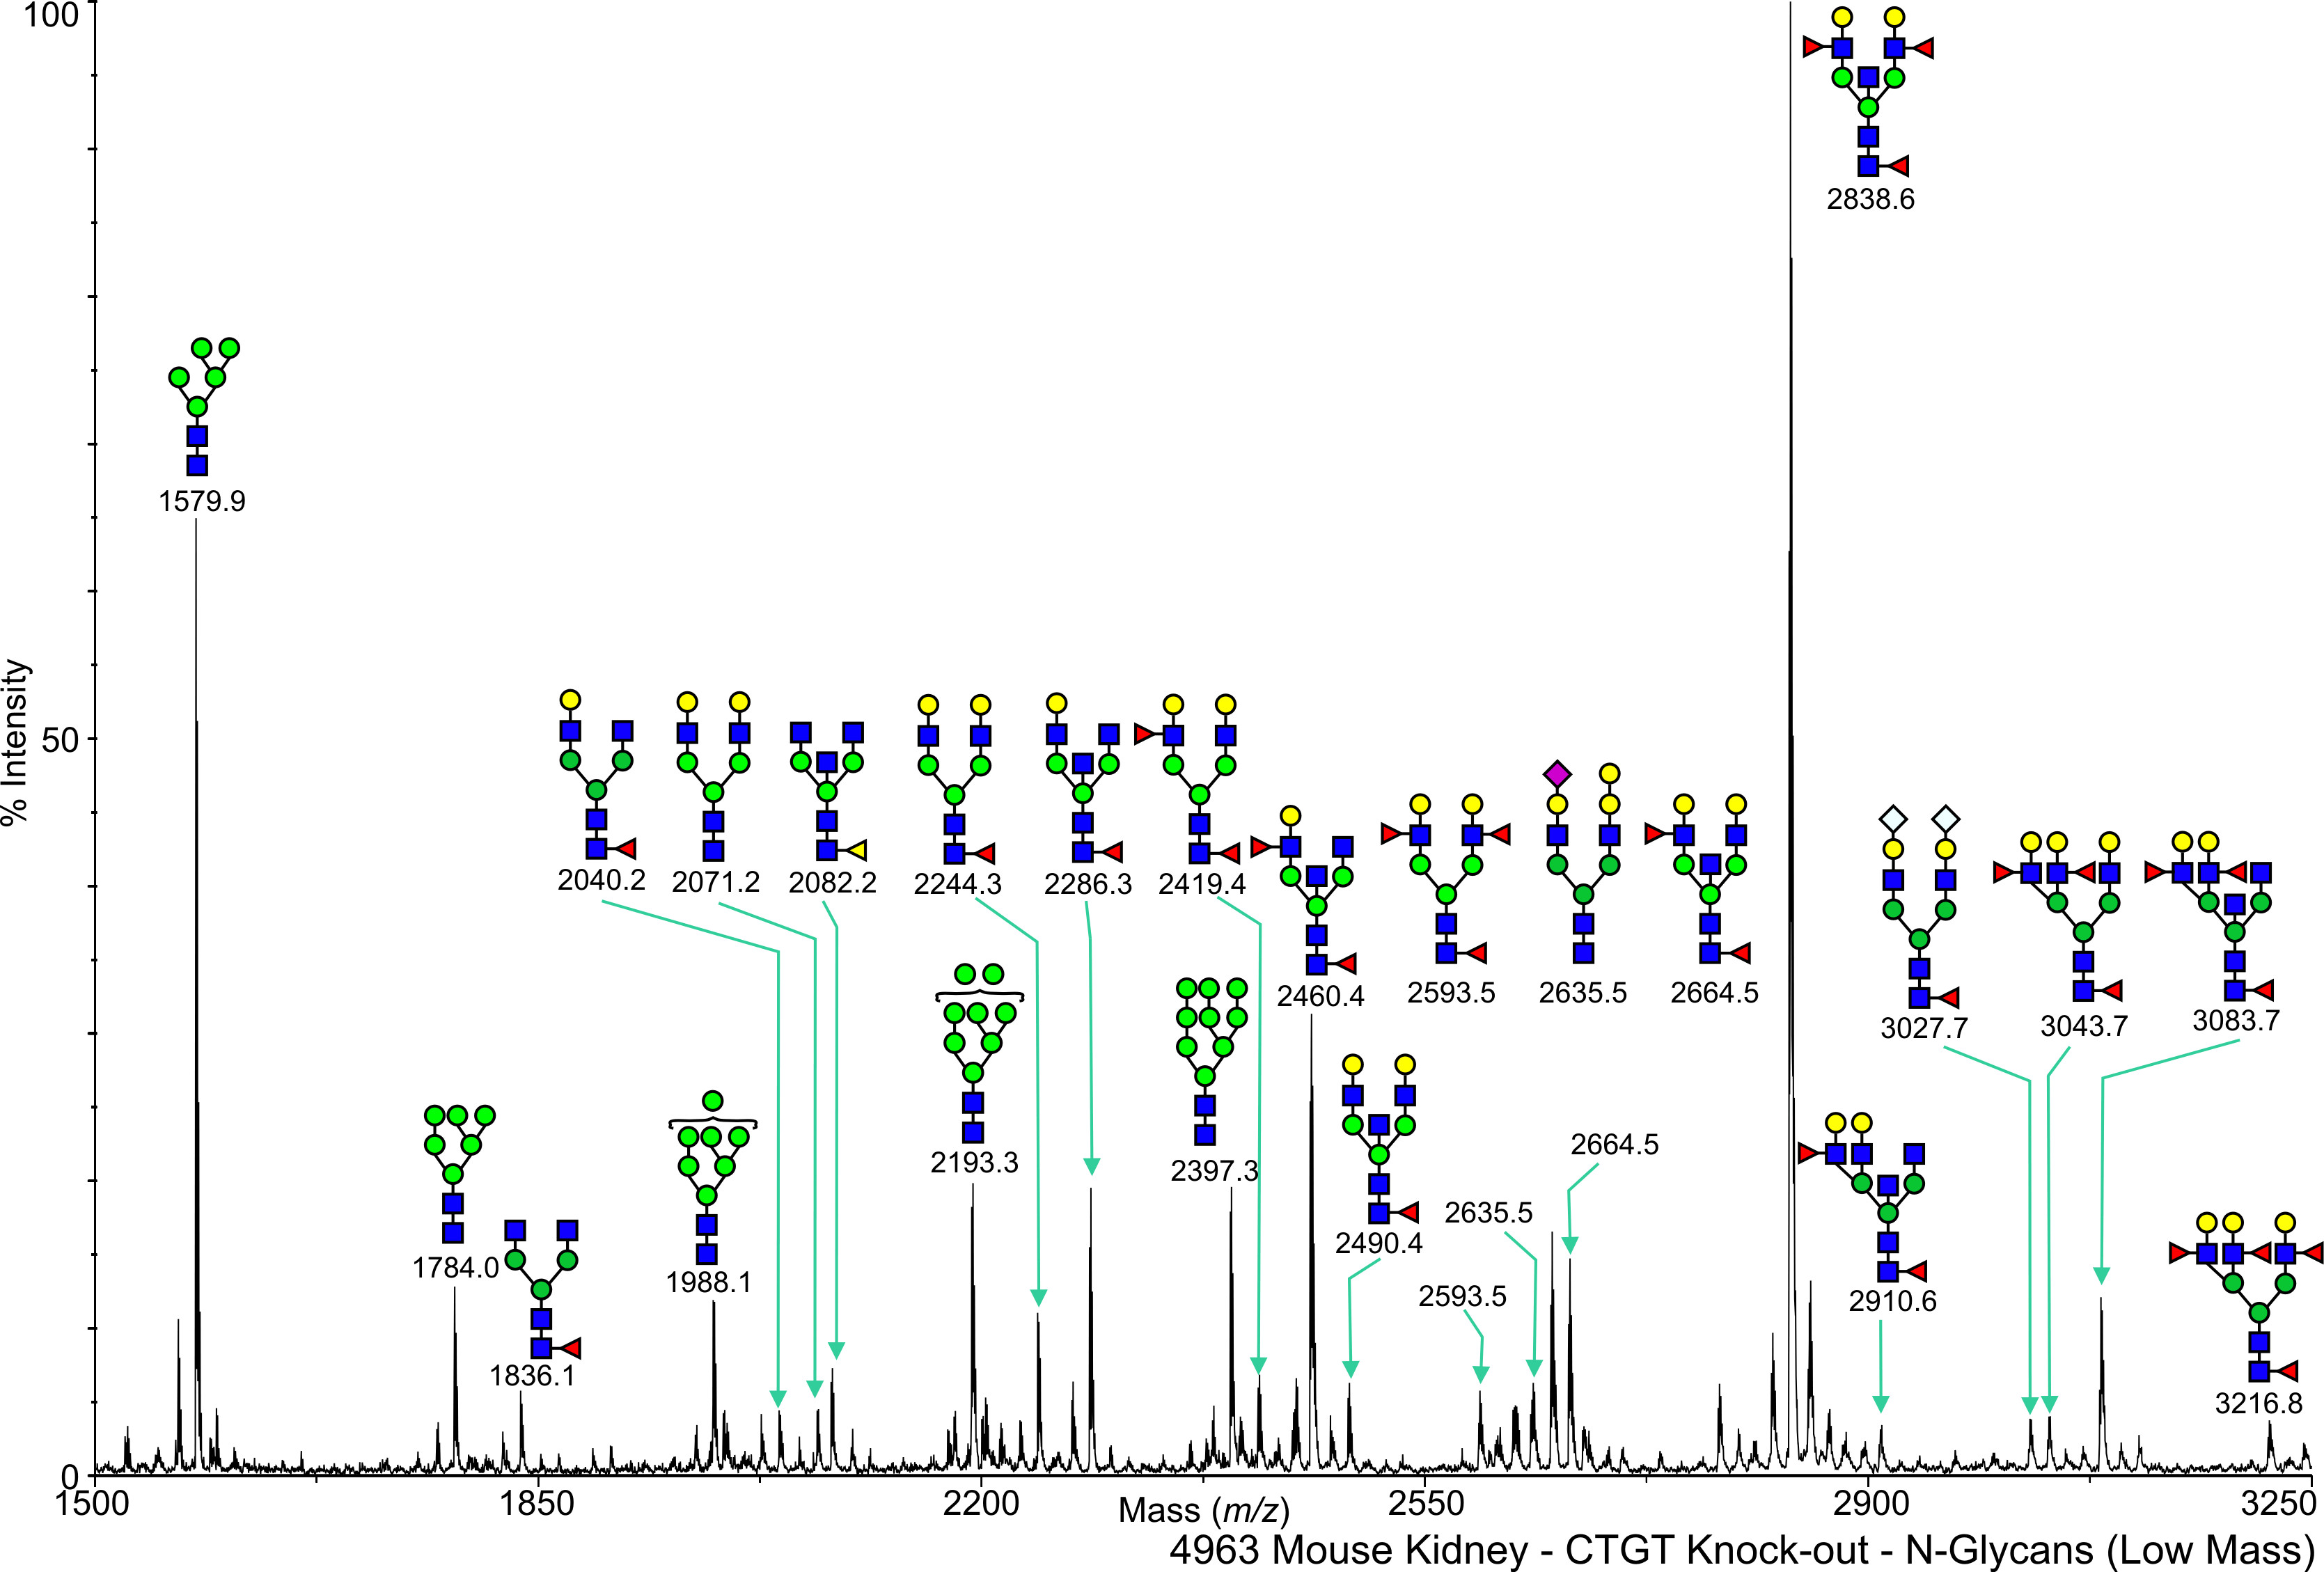
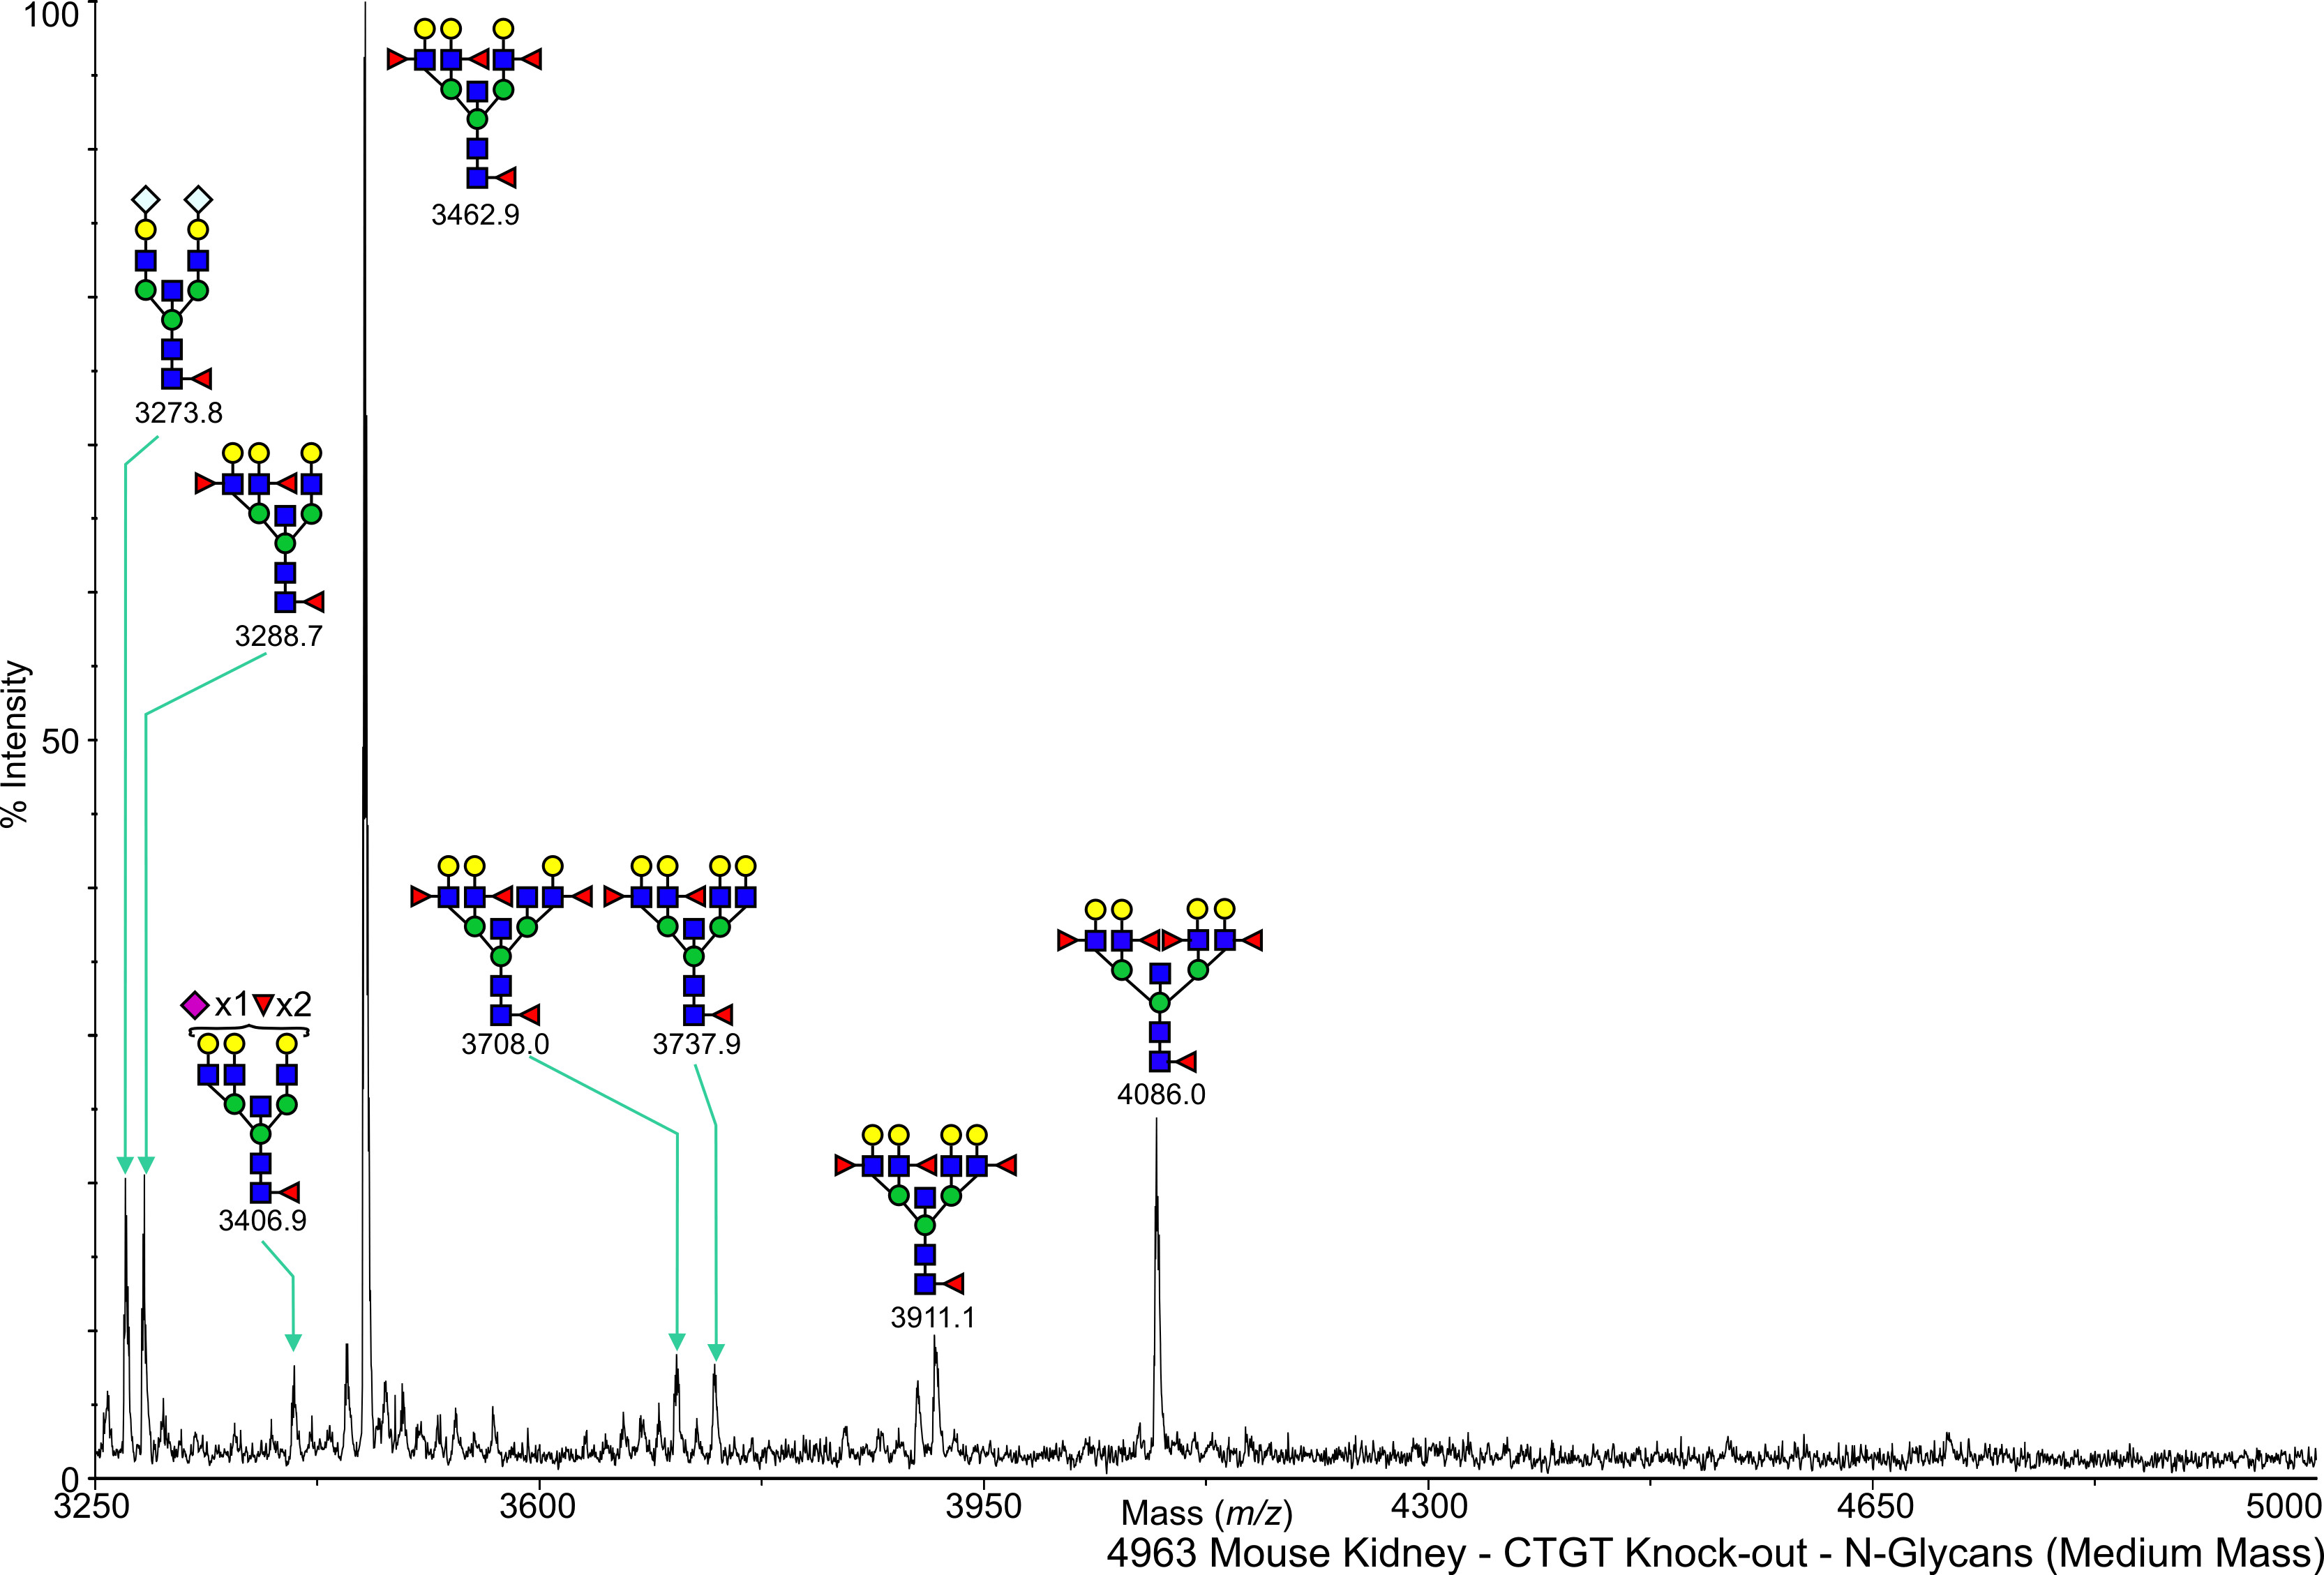
Mouse CT GalNAcT Kidney N-Linked C57BL/6 View experimental details      
Annotated file for lower mass range in JPG formatAnnotated file for higher mass range in JPG format Annotated file for lower mass range in PDF formatAnnotated file for higher mass range in PDF format
View Mass Spectrum data as text View Mass Peak file   Interactive Mass Spectrum Viewer
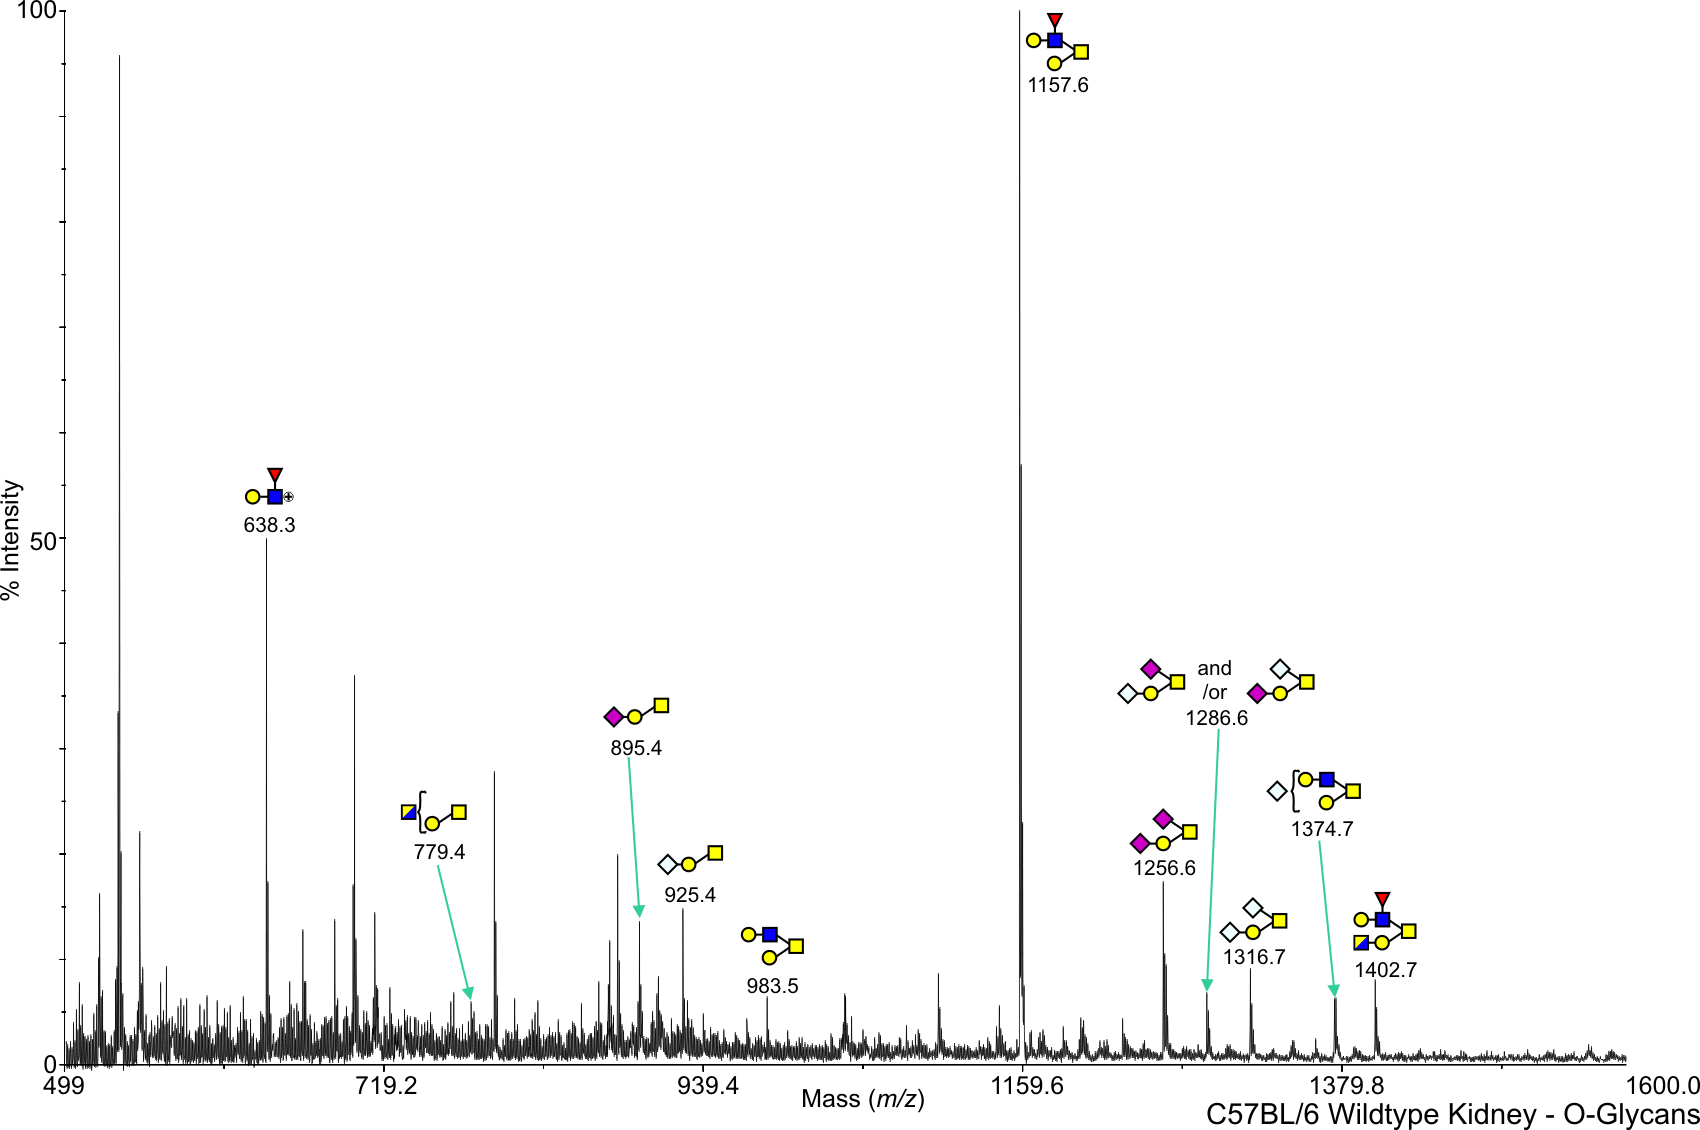
Mouse Wild Type Kidney O-Linked C57BL/6 View experimental details      
Annotated file in JPG format Annotated file in PDF format
View Mass Spectrum data as text View Mass Peak file   Interactive Mass Spectrum Viewer
FA Mouse Fuct IV Kidney O-Linked C57BL/6 View experimental details      
Annotated file in JPG format Annotated file in PDF format
View Mass Spectrum data as text View Mass Peak file   Interactive Mass Spectrum Viewer
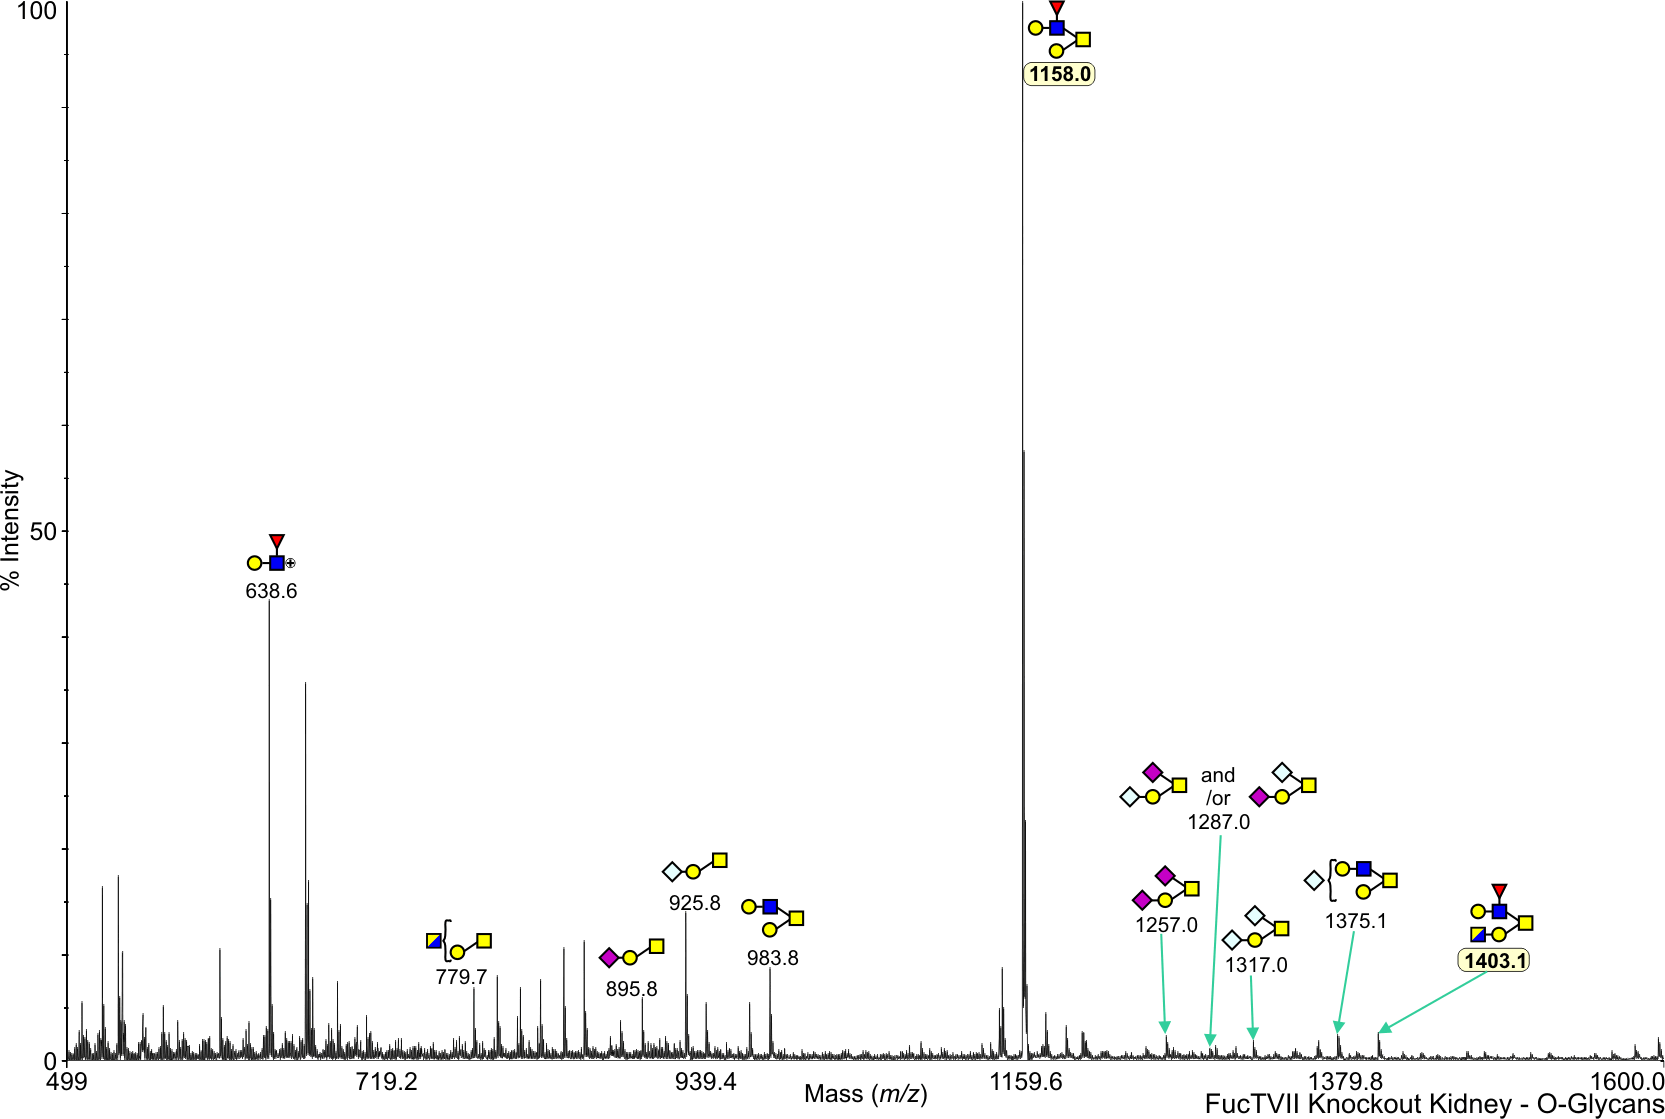
FB Mouse Fuct VII Kidney O-Linked C57BL/6 View experimental details      
Annotated file in JPG format Annotated file in PDF format
View Mass Spectrum data as text View Mass Peak file   Interactive Mass Spectrum Viewer
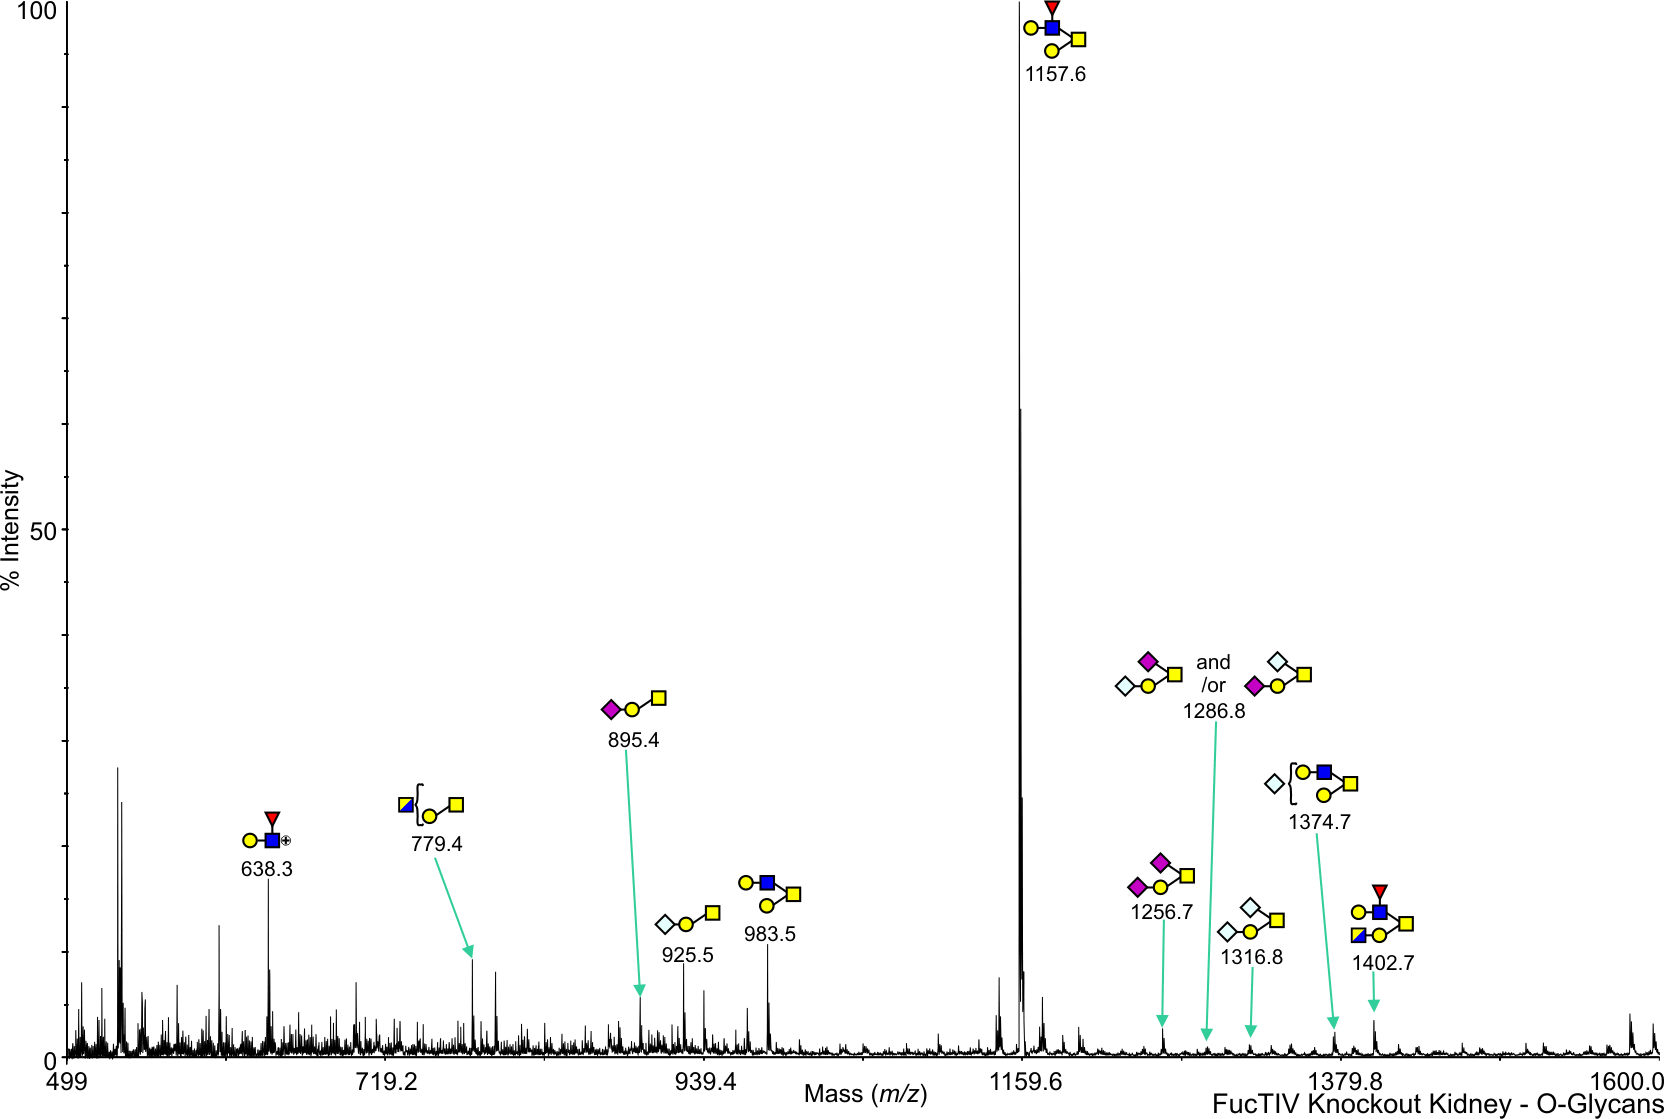
FC Mouse Fuct IV + VII Kidney O-Linked C57BL/6 View experimental details      
   
View Mass Spectrum data as text      
GT Mouse Gal 3 Kidney O-Linked C57BL/6 View experimental details      
   
View Mass Spectrum data as text      
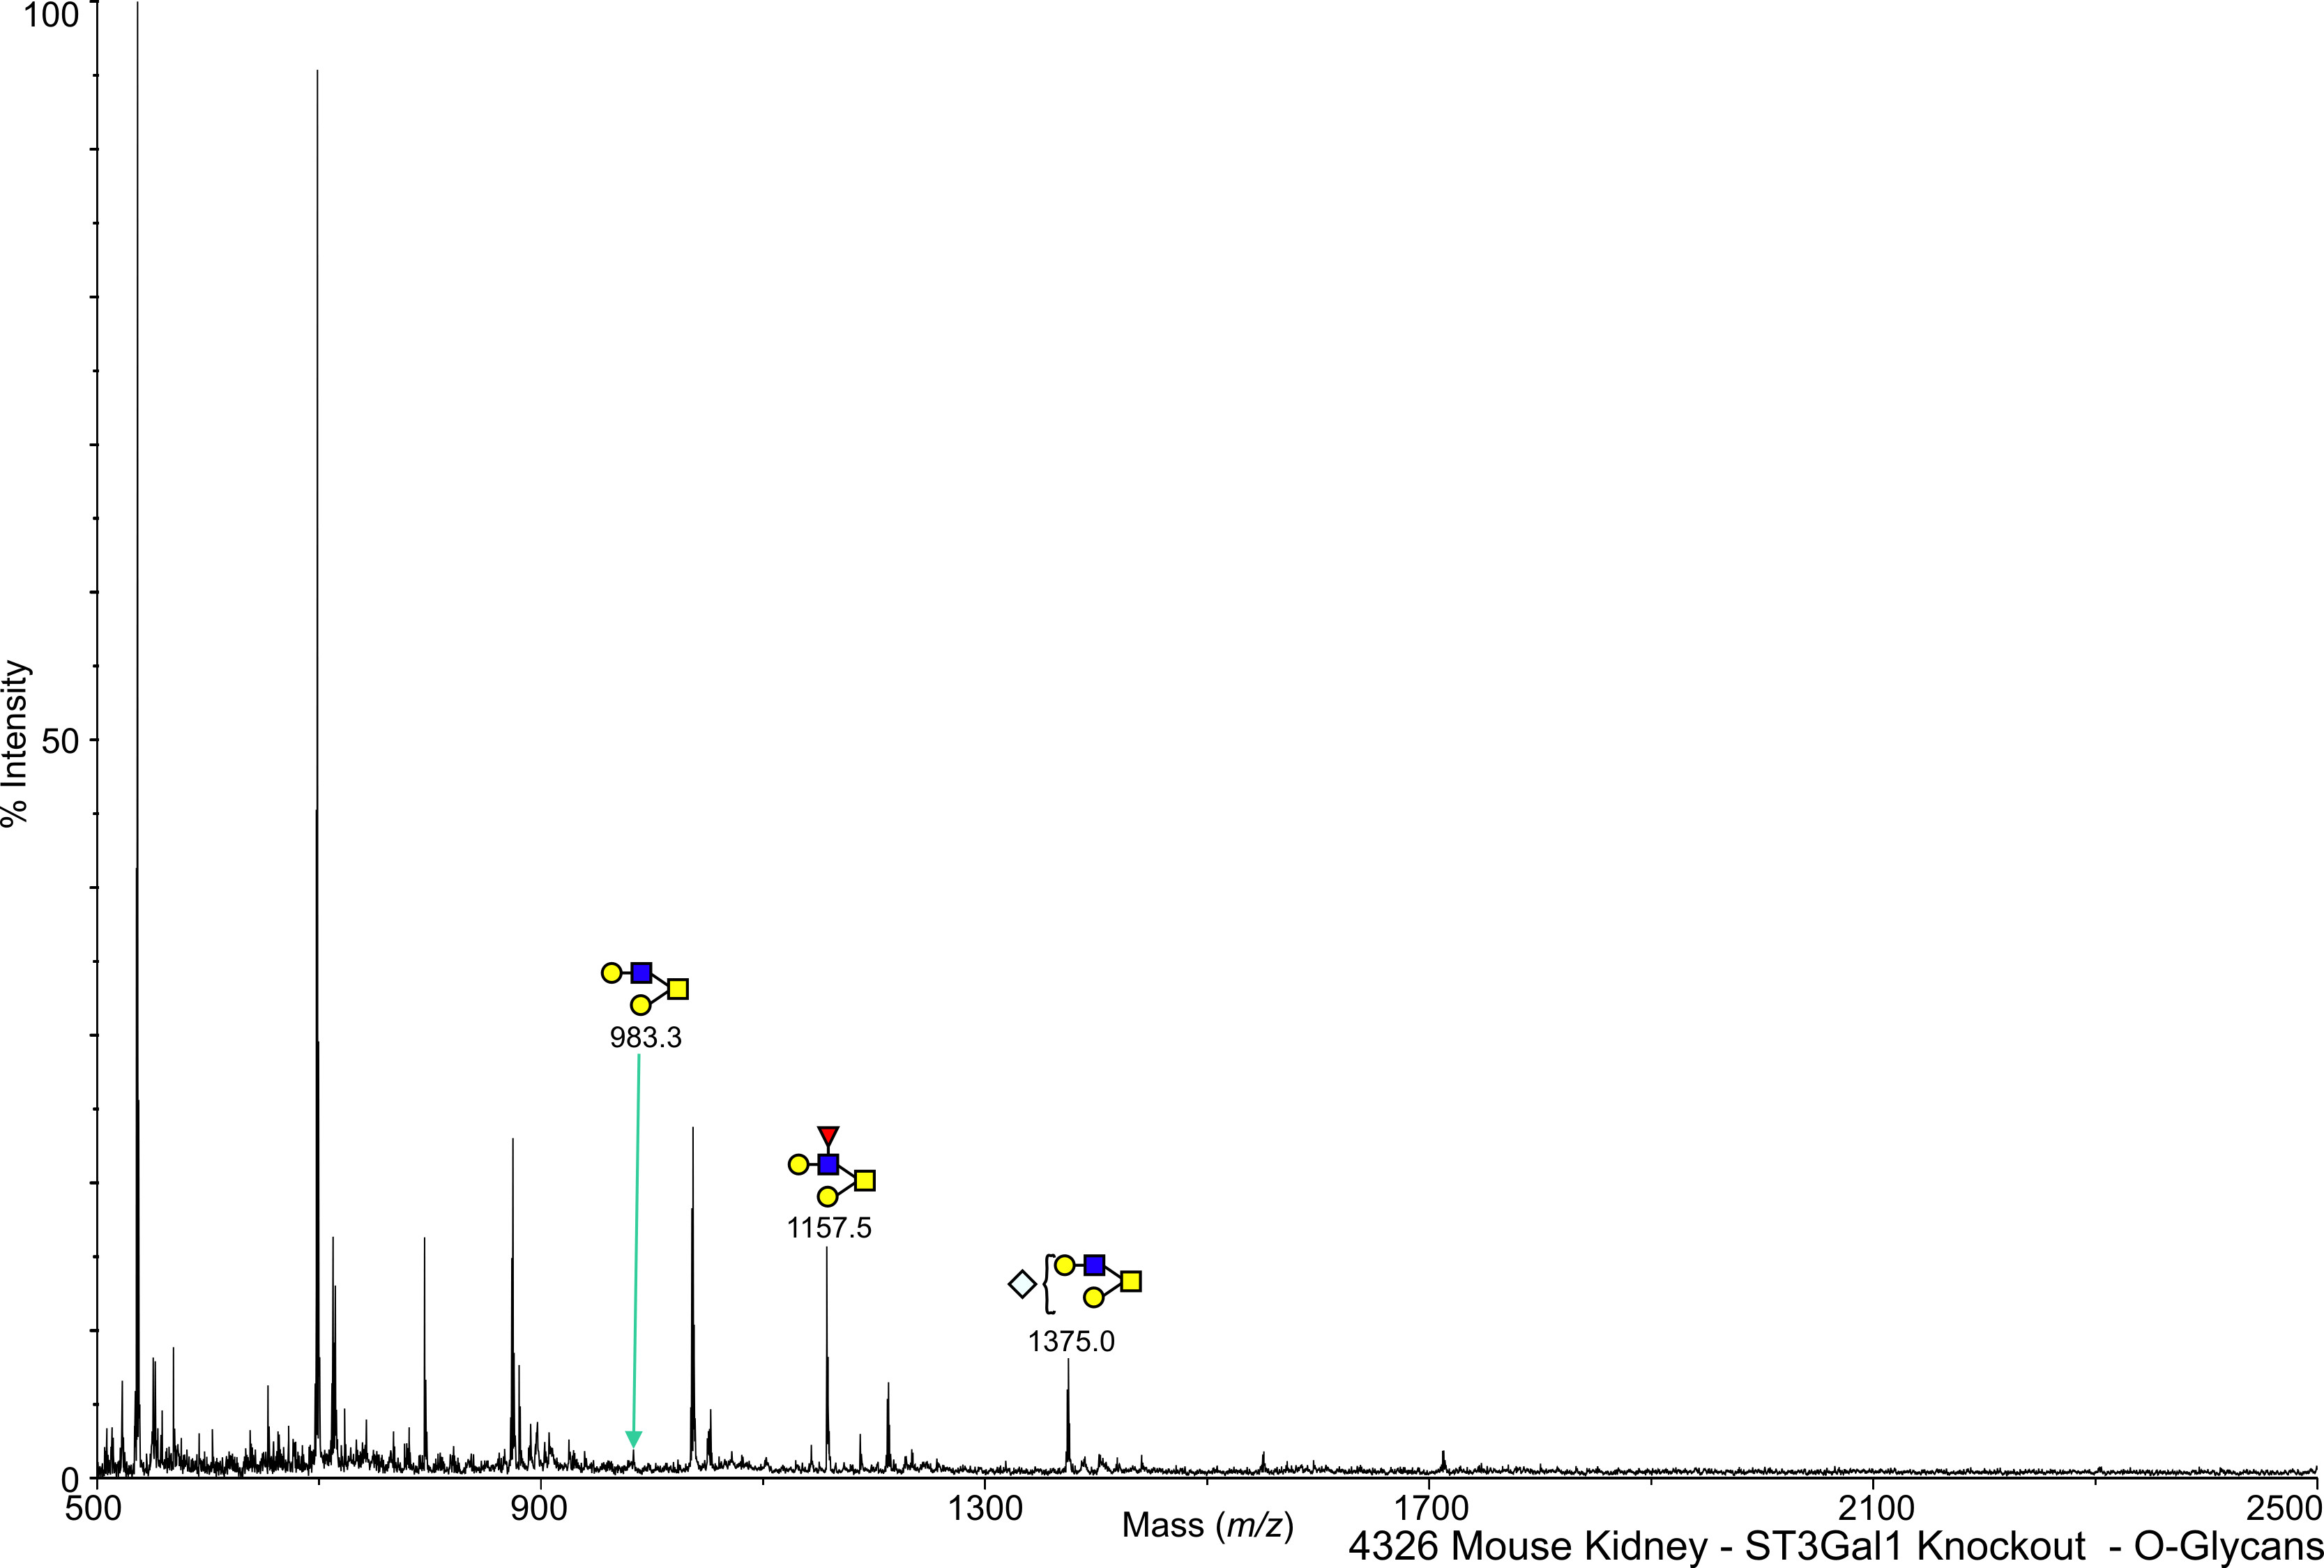
ST Mouse ST3 Gal 1 Kidney O-Linked C57BL/6 View experimental details      
Annotated file in JPG format Annotated file in PDF format
View Mass Spectrum data as text View Mass Peak file   Interactive Mass Spectrum Viewer
MG Mouse Core 2 GlcNAcT Kidney O-Linked C57BL/6 View experimental details      
   
View Mass Spectrum data as text      
Mouse CT GalNAcT Kidney O-Linked C57BL/6 View experimental details      
Annotated file in JPG format Annotated file in PDF format
View Mass Spectrum data as text View Mass Peak file   Interactive Mass Spectrum Viewer
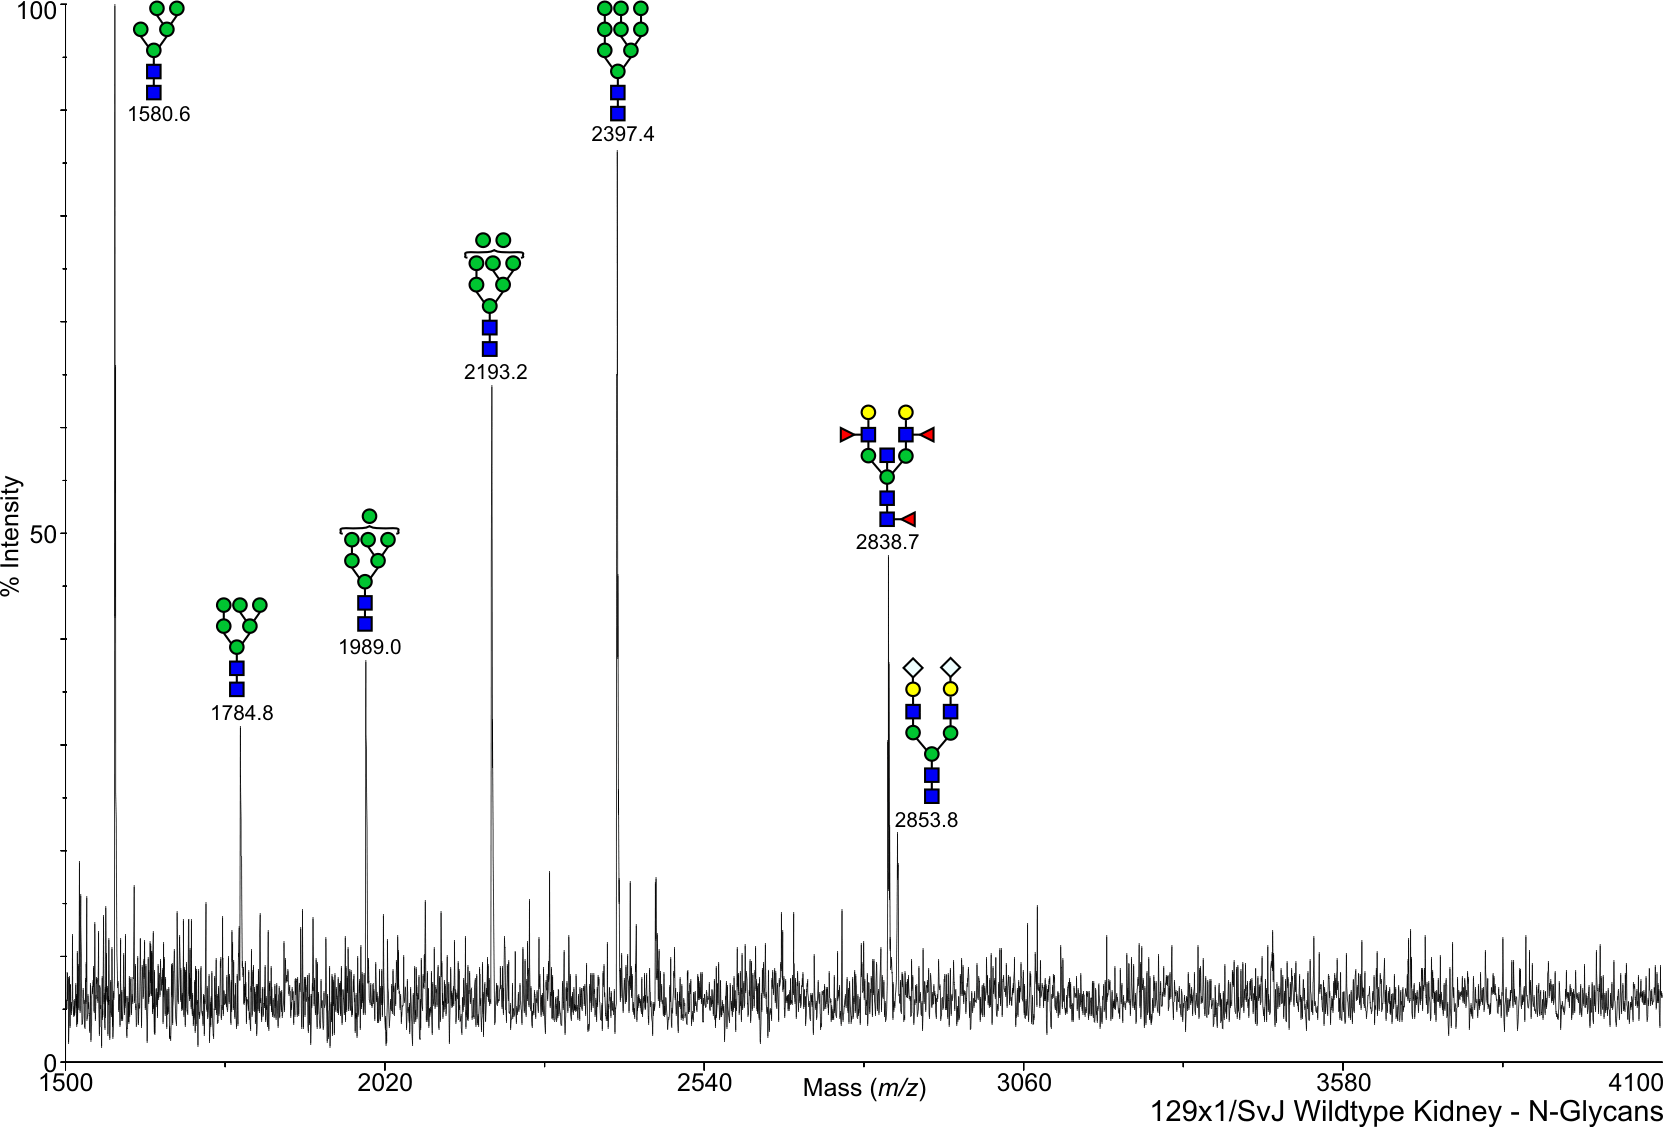
Mouse Wild Type Kidney N-Linked 129x1SvJ View experimental details      
Annotated file in JPG format Annotated file in PDF format
View Mass Spectrum data as text View Mass Peak file   Interactive Mass Spectrum Viewer
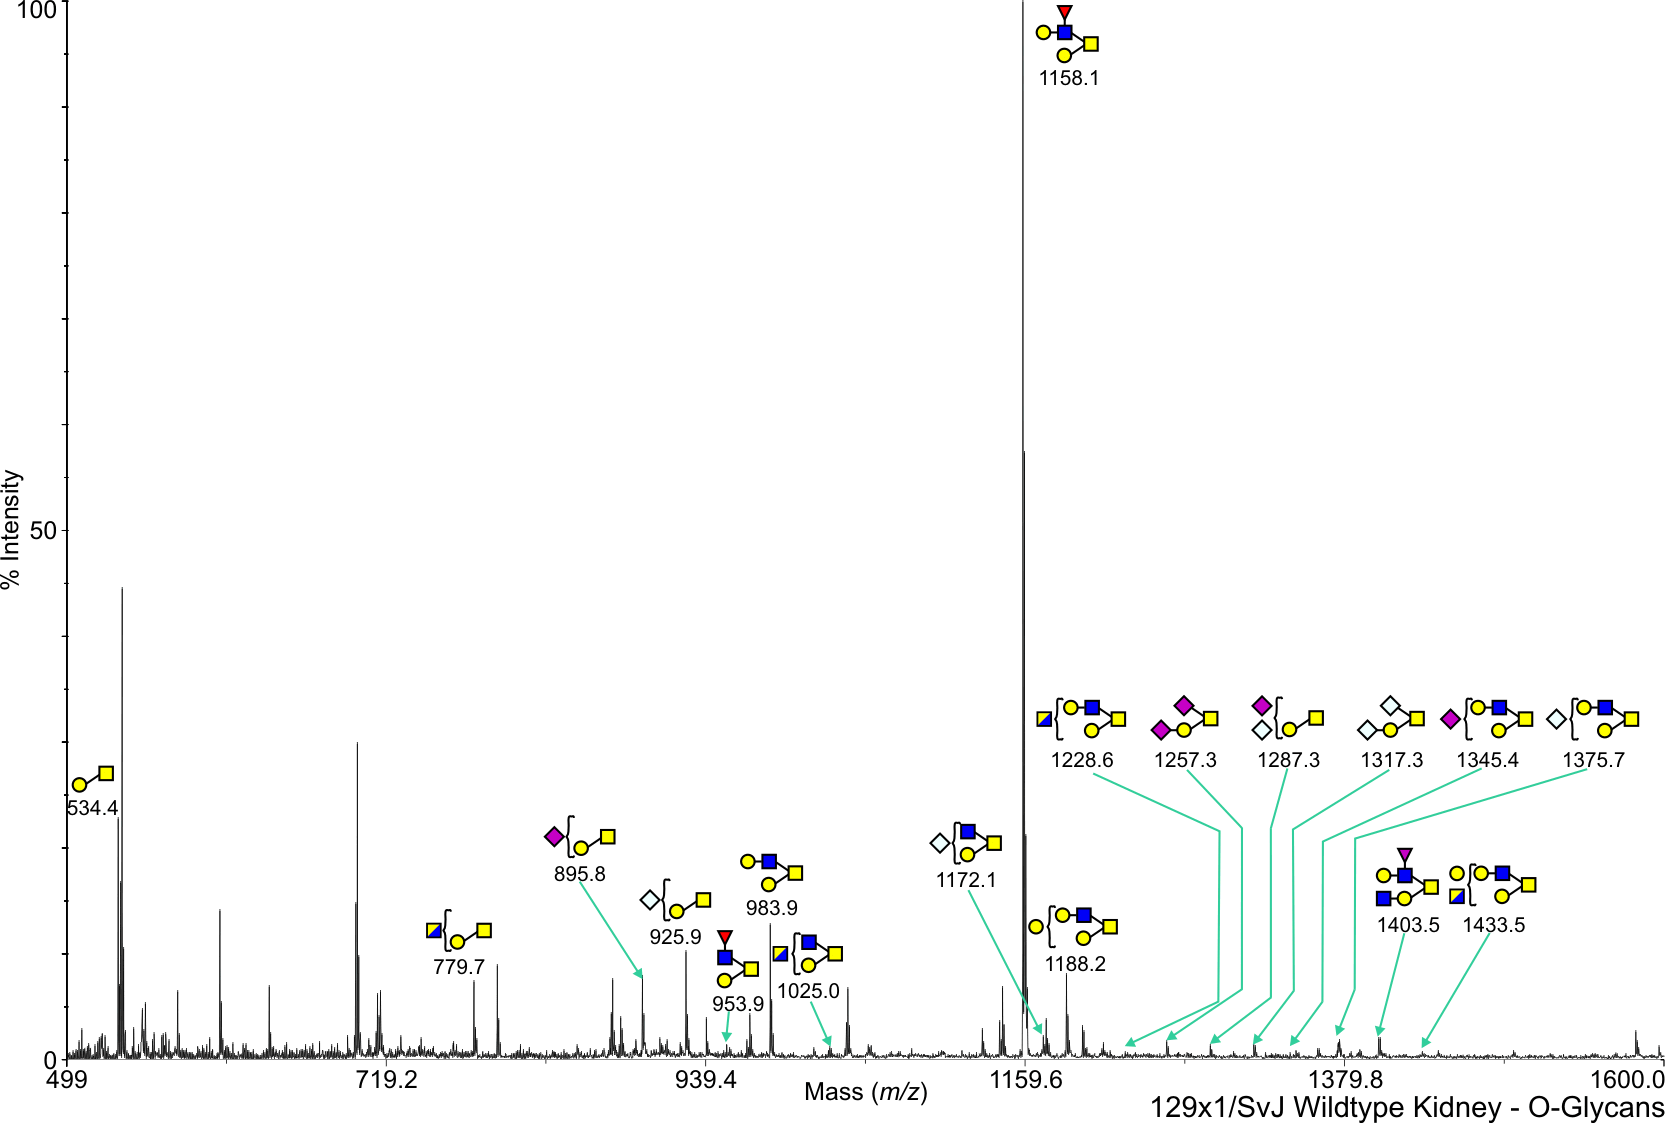
Mouse Wild Type Kidney O-Linked 129x1SvJ View experimental details      
Annotated file in JPG format Annotated file in PDF format
View Mass Spectrum data as text View Mass Peak file   Interactive Mass Spectrum Viewer
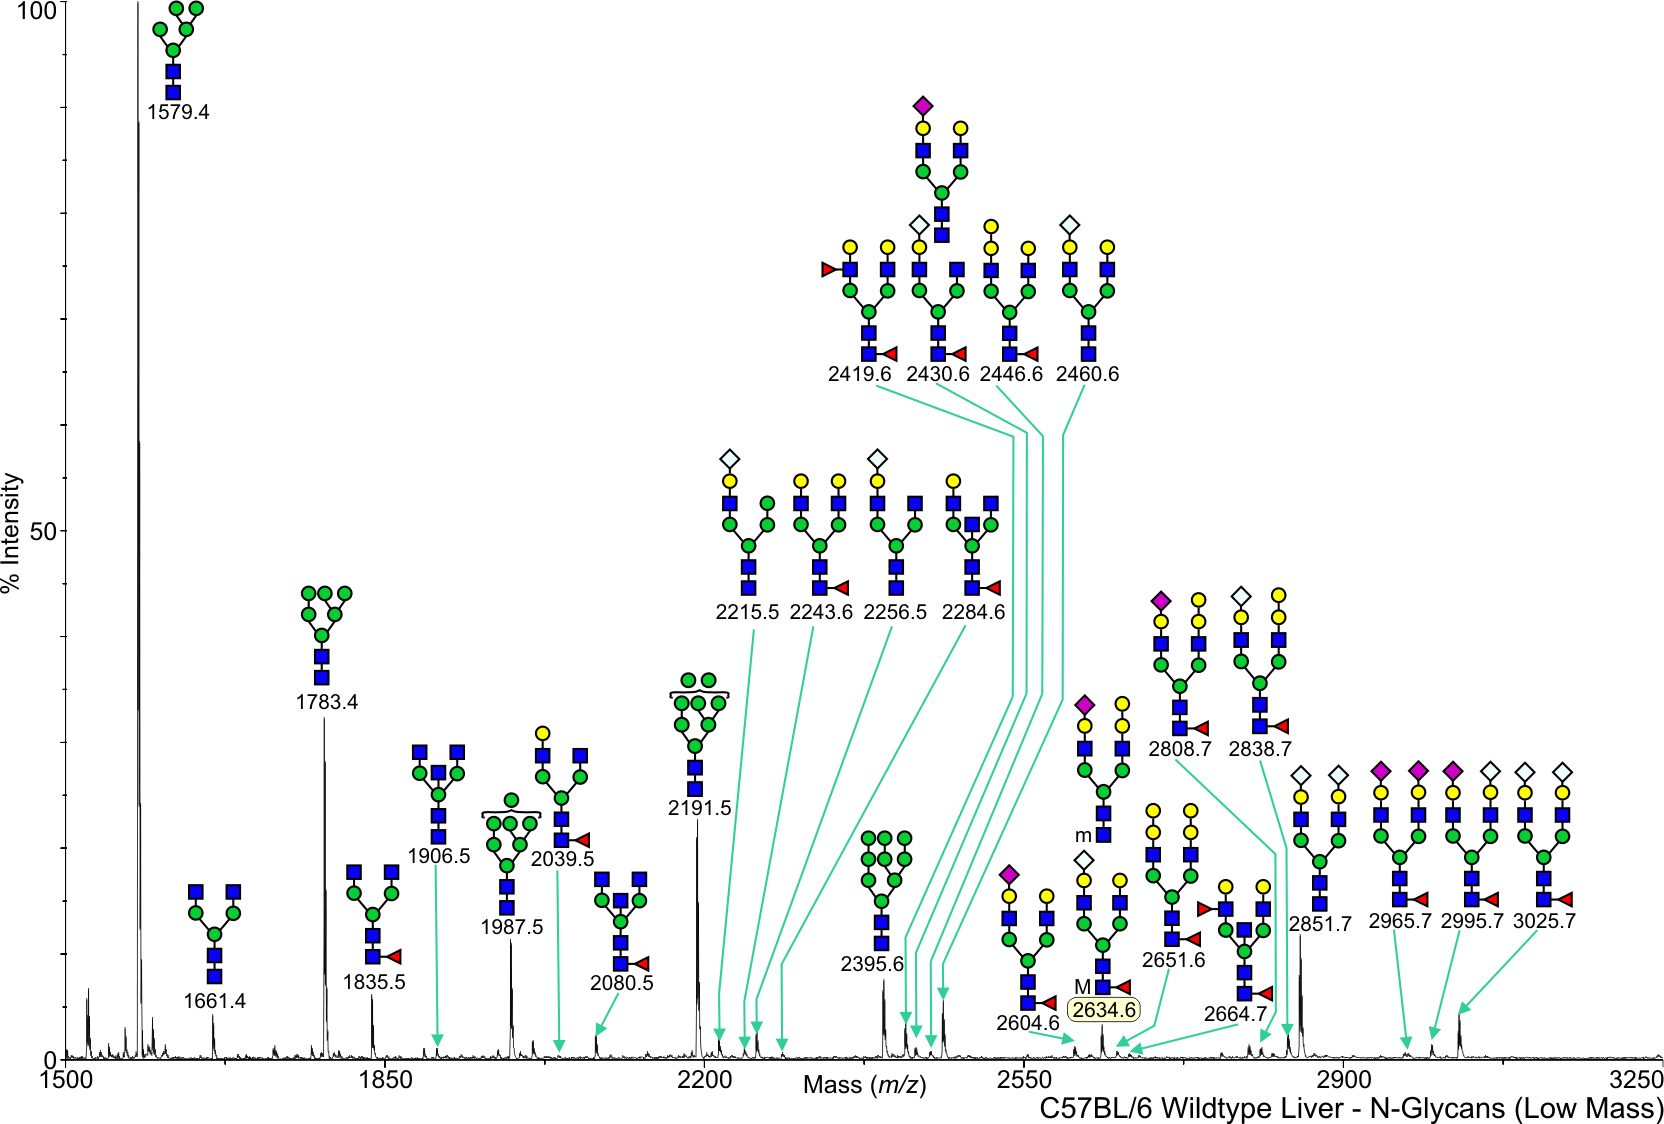
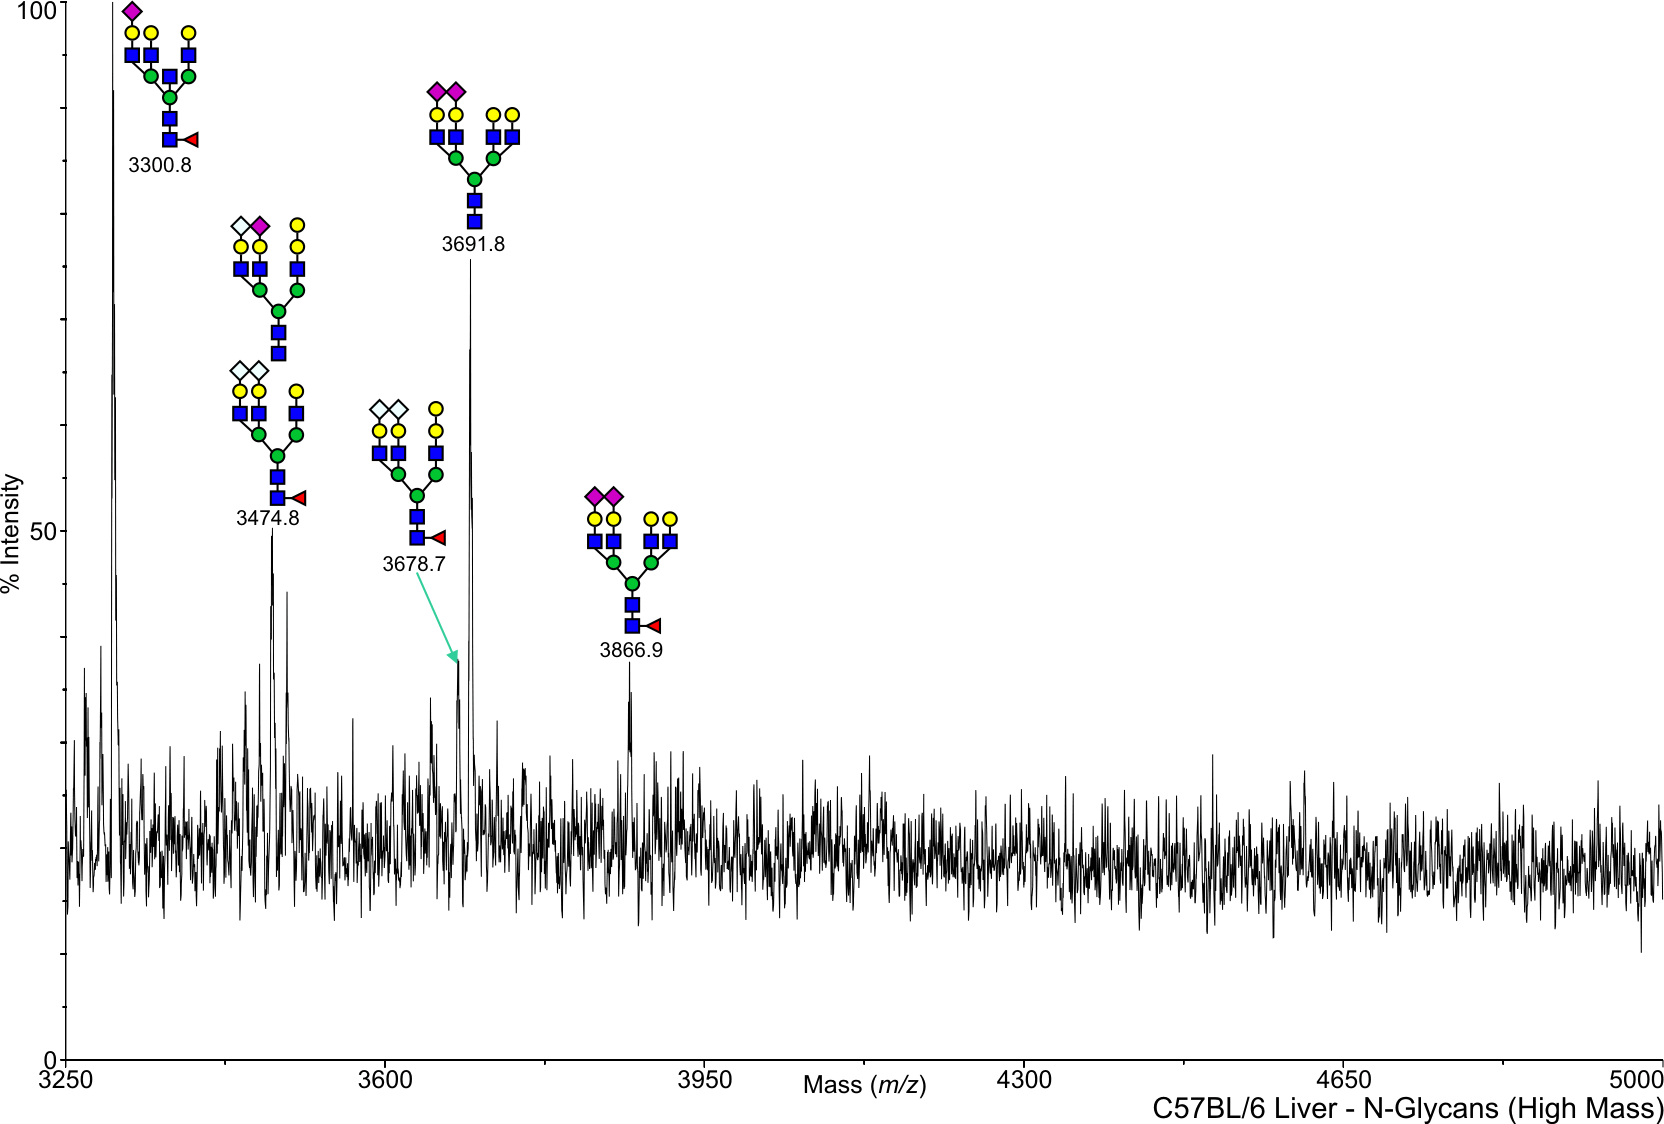
Mouse Wild Type Liver N-Linked C57BL/6 View experimental details      
Annotated file for lower mass range in JPG formatAnnotated file for higher mass range in JPG format Annotated file for lower mass range in PDF formatAnnotated file for higher mass range in PDF format
View Mass Spectrum data as text View Mass Peak file   Interactive Mass Spectrum Viewer
Mouse Wild Type Liver O-Linked C57BL/6 View experimental details      
   
View Mass Spectrum data as text      
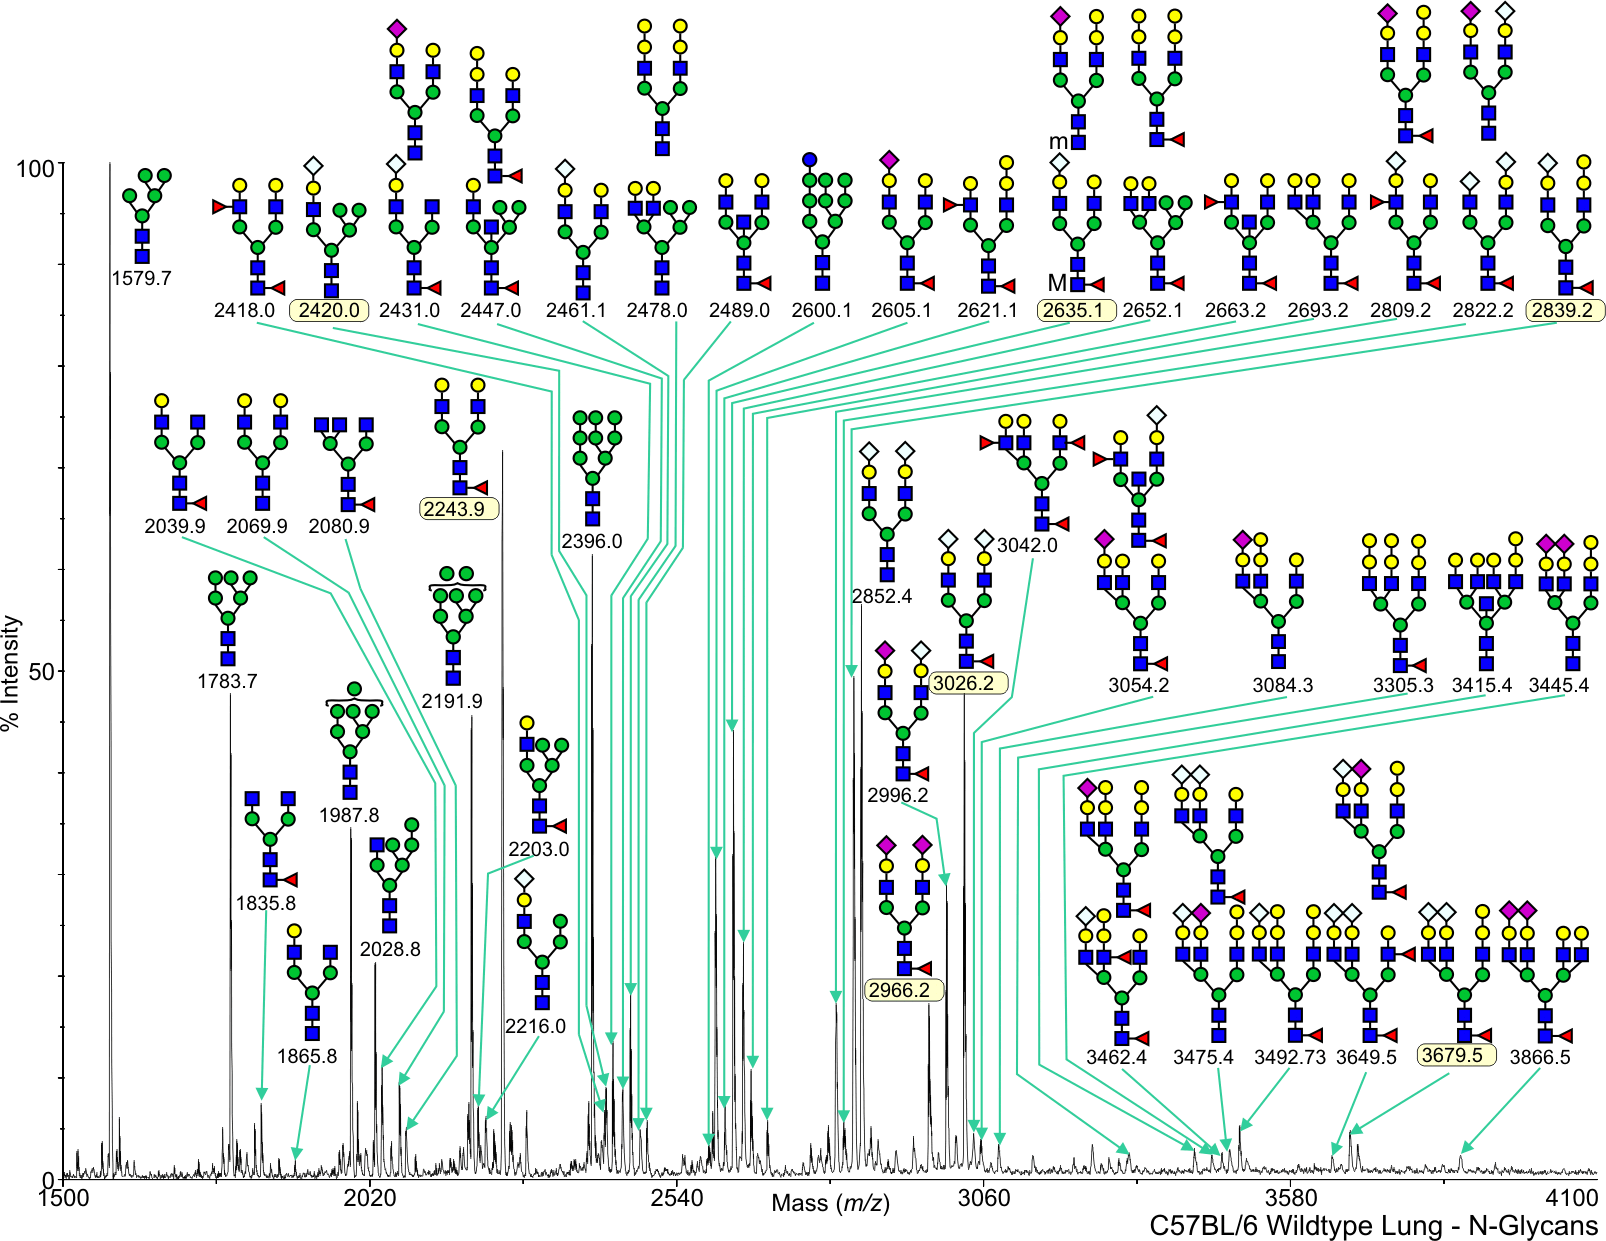
Mouse Wild Type Lung N-Linked C57BL/6 View experimental details      
Annotated file in JPG format Annotated file in PDF format
View Mass Spectrum data as text View Mass Peak file   Interactive Mass Spectrum Viewer
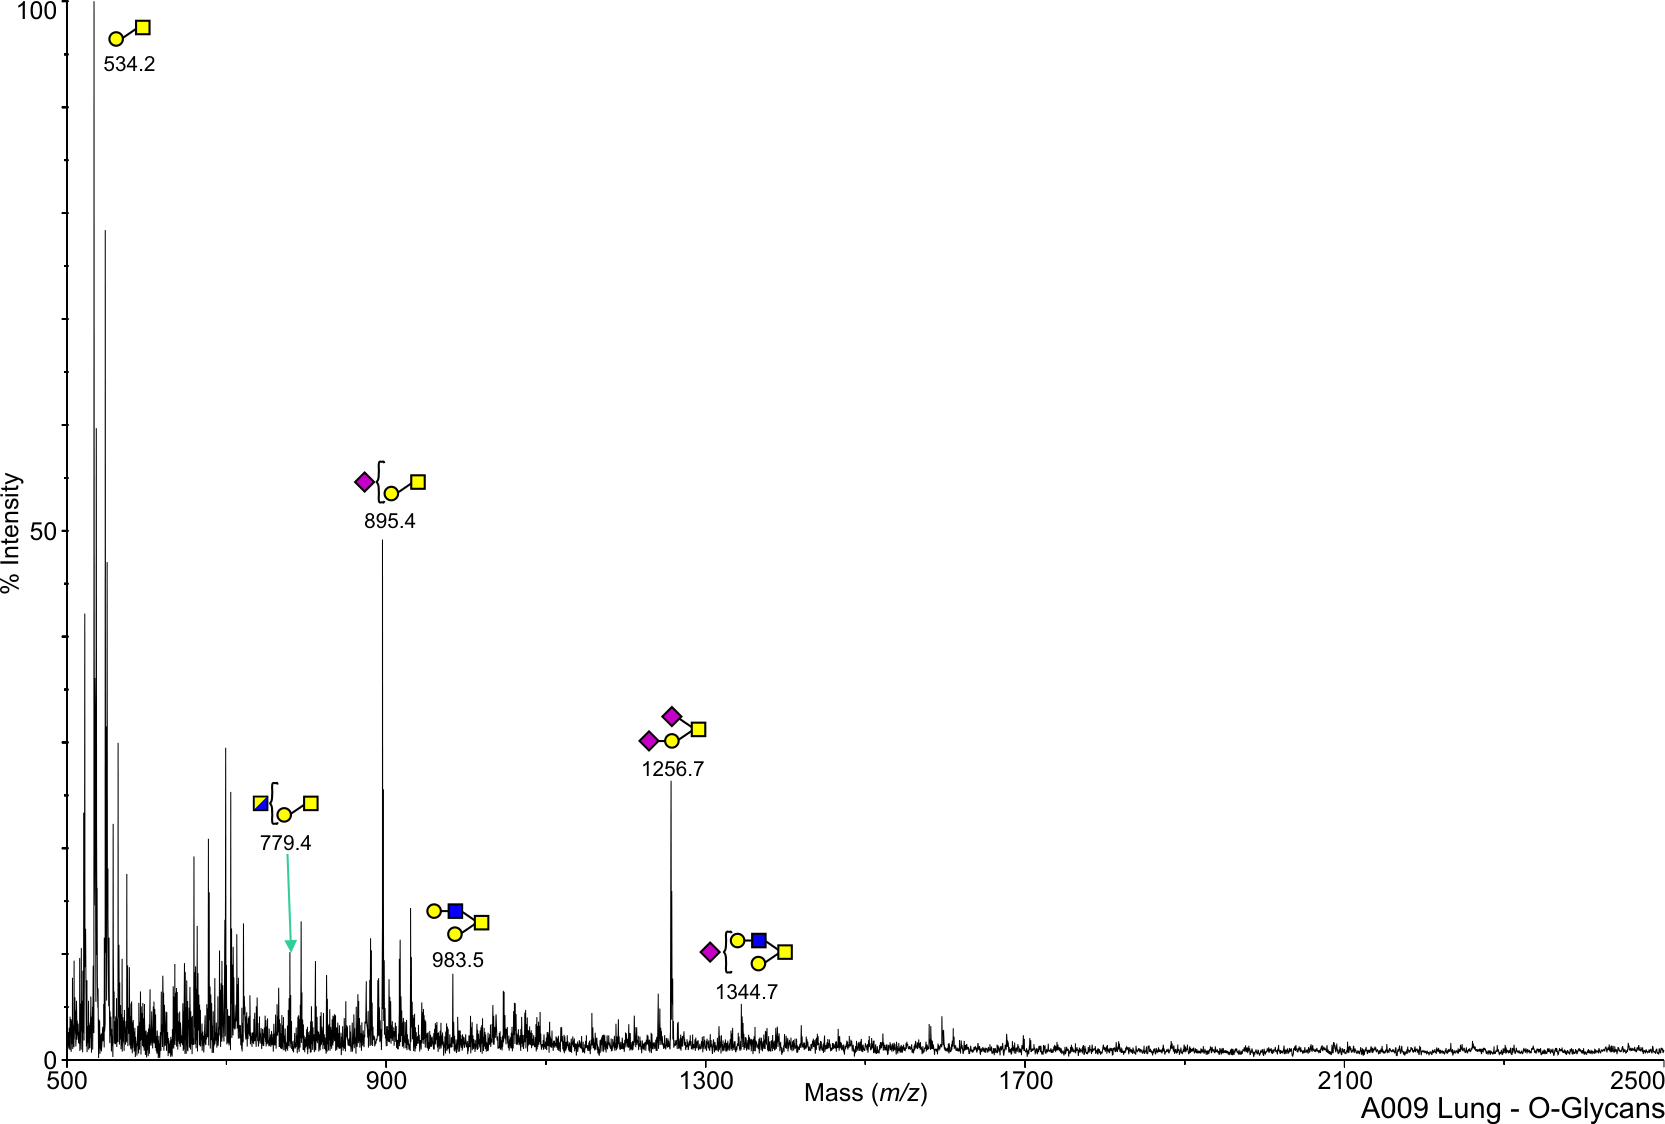
Mouse Wild Type Lung O-Linked C57BL/6 View experimental details      
   
View Mass Spectrum data as text      
MG Mouse Core 2 GlcNAcT Lymph Node N-Linked C57BL/6 View experimental details      
   
View Mass Spectrum data as text      
Mouse CT GalNAcT Lymph Node N-Linked C57BL/6 View experimental details      
   
View Mass Spectrum data as text      
MG Mouse Core 2 GlcNAcT Lymph Node O-Linked C57BL/6 View experimental details      
   
View Mass Spectrum data as text      
Mouse CT GalNAcT Lymph Node O-Linked C57BL/6 View experimental details      
   
View Mass Spectrum data as text      
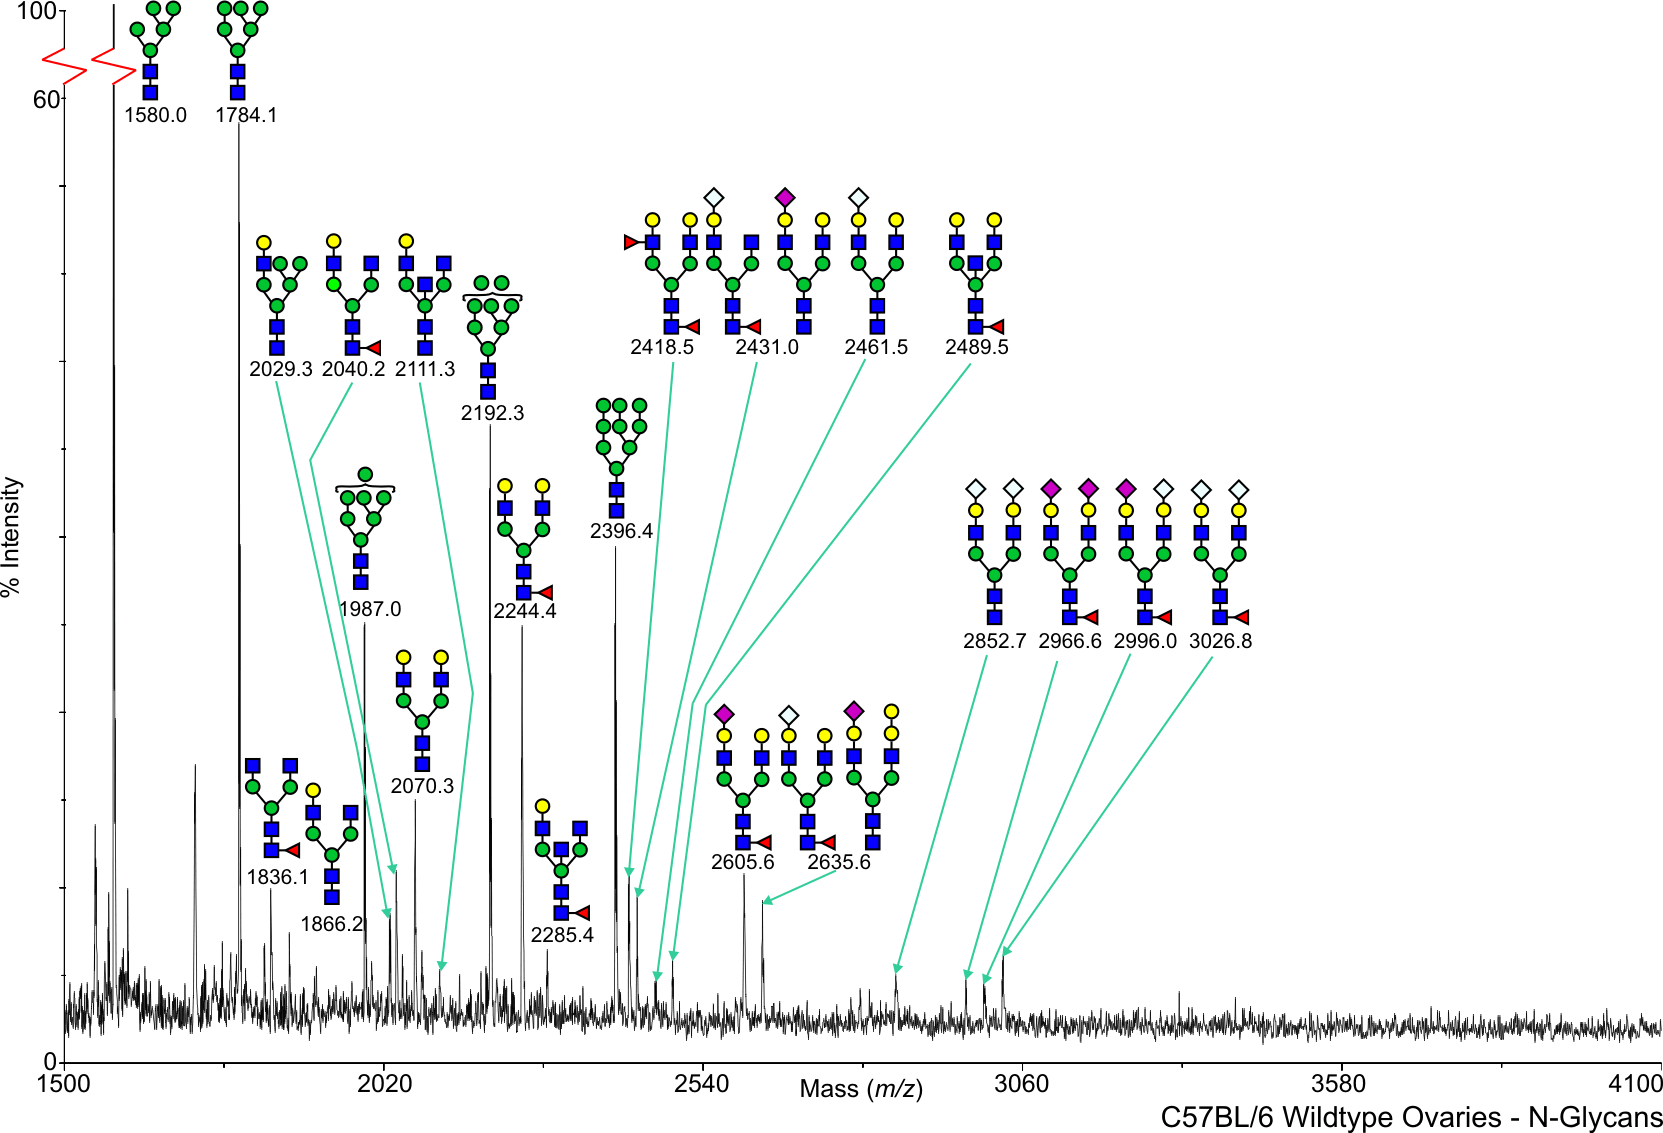
Mouse Wild Type Ovaries N-Linked C57BL/6 View experimental details      
Annotated file in JPG format Annotated file in PDF format
View Mass Spectrum data as text View Mass Peak file   Interactive Mass Spectrum Viewer
Mouse Wild Type Ovaries O-Linked C57BL/6 View experimental details      
   
View Mass Spectrum data as text      
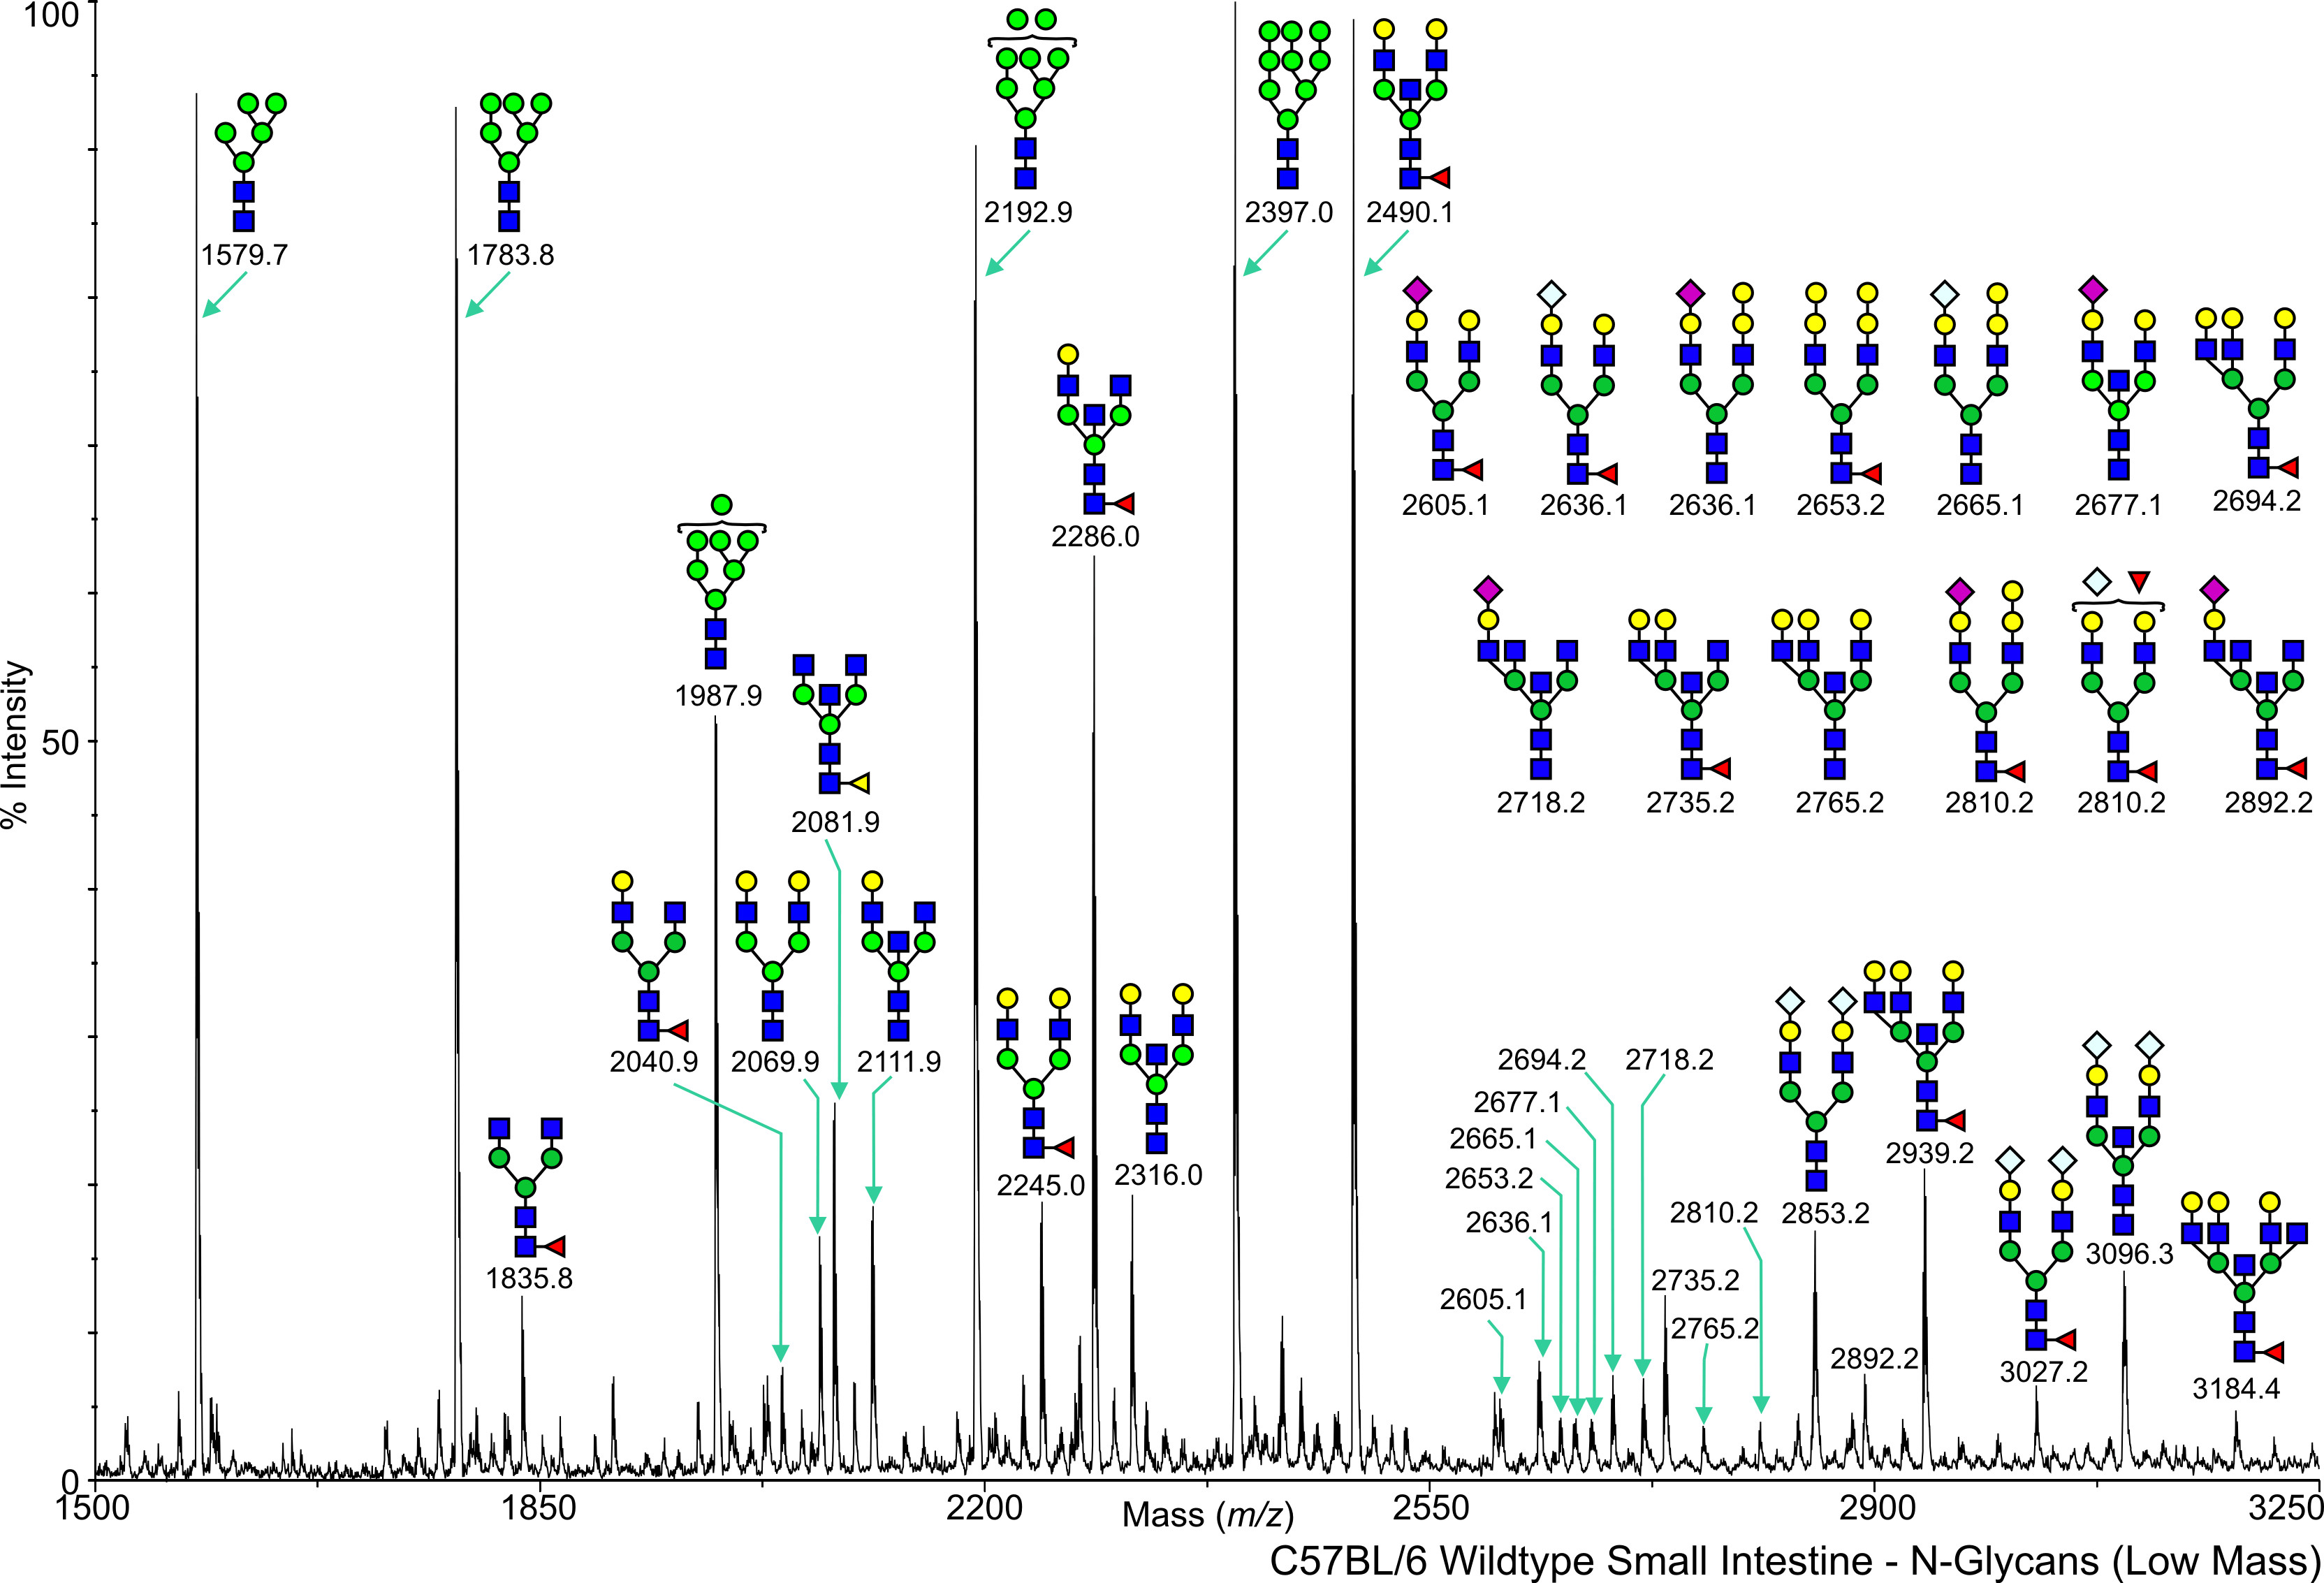
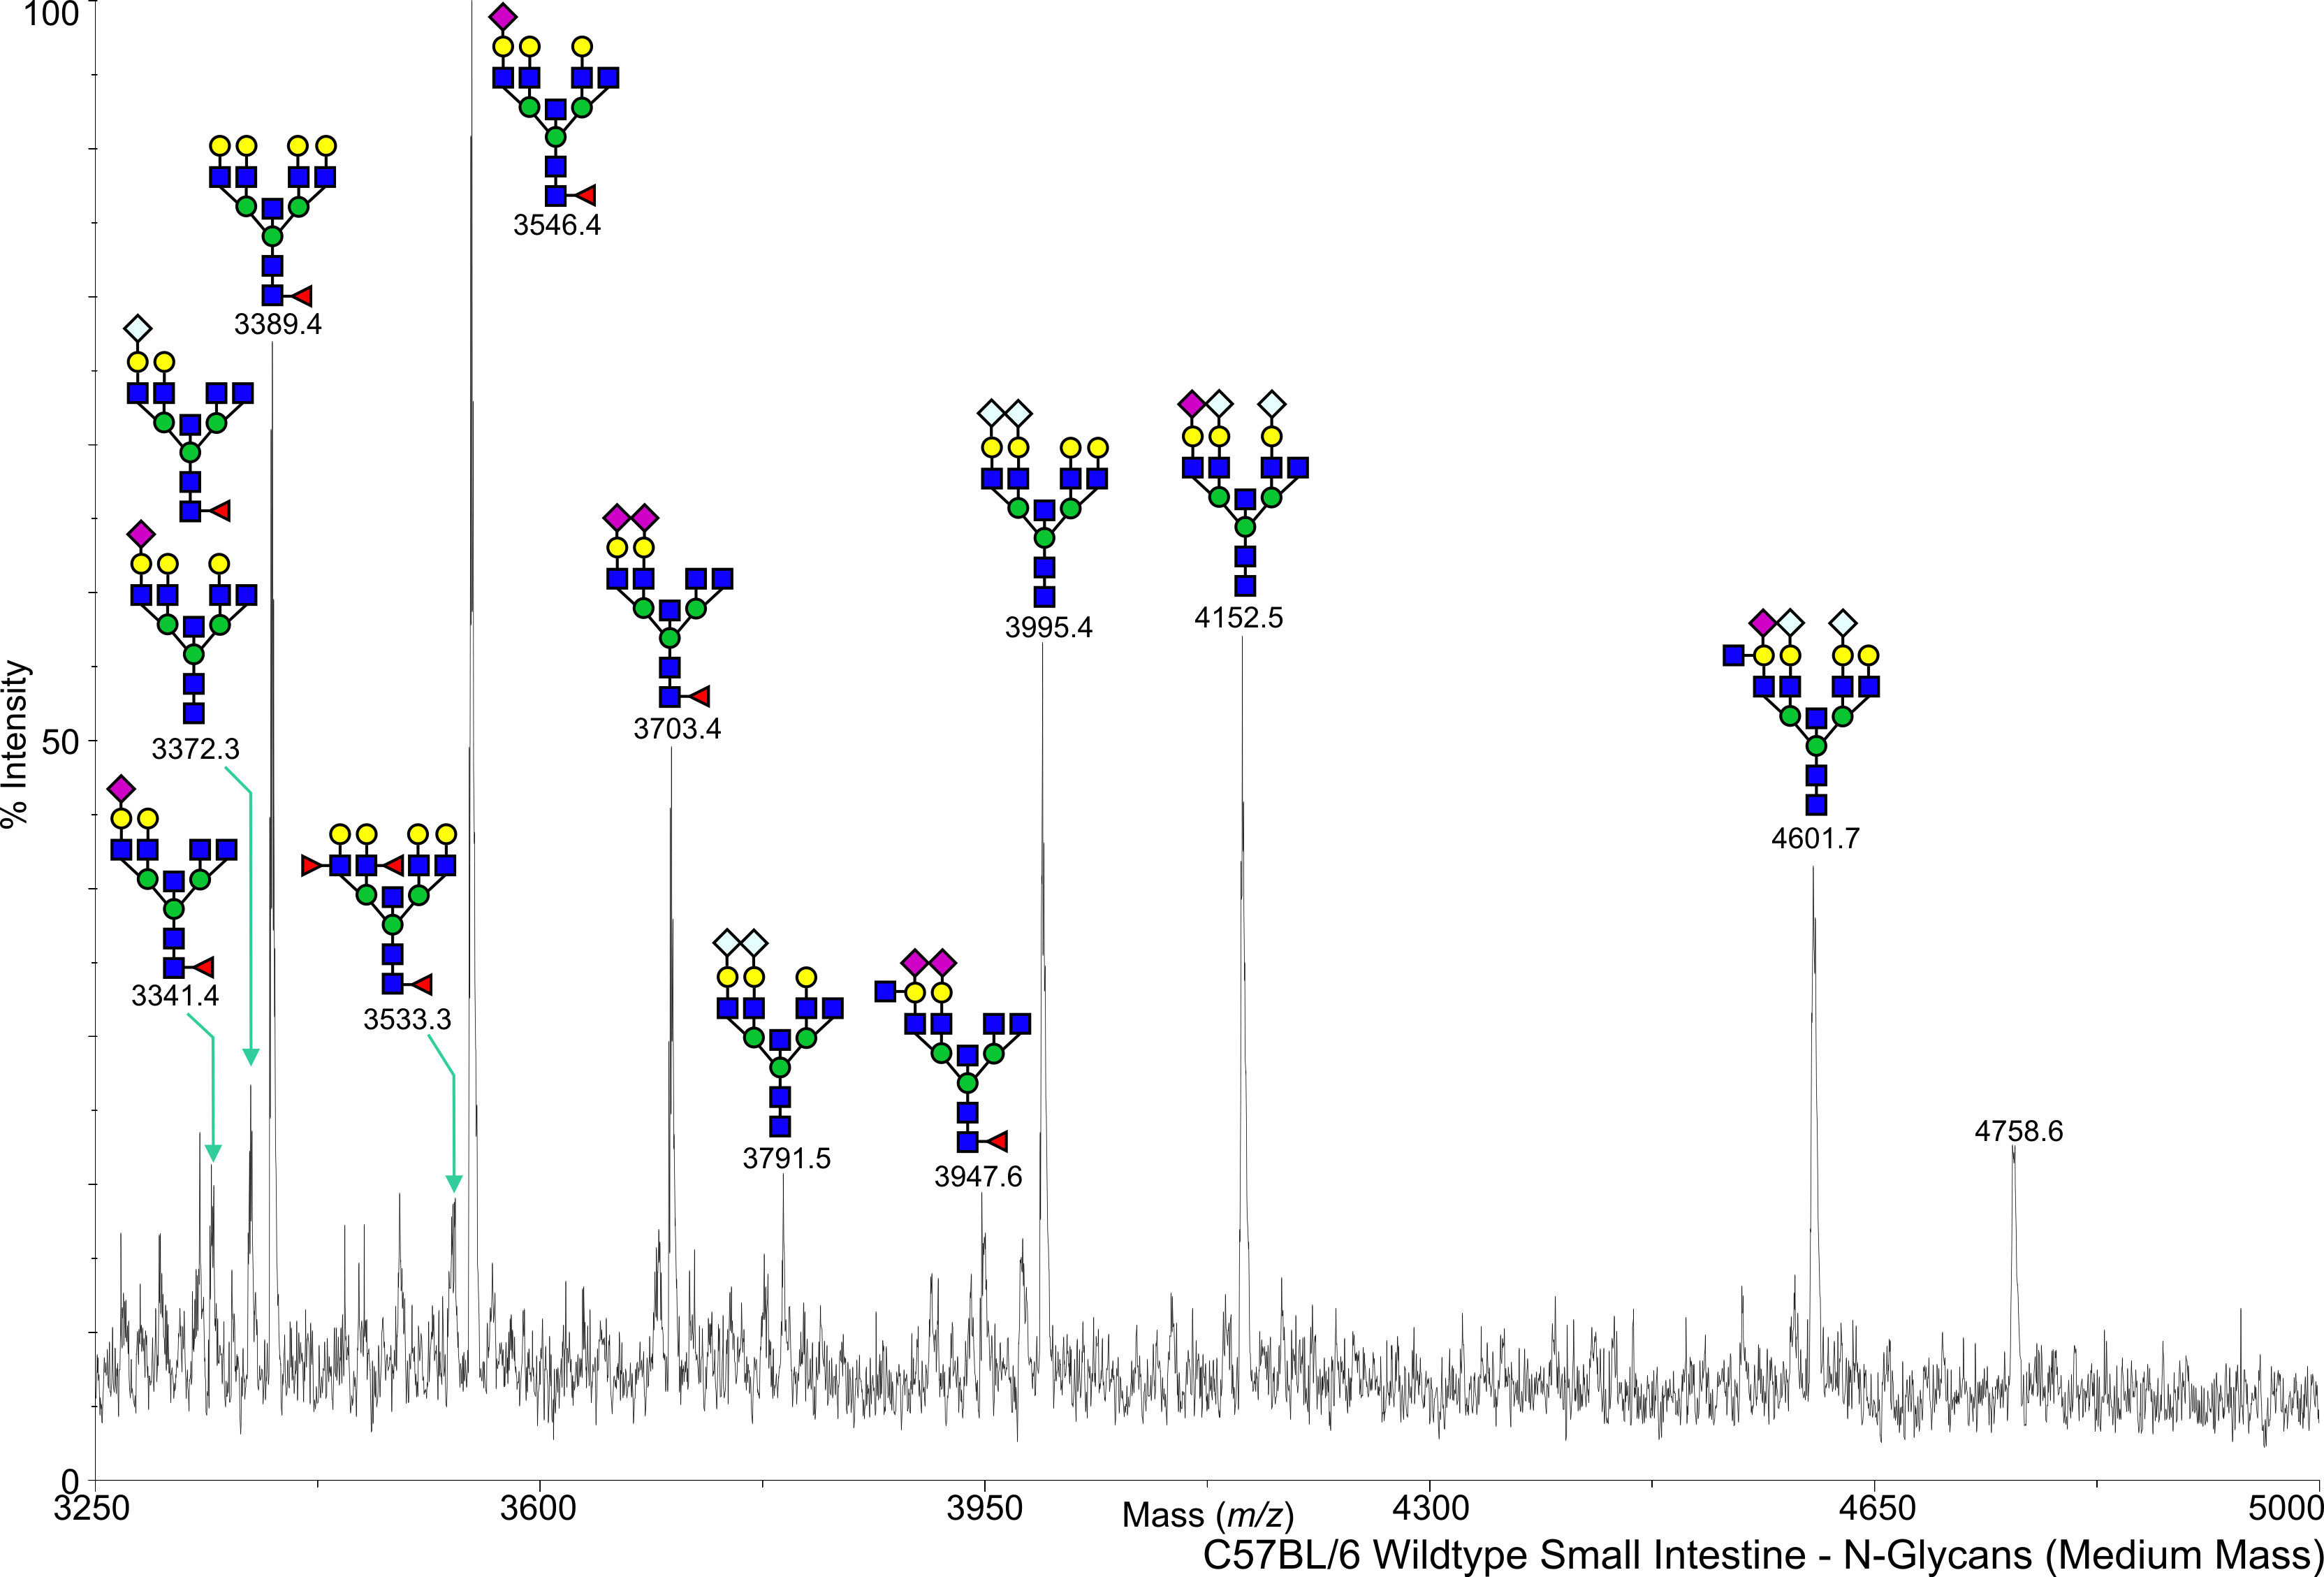
Mouse Wild Type Small Intestine N-Linked C57BL/6 View experimental details      
Annotated file for lower mass range in JPG formatAnnotated file for higher mass range in JPG format Annotated file for lower mass range in PDF formatAnnotated file for higher mass range in PDF format
View Mass Spectrum data as text View Mass Peak file   Interactive Mass Spectrum Viewer
FC Mouse Fuct IV + VII Small Intestine N-Linked C57BL/6 View experimental details      
   
View Mass Spectrum data as text      
GT Mouse Gal 3 Small Intestine N-Linked C57BL/6 View experimental details      
   
View Mass Spectrum data as text      
ST Mouse ST3 Gal 1 Small Intestine N-Linked C57BL/6 View experimental details      
   
View Mass Spectrum data as text      
Mouse Wild Type Small Intestine O-Linked C57BL/6 View experimental details      
   
View Mass Spectrum data as text      
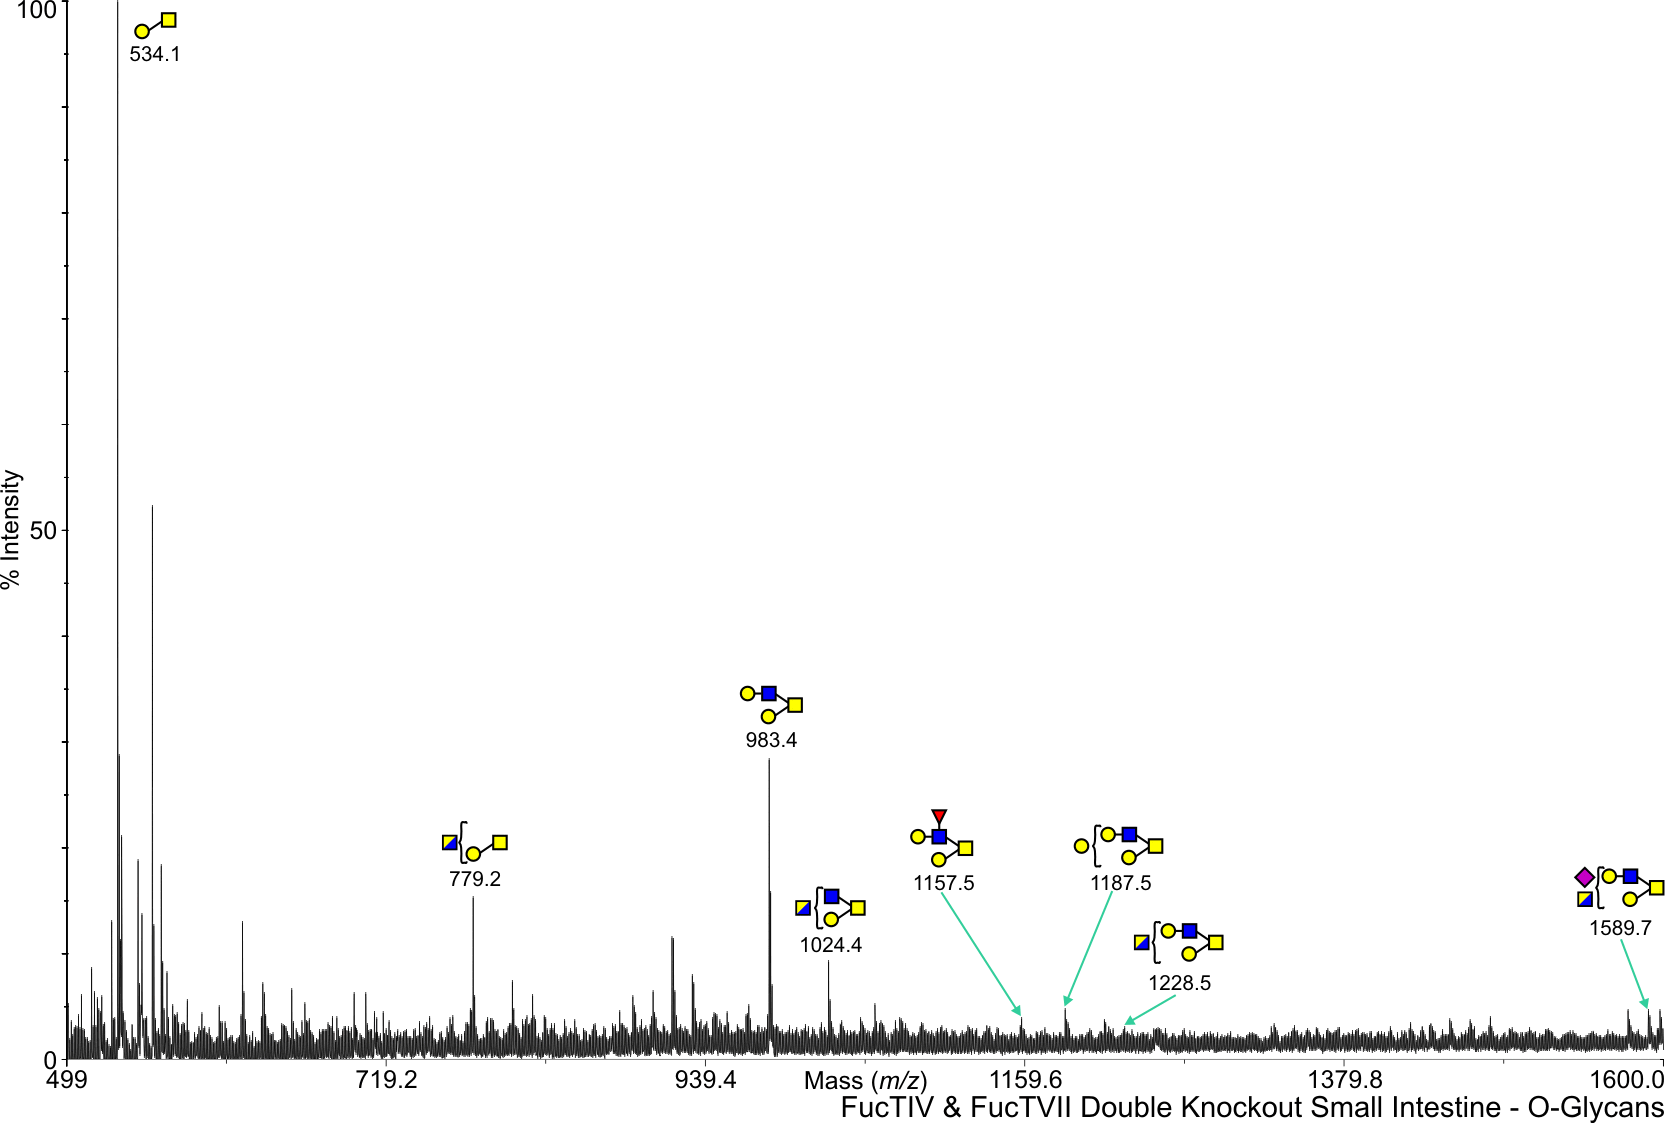
FC Mouse Fuct IV + VII Small Intestine O-Linked C57BL/6 View experimental details      
Annotated file in JPG format Annotated file in PDF format
View Mass Spectrum data as text View Mass Peak file   Interactive Mass Spectrum Viewer
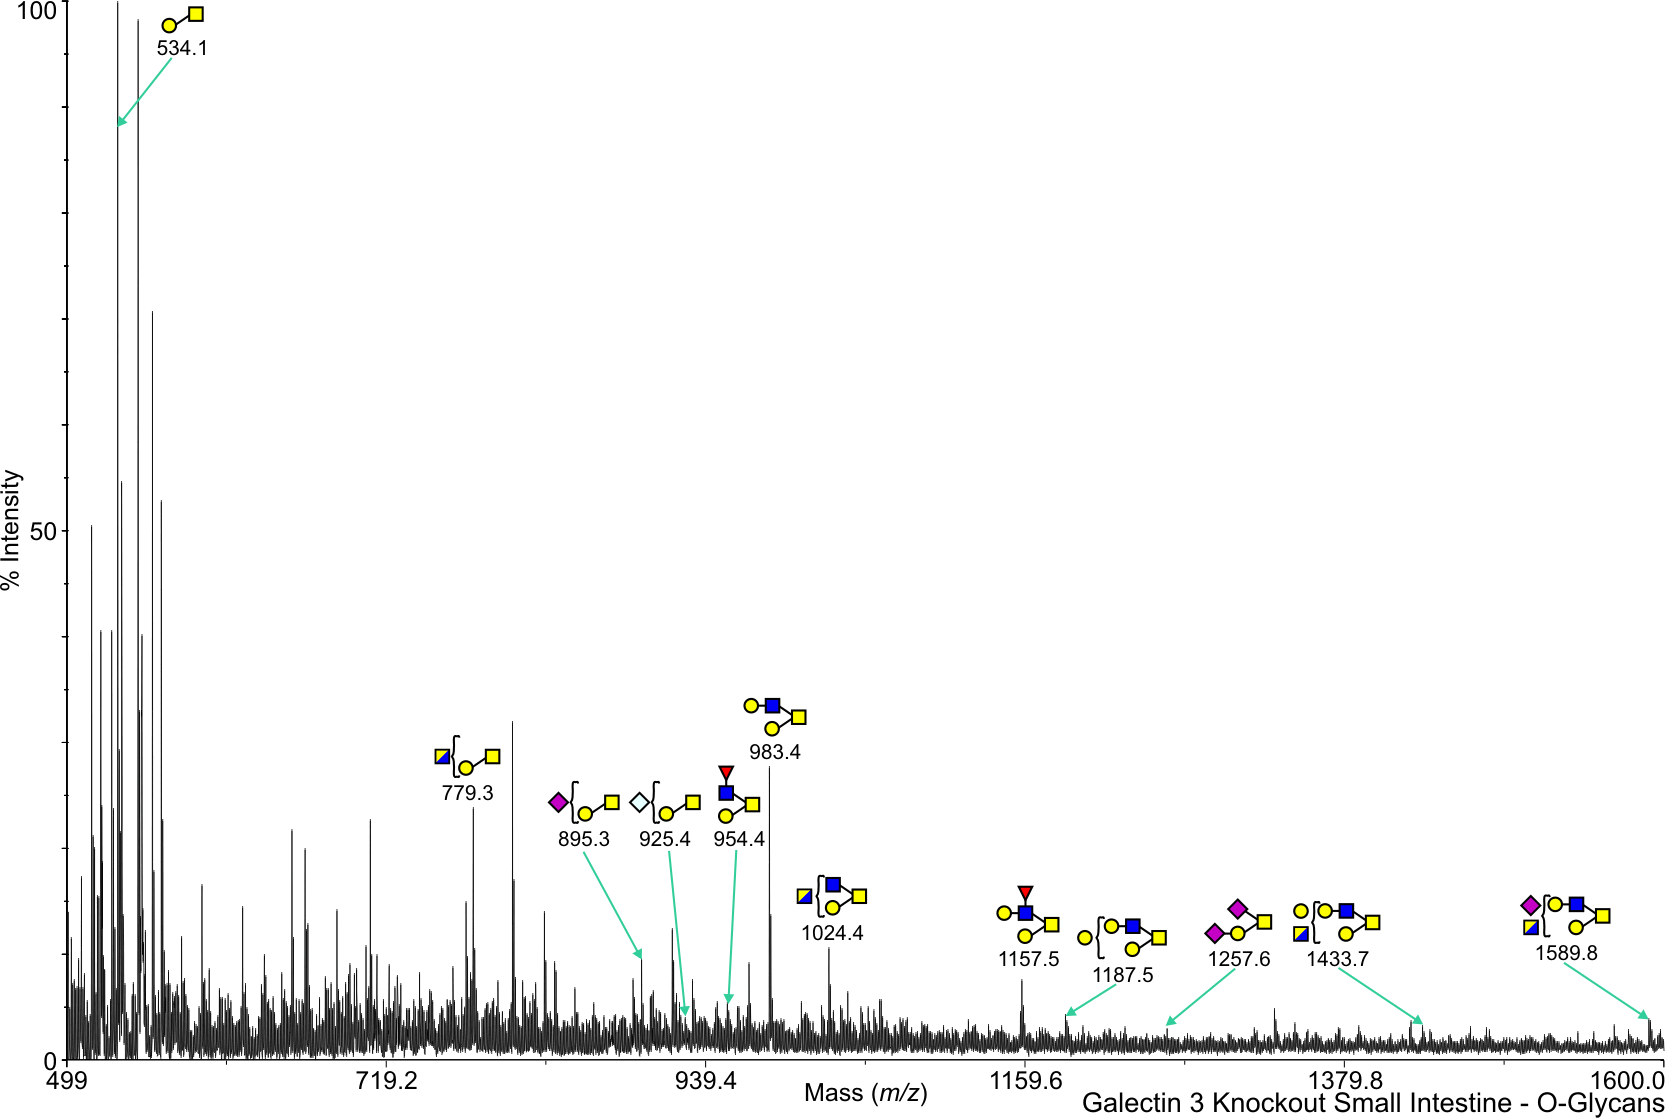
GT Mouse Gal 3 Small Intestine O-Linked C57BL/6 View experimental details      
Annotated file in JPG format Annotated file in PDF format
View Mass Spectrum data as text View Mass Peak file   Interactive Mass Spectrum Viewer
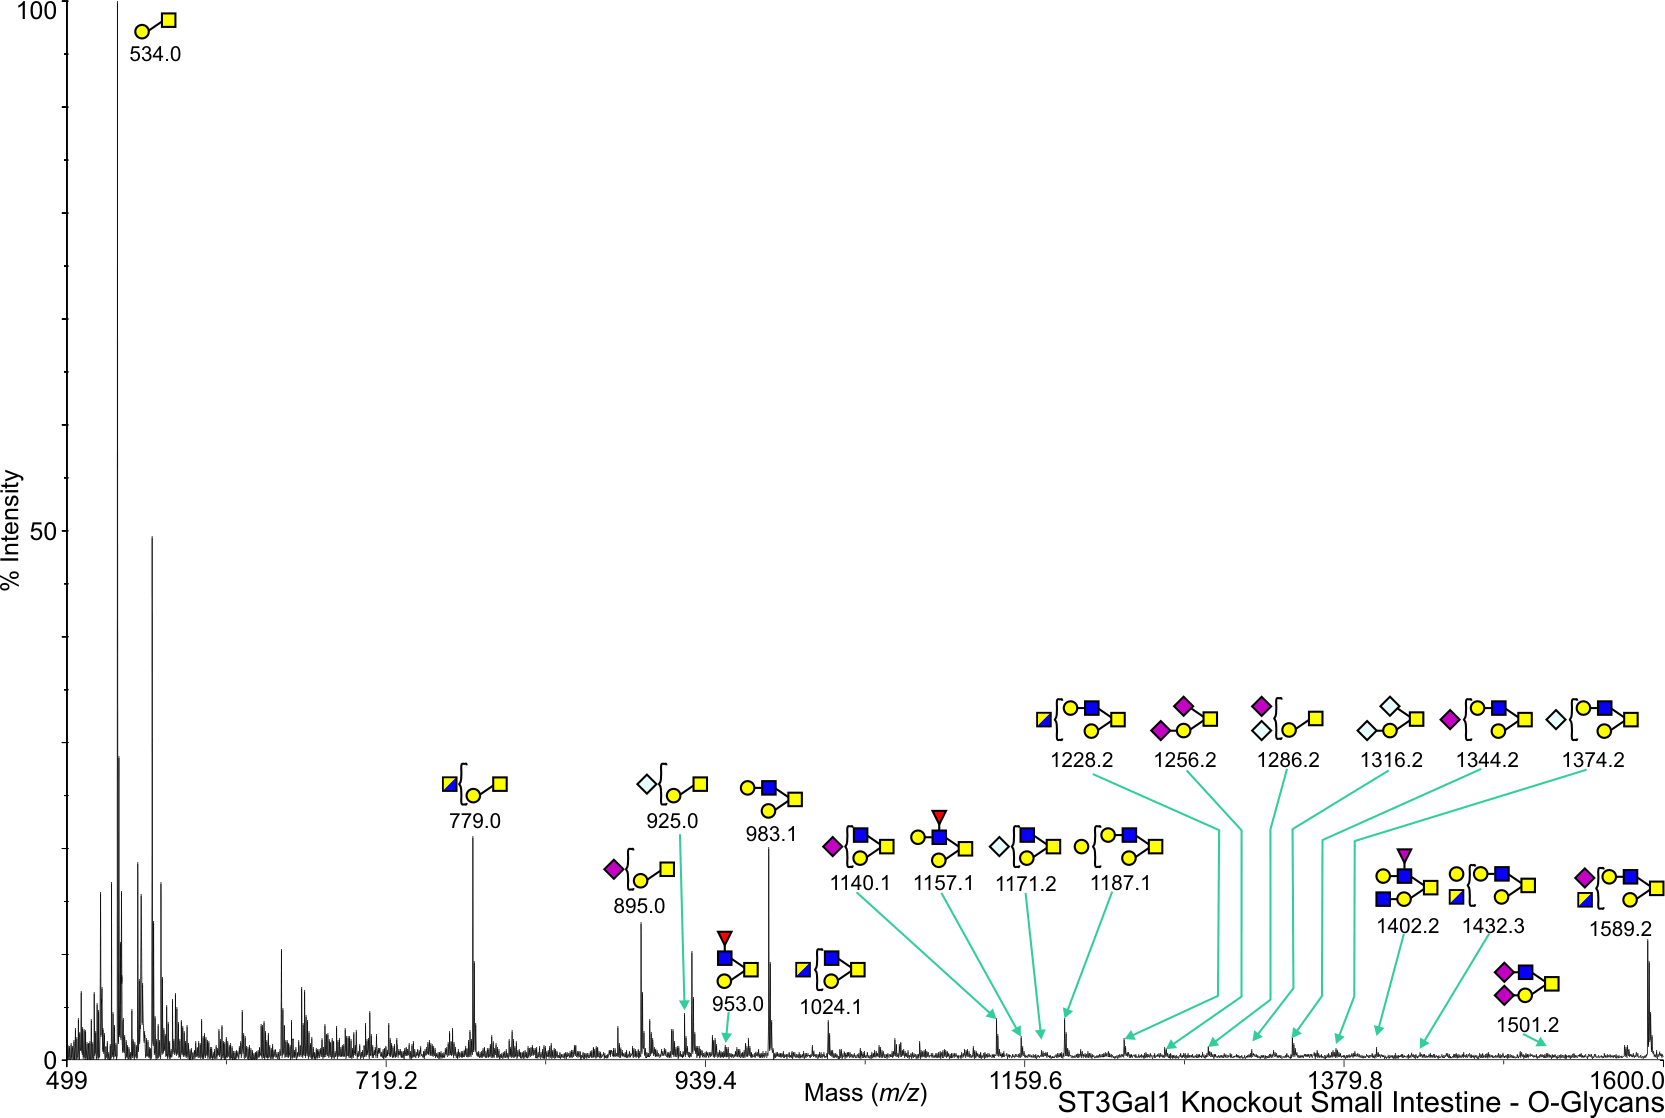
ST Mouse ST3 Gal 1 Small Intestine O-Linked C57BL/6 View experimental details      
Annotated file in JPG format Annotated file in PDF format
View Mass Spectrum data as text View Mass Peak file   Interactive Mass Spectrum Viewer
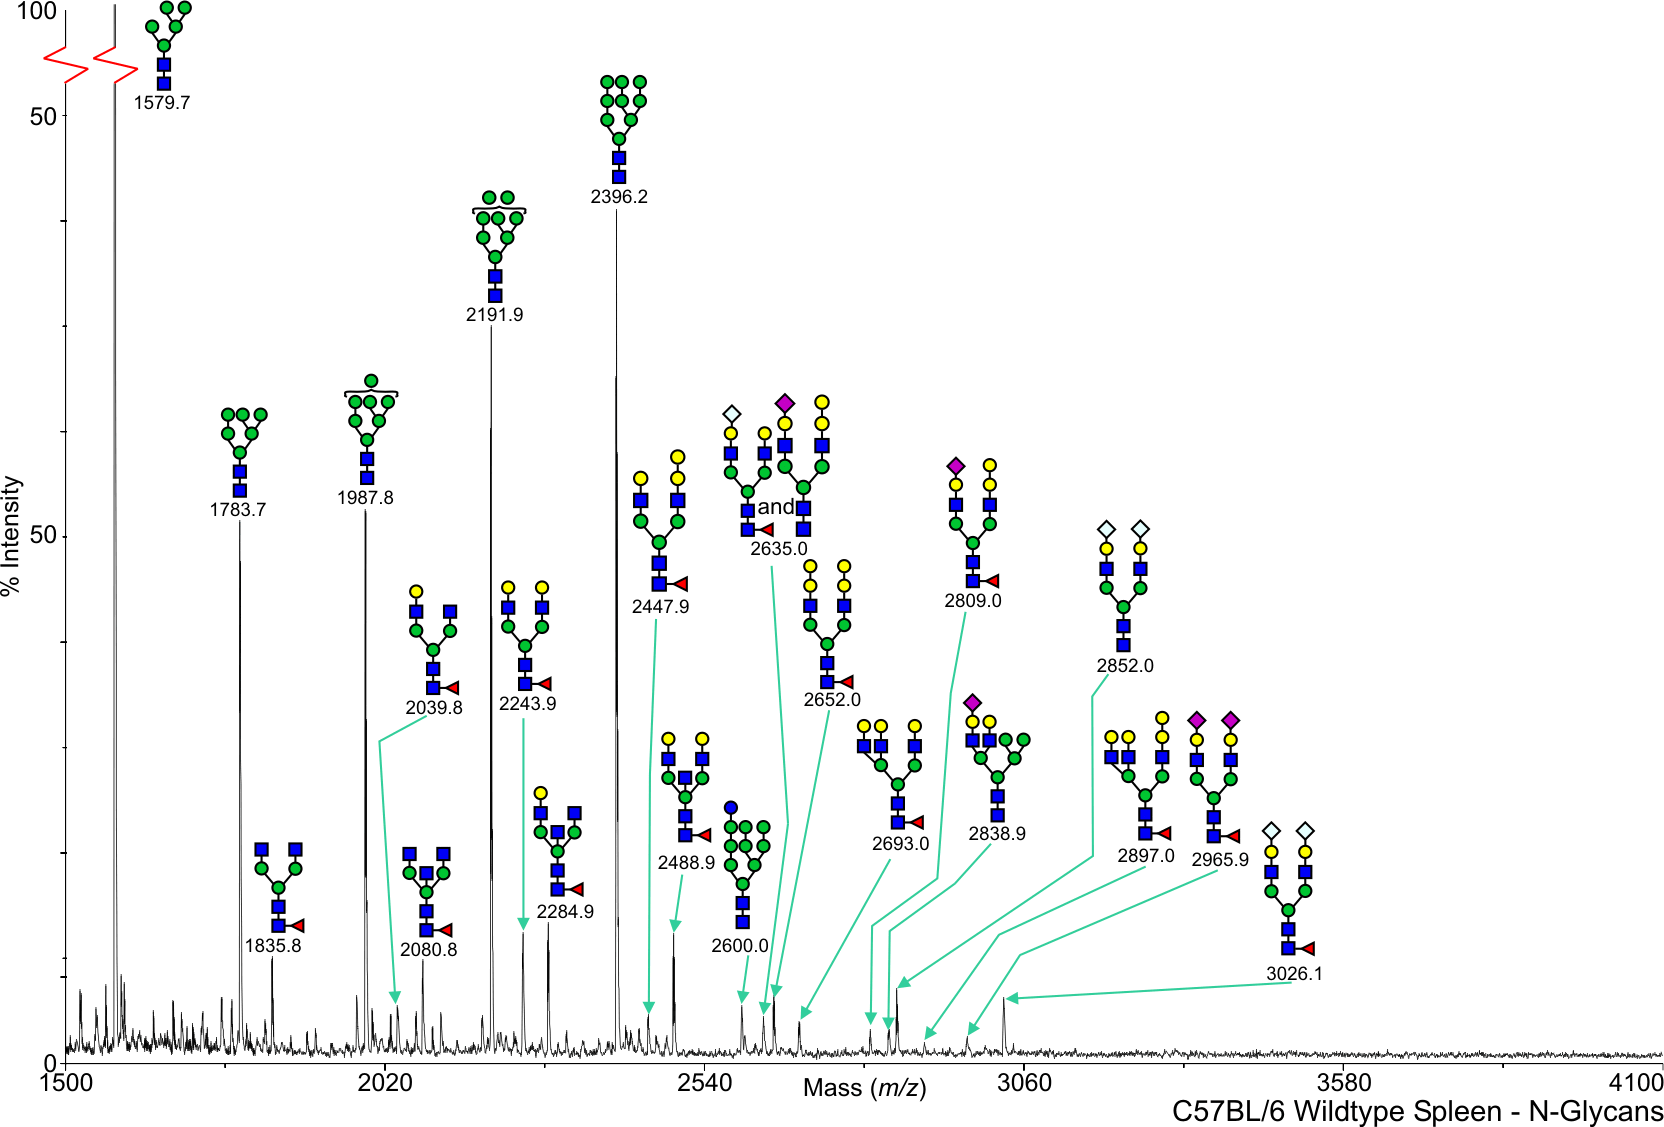
Mouse Wild Type Spleen N-Linked C57BL/6 View experimental details      
Annotated file in JPG format Annotated file in PDF format
View Mass Spectrum data as text View Mass Peak file   Interactive Mass Spectrum Viewer
FA Mouse Fuct IV Spleen N-Linked C57BL/6 View experimental details      
Annotated file in JPG format Annotated file in PDF format
View Mass Spectrum data as text View Mass Peak file   Interactive Mass Spectrum Viewer
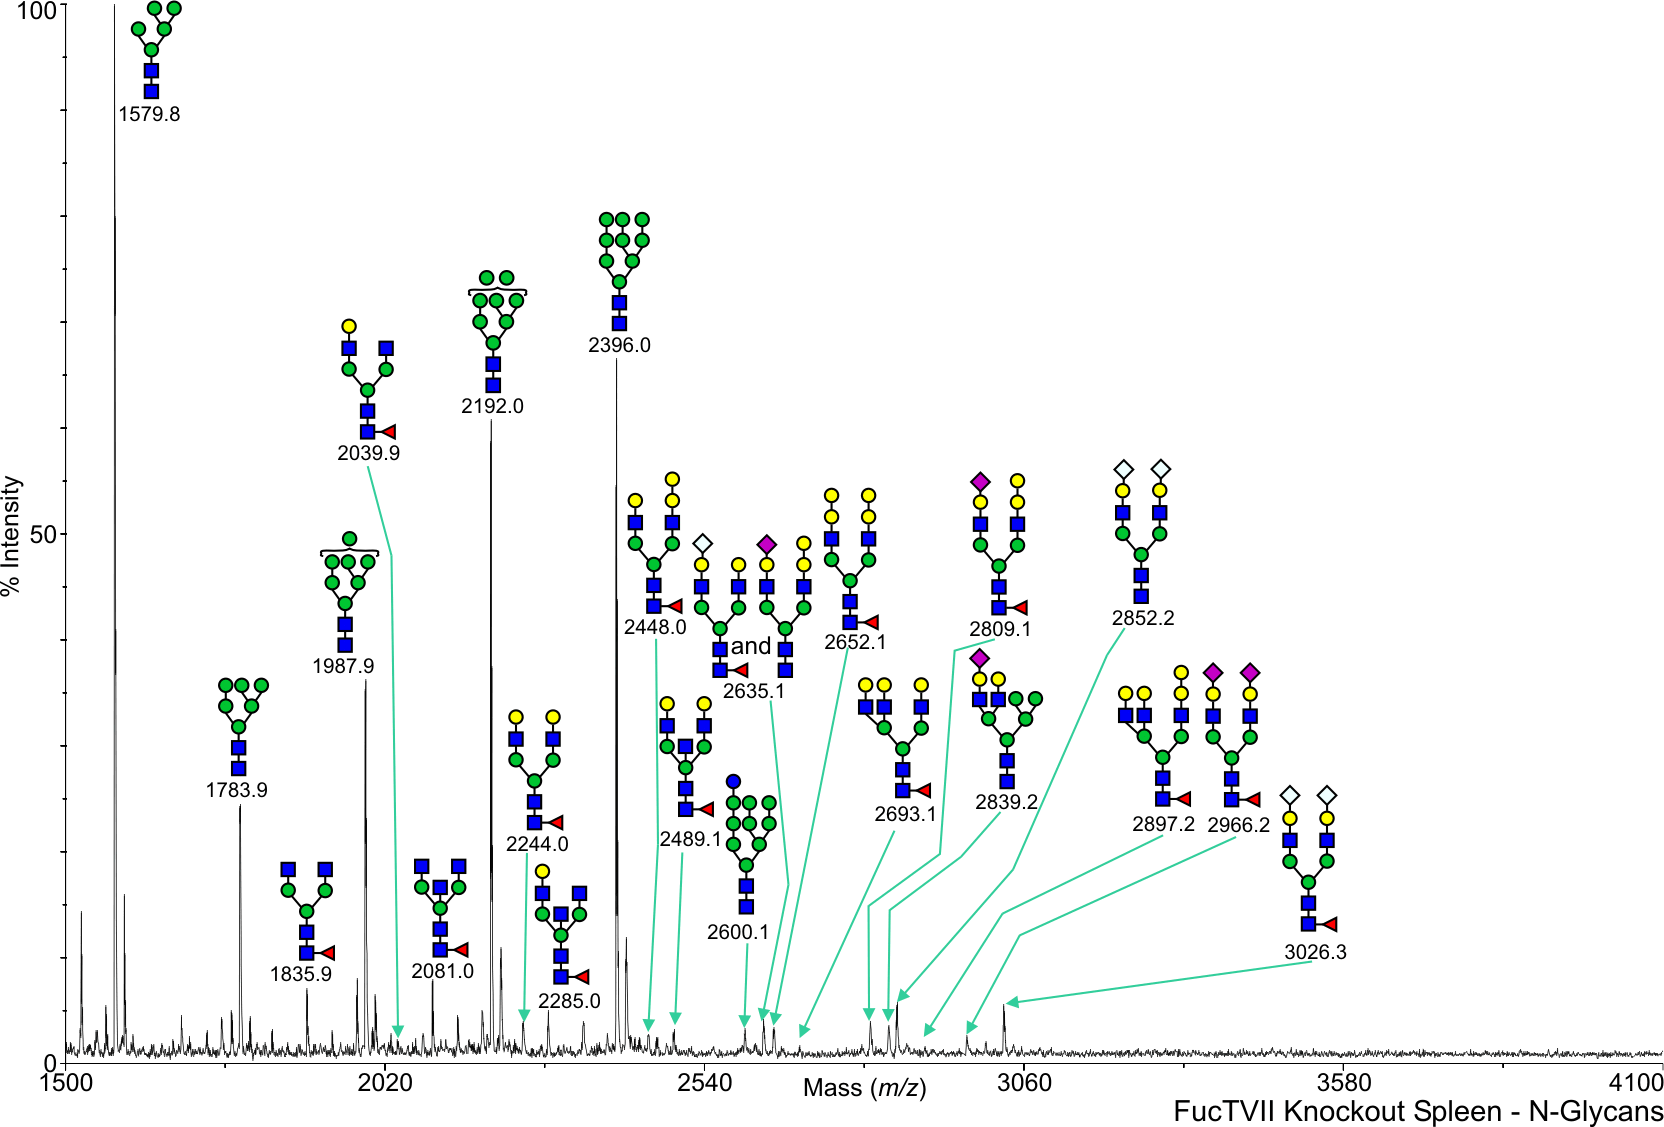
FB Mouse Fuct VII Spleen N-Linked C57BL/6 View experimental details      
Annotated file in JPG format Annotated file in PDF format
View Mass Spectrum data as text View Mass Peak file   Interactive Mass Spectrum Viewer
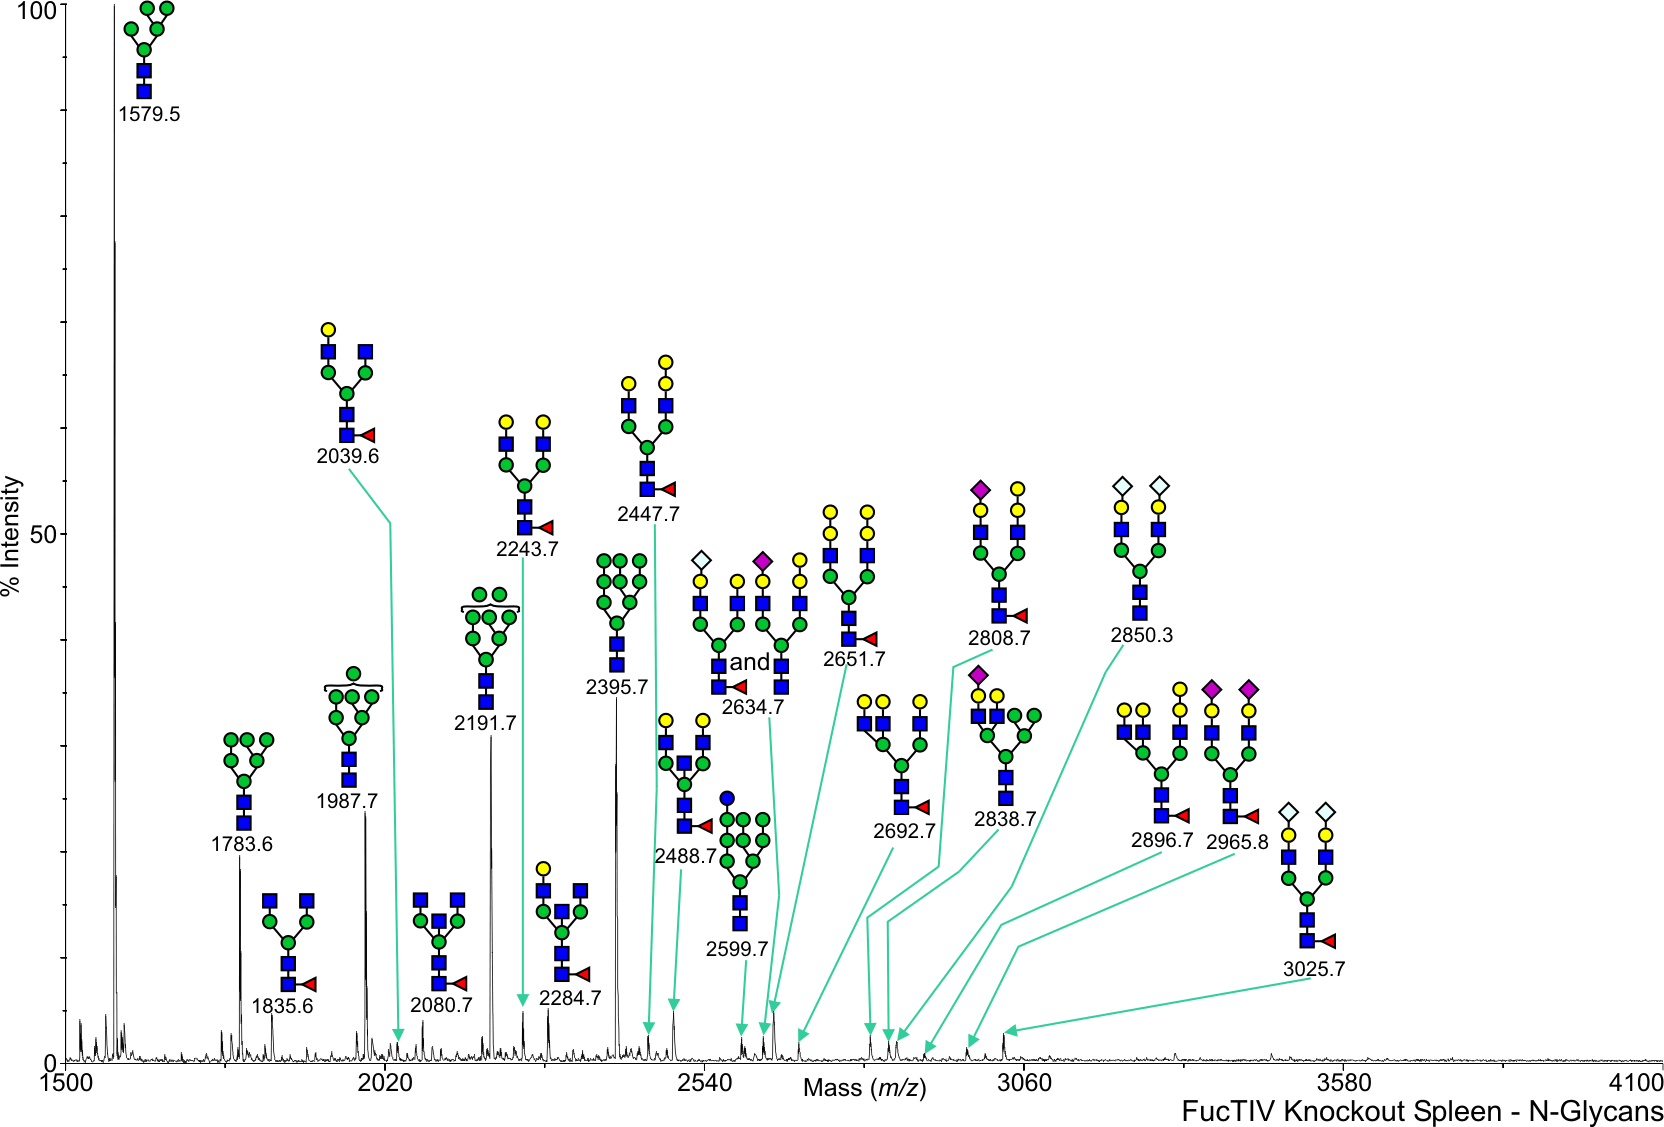
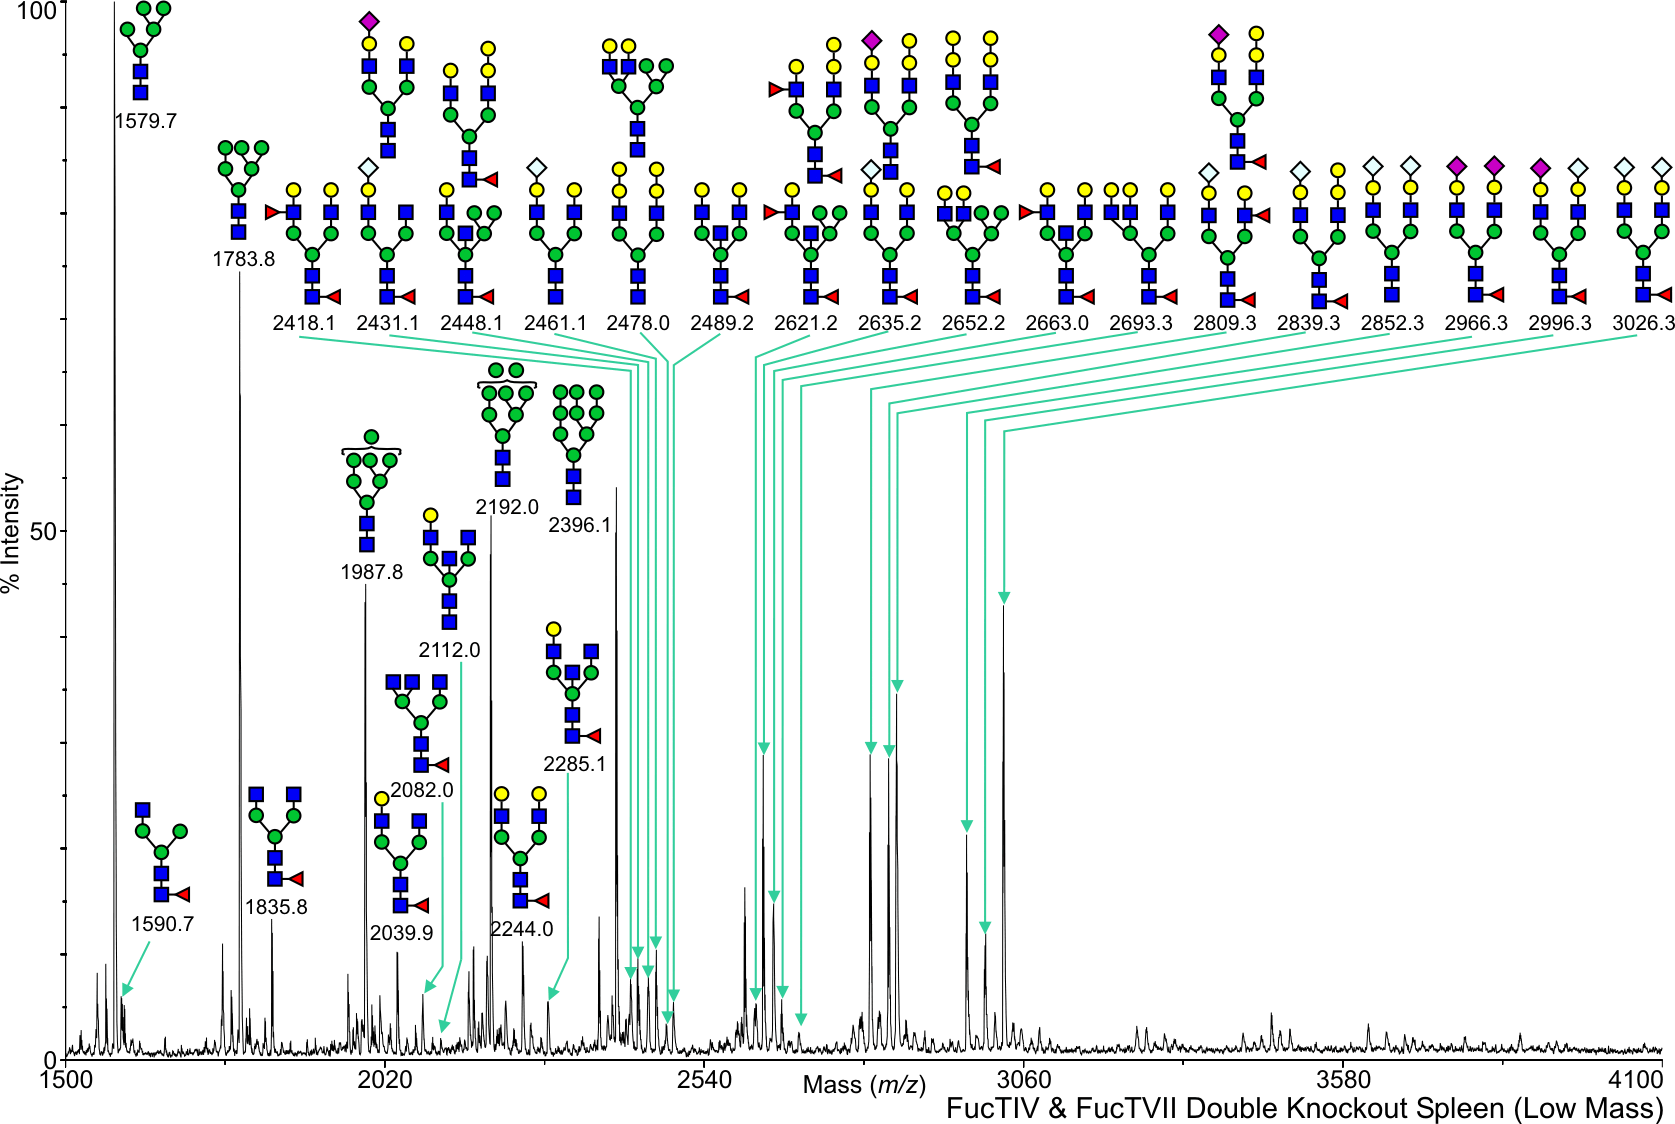
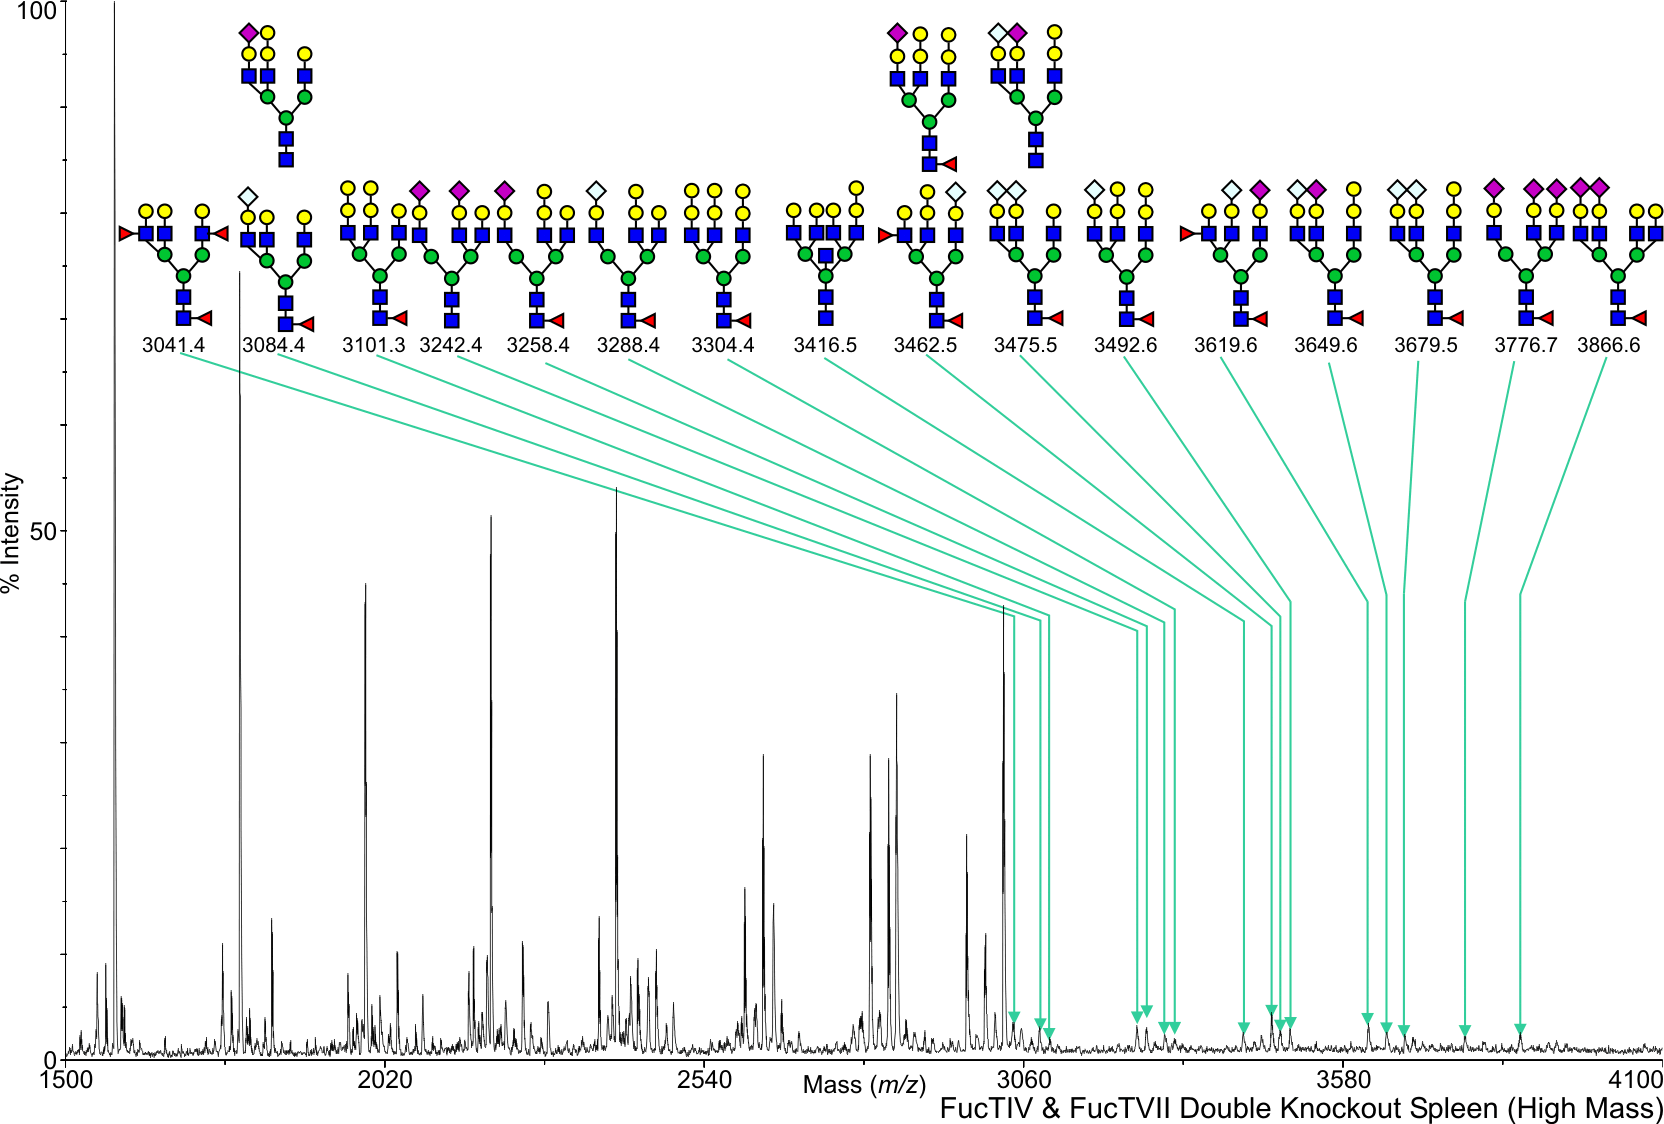
FC Mouse Fuct IV + VII Spleen N-Linked C57BL/6 View experimental details      
Annotated file for lower mass range in JPG formatAnnotated file for higher mass range in JPG format Annotated file for lower mass range in PDF formatAnnotated file for higher mass range in PDF format
View Mass Spectrum data as text View Mass Peak file   Interactive Mass Spectrum Viewer
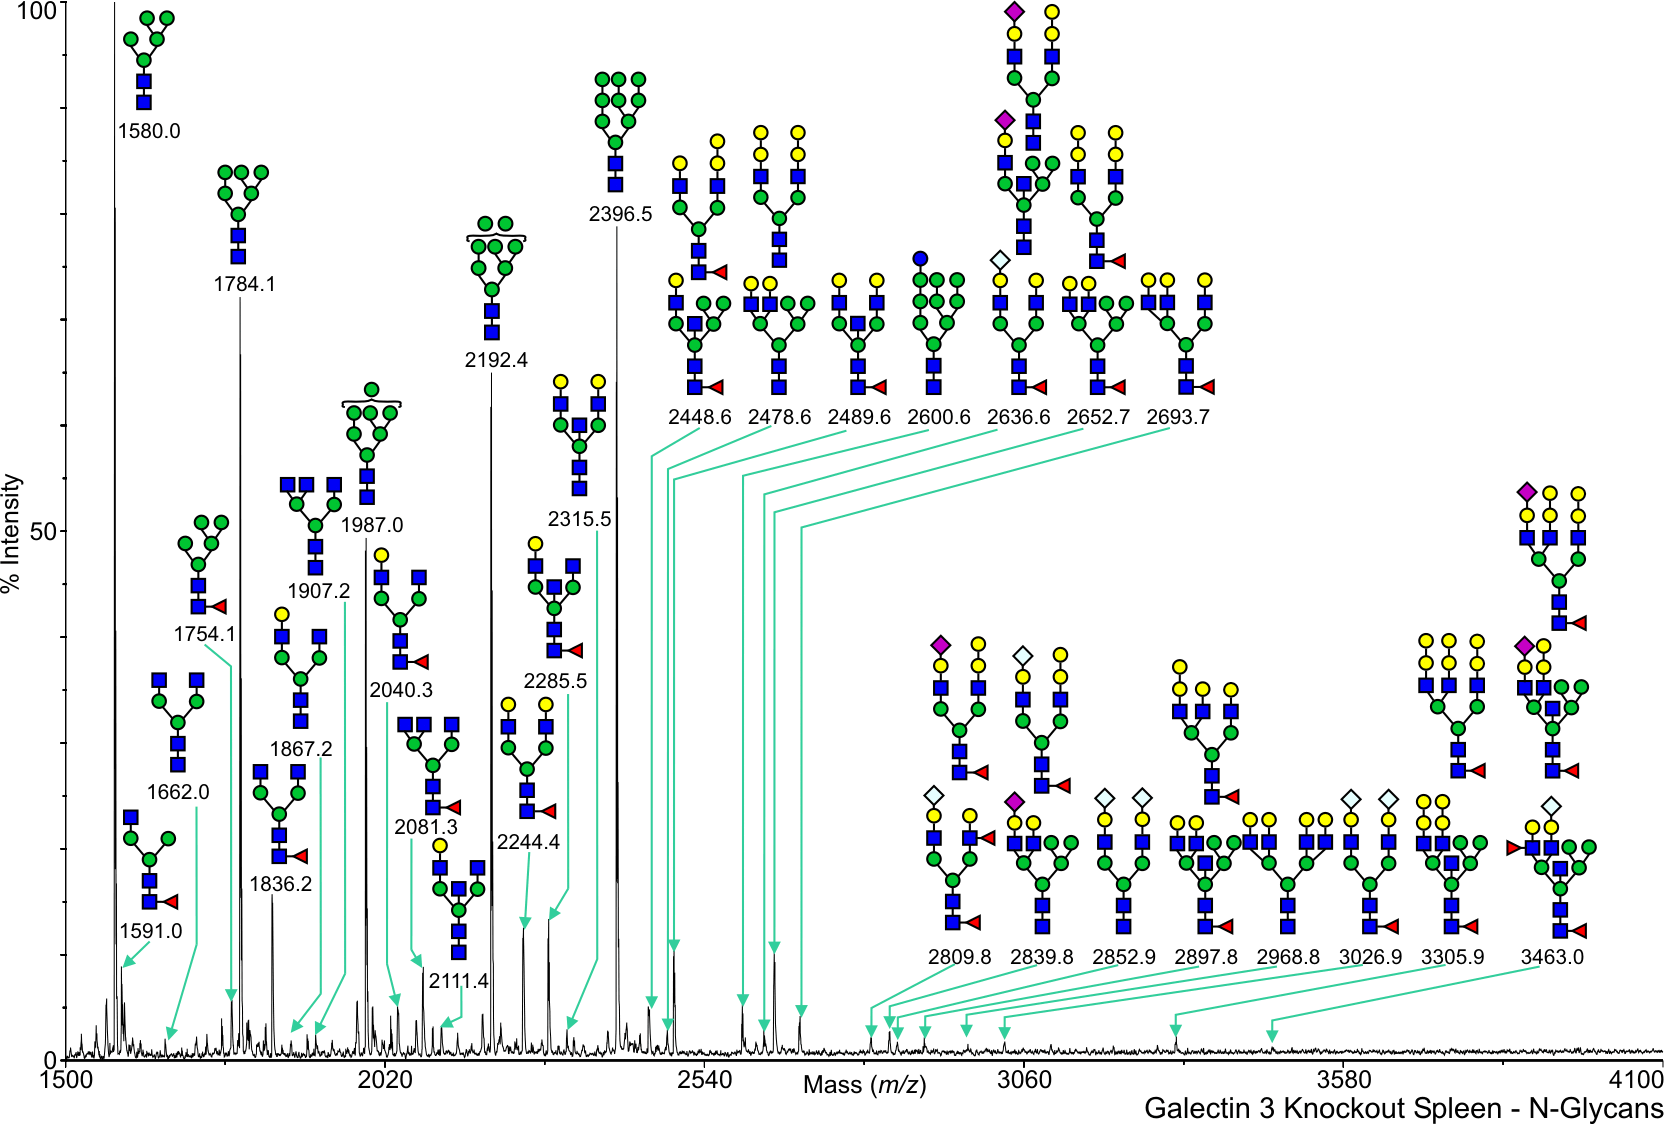
GT Mouse Gal 3 Spleen N-Linked C57BL/6 View experimental details      
Annotated file in JPG format Annotated file in PDF format
View Mass Spectrum data as text View Mass Peak file   Interactive Mass Spectrum Viewer
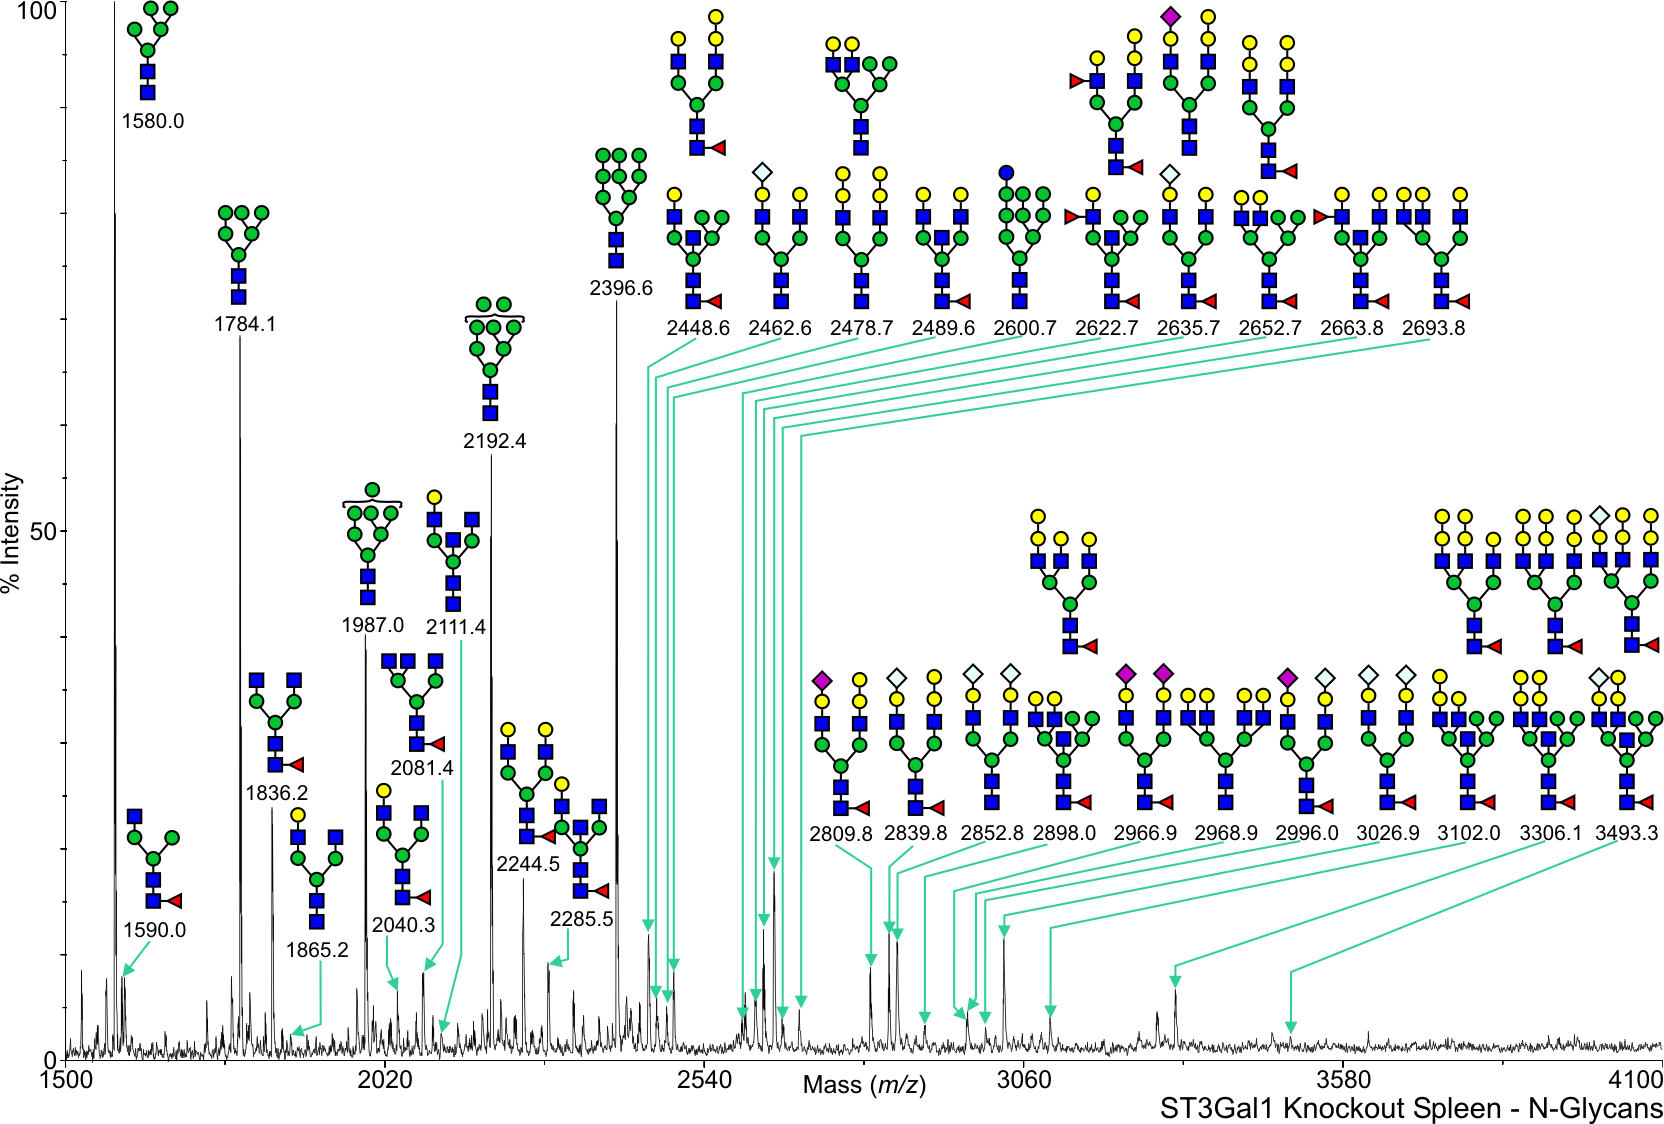
ST Mouse ST3 Gal 1 Spleen N-Linked C57BL/6 View experimental details      
Annotated file in JPG format Annotated file in PDF format
View Mass Spectrum data as text View Mass Peak file   Interactive Mass Spectrum Viewer
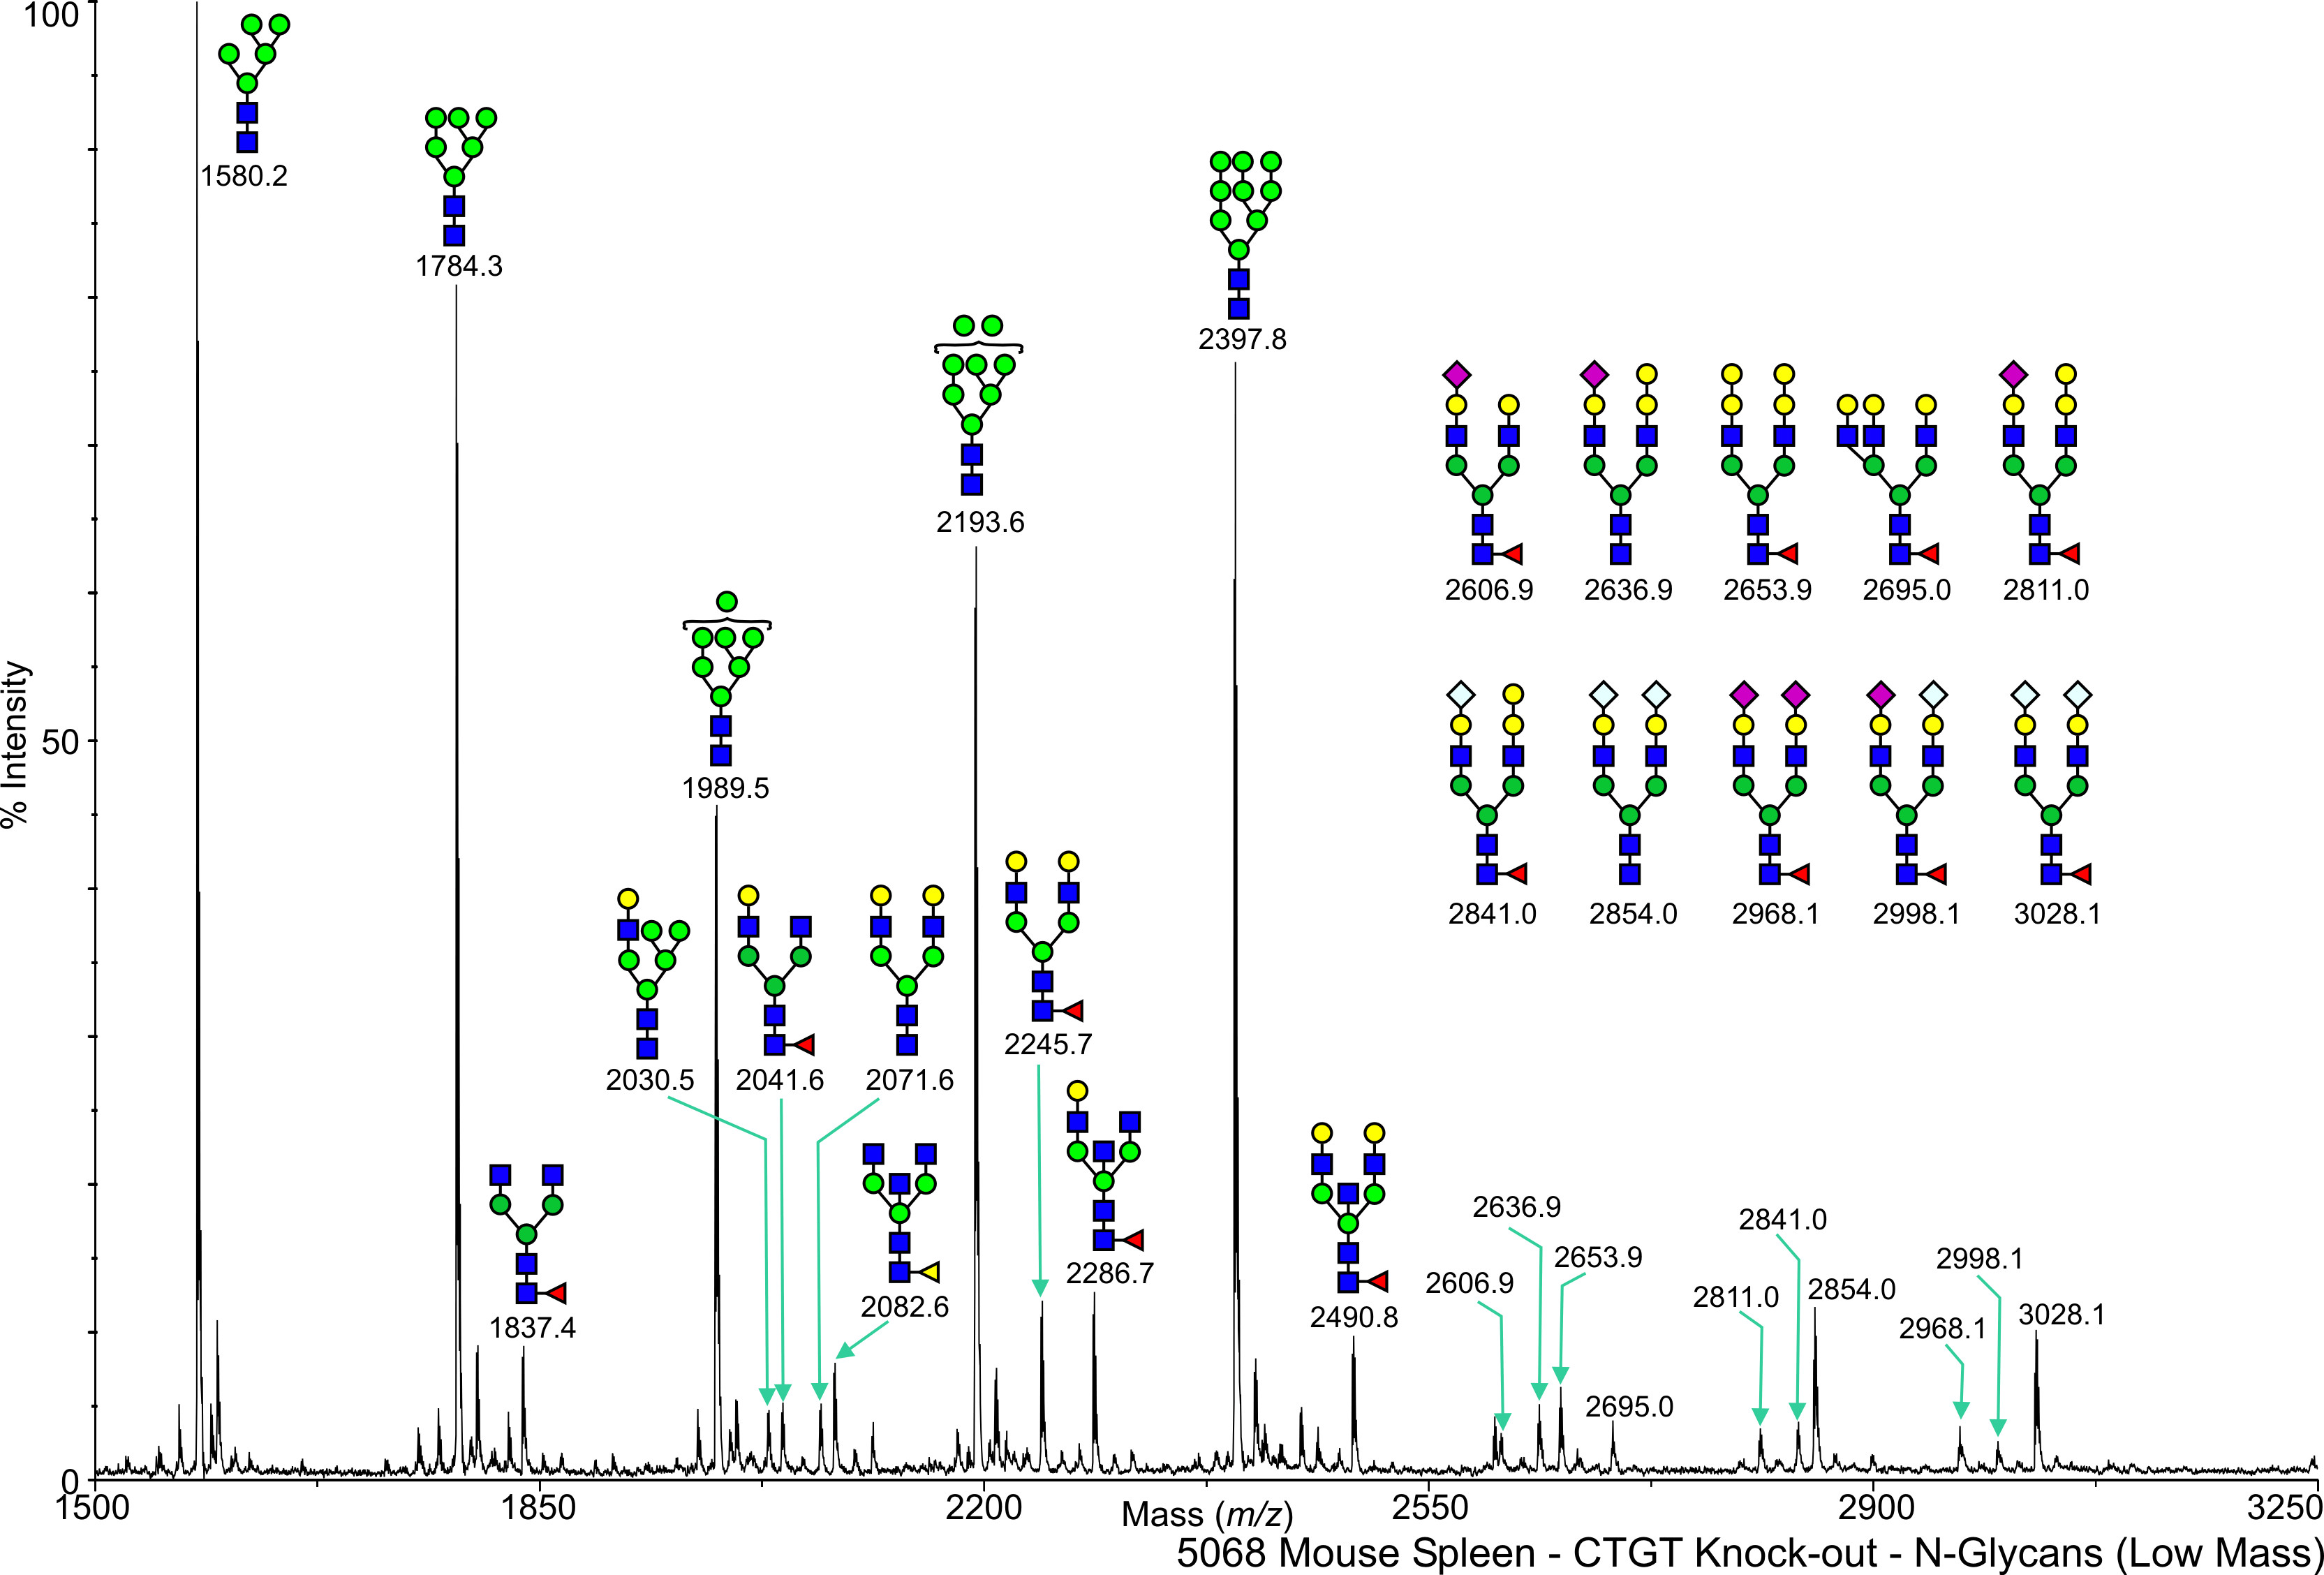
Mouse CT GalNAcT Spleen N-Linked C57BL/6 View experimental details      
Annotated file in JPG format Annotated file in PDF format
View Mass Spectrum data as text View Mass Peak file   Interactive Mass Spectrum Viewer
Mouse Wild Type Spleen O-Linked C57BL/6 View experimental details      
   
View Mass Spectrum data as text      
FA Mouse Fuct IV Spleen O-Linked C57BL/6 View experimental details      
   
View Mass Spectrum data as text      
FC Mouse Fuct IV + VII Spleen O-Linked C57BL/6 View experimental details      
   
View Mass Spectrum data as text      
GT Mouse Gal 3 Spleen O-Linked C57BL/6 View experimental details      
   
View Mass Spectrum data as text      
ST Mouse ST3 Gal 1 Spleen O-Linked C57BL/6 View experimental details      
   
View Mass Spectrum data as text      
Mouse CT GalNAcT Spleen O-Linked C57BL/6 View experimental details      
   
View Mass Spectrum data as text      
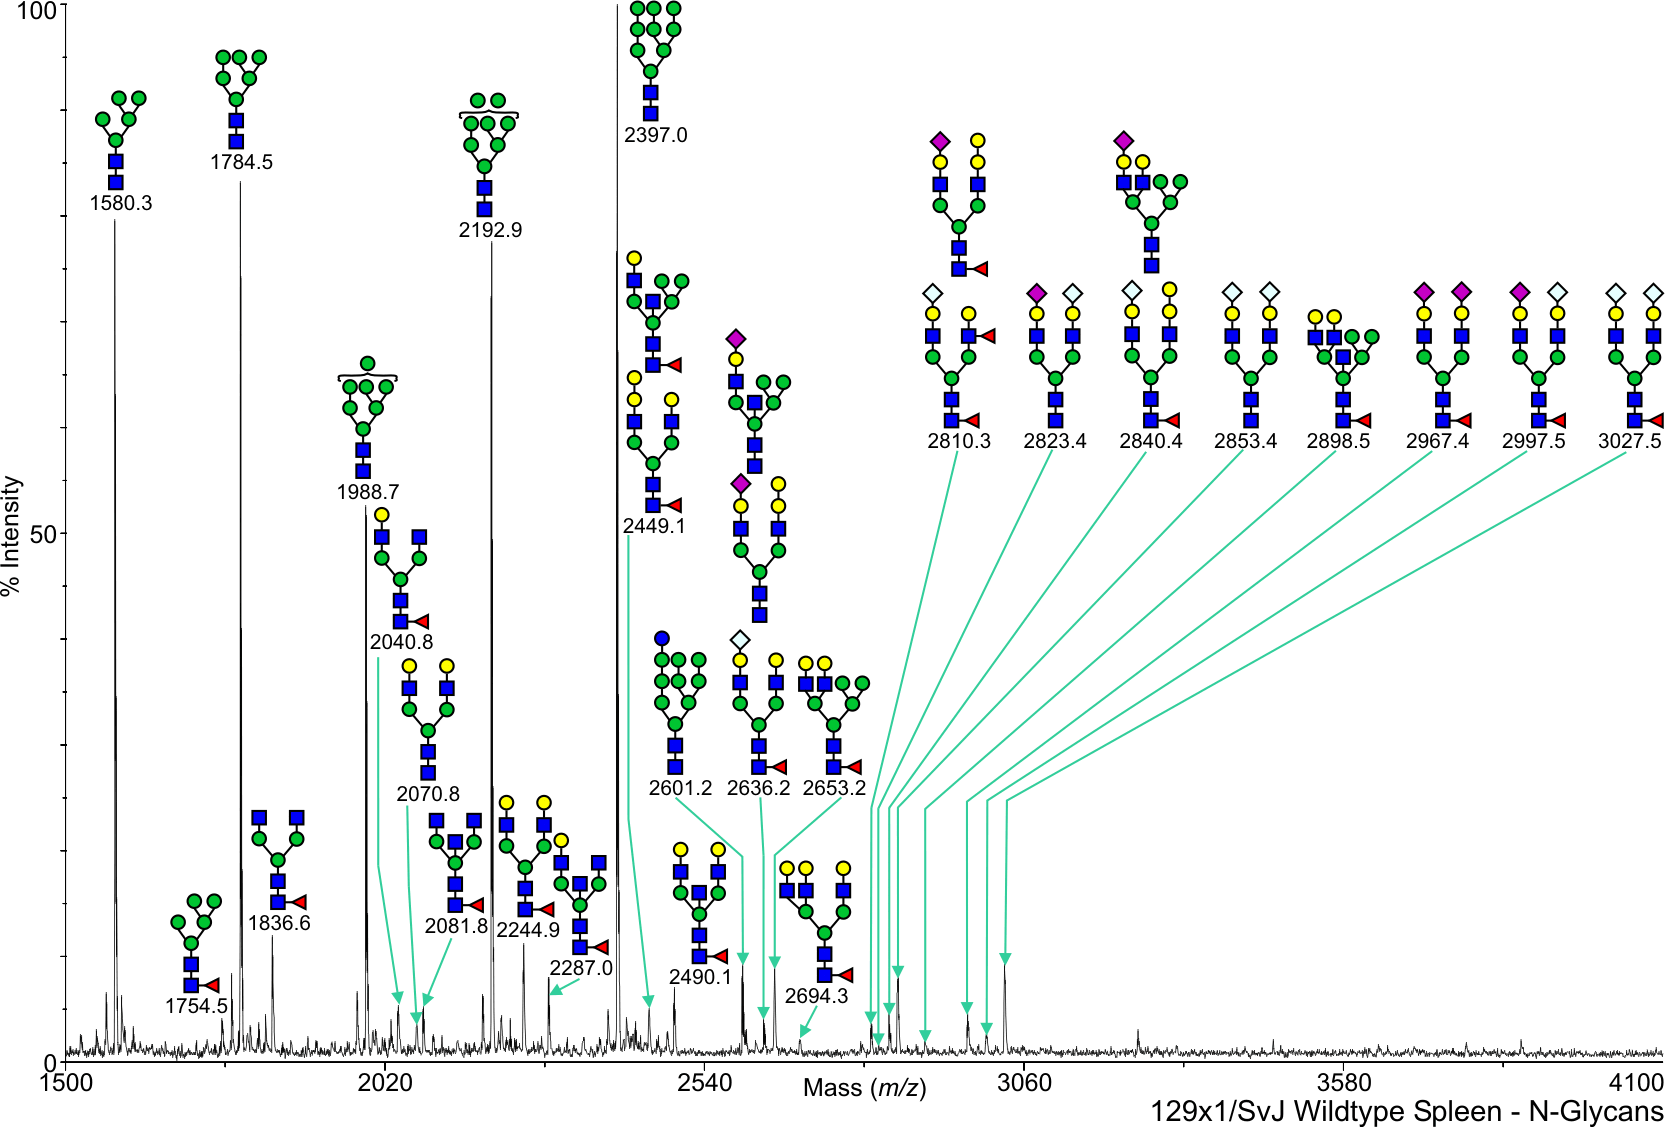
Mouse Wild Type Spleen N-Linked 129x1SvJ View experimental details      
Annotated file in JPG format Annotated file in PDF format
View Mass Spectrum data as text View Mass Peak file   Interactive Mass Spectrum Viewer
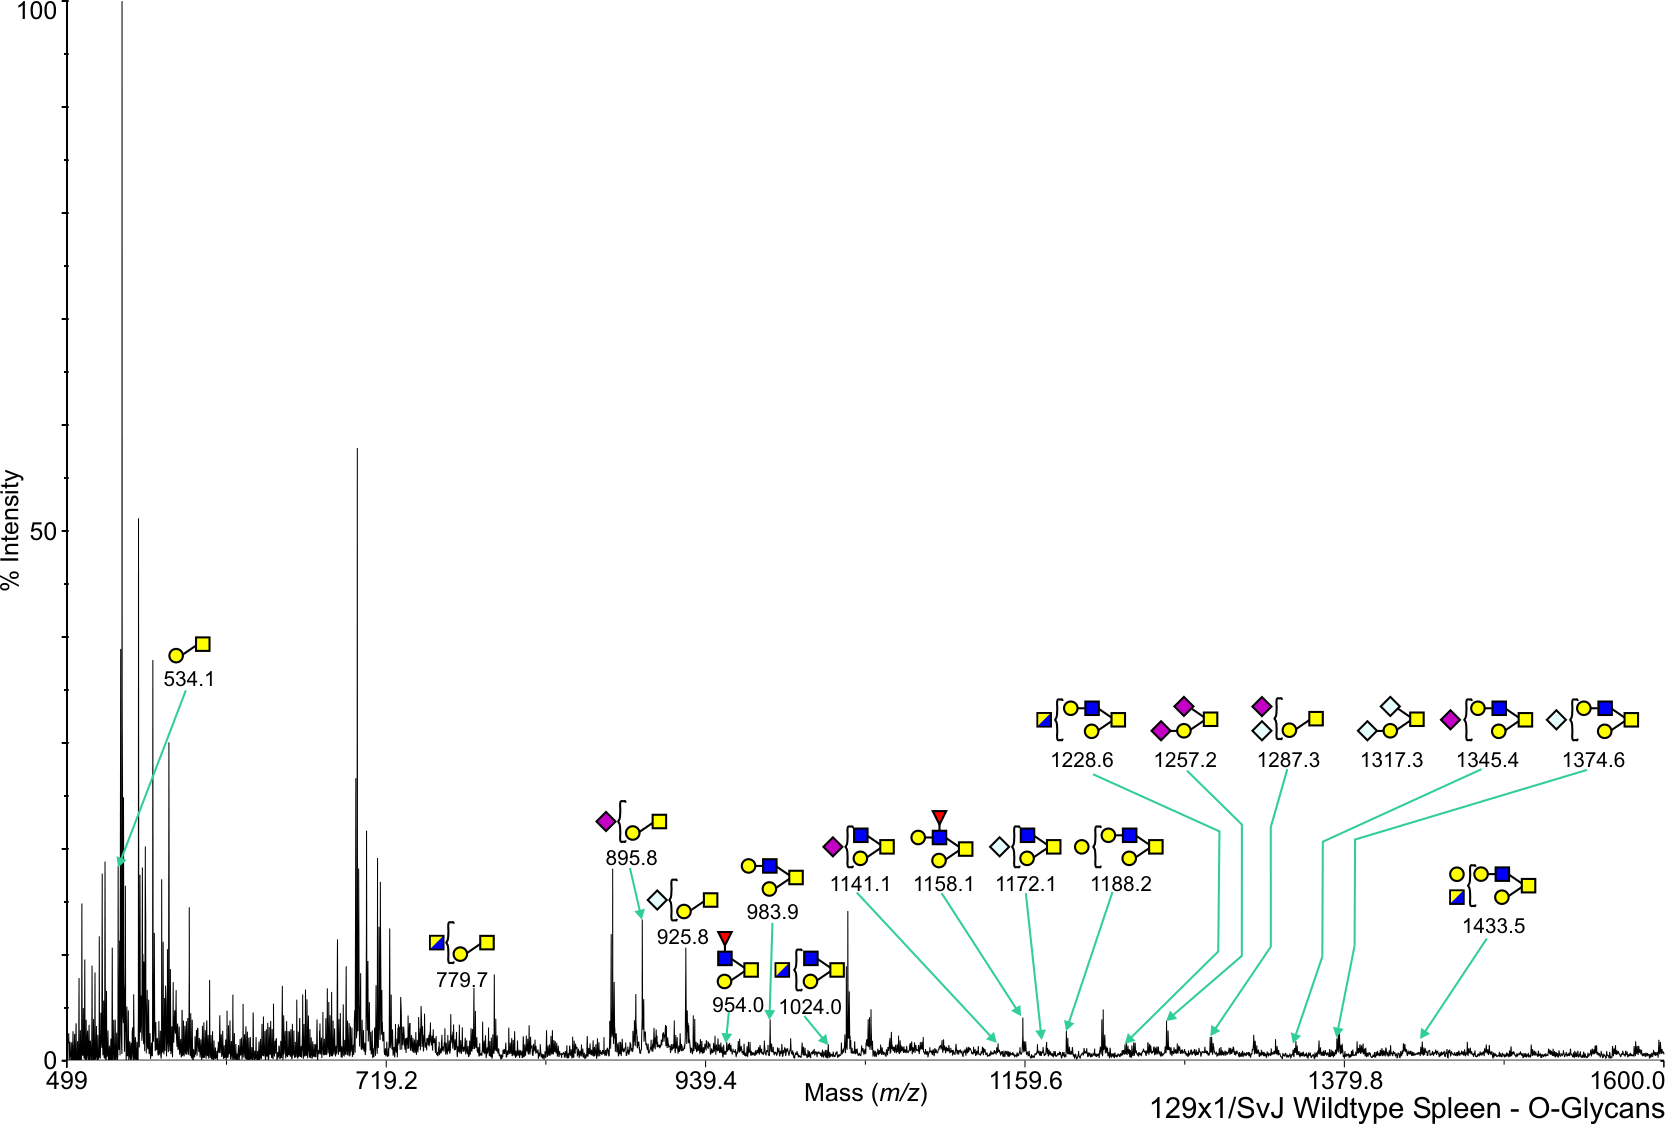
Mouse Wild Type Spleen O-Linked 129x1SvJ View experimental details      
Annotated file in JPG format Annotated file in PDF format
View Mass Spectrum data as text View Mass Peak file   Interactive Mass Spectrum Viewer
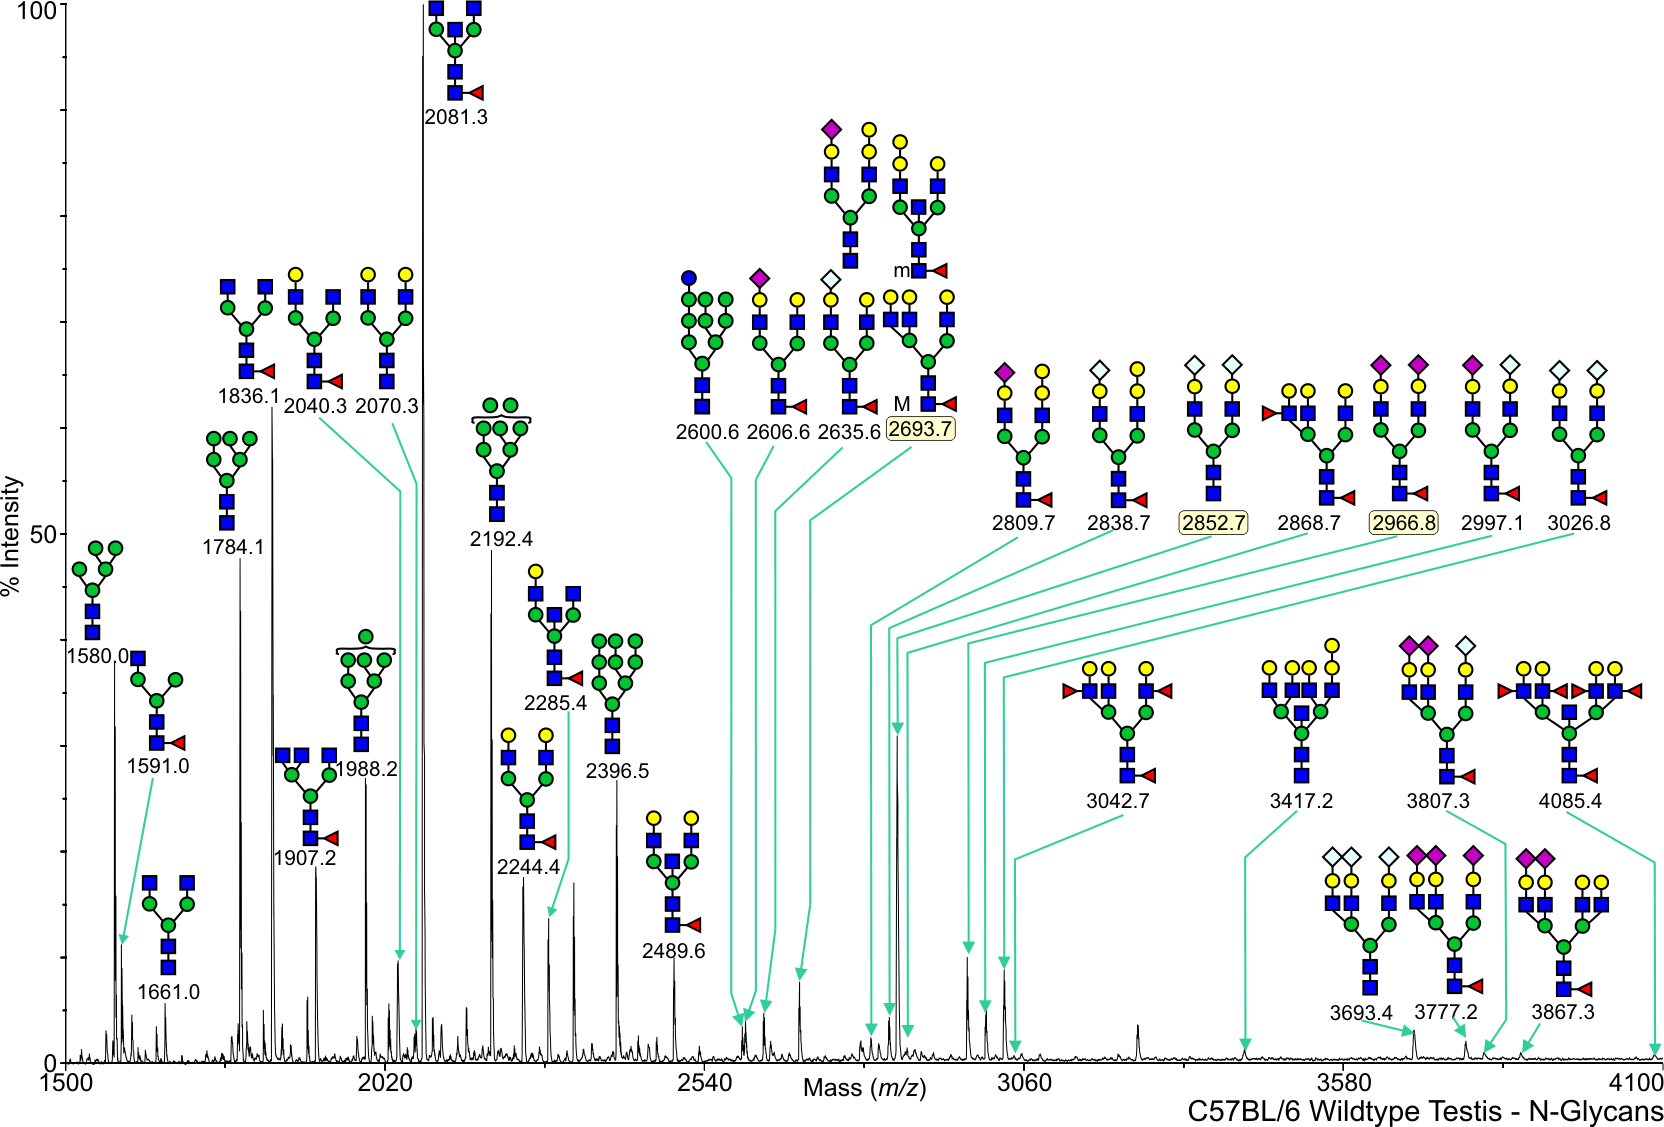
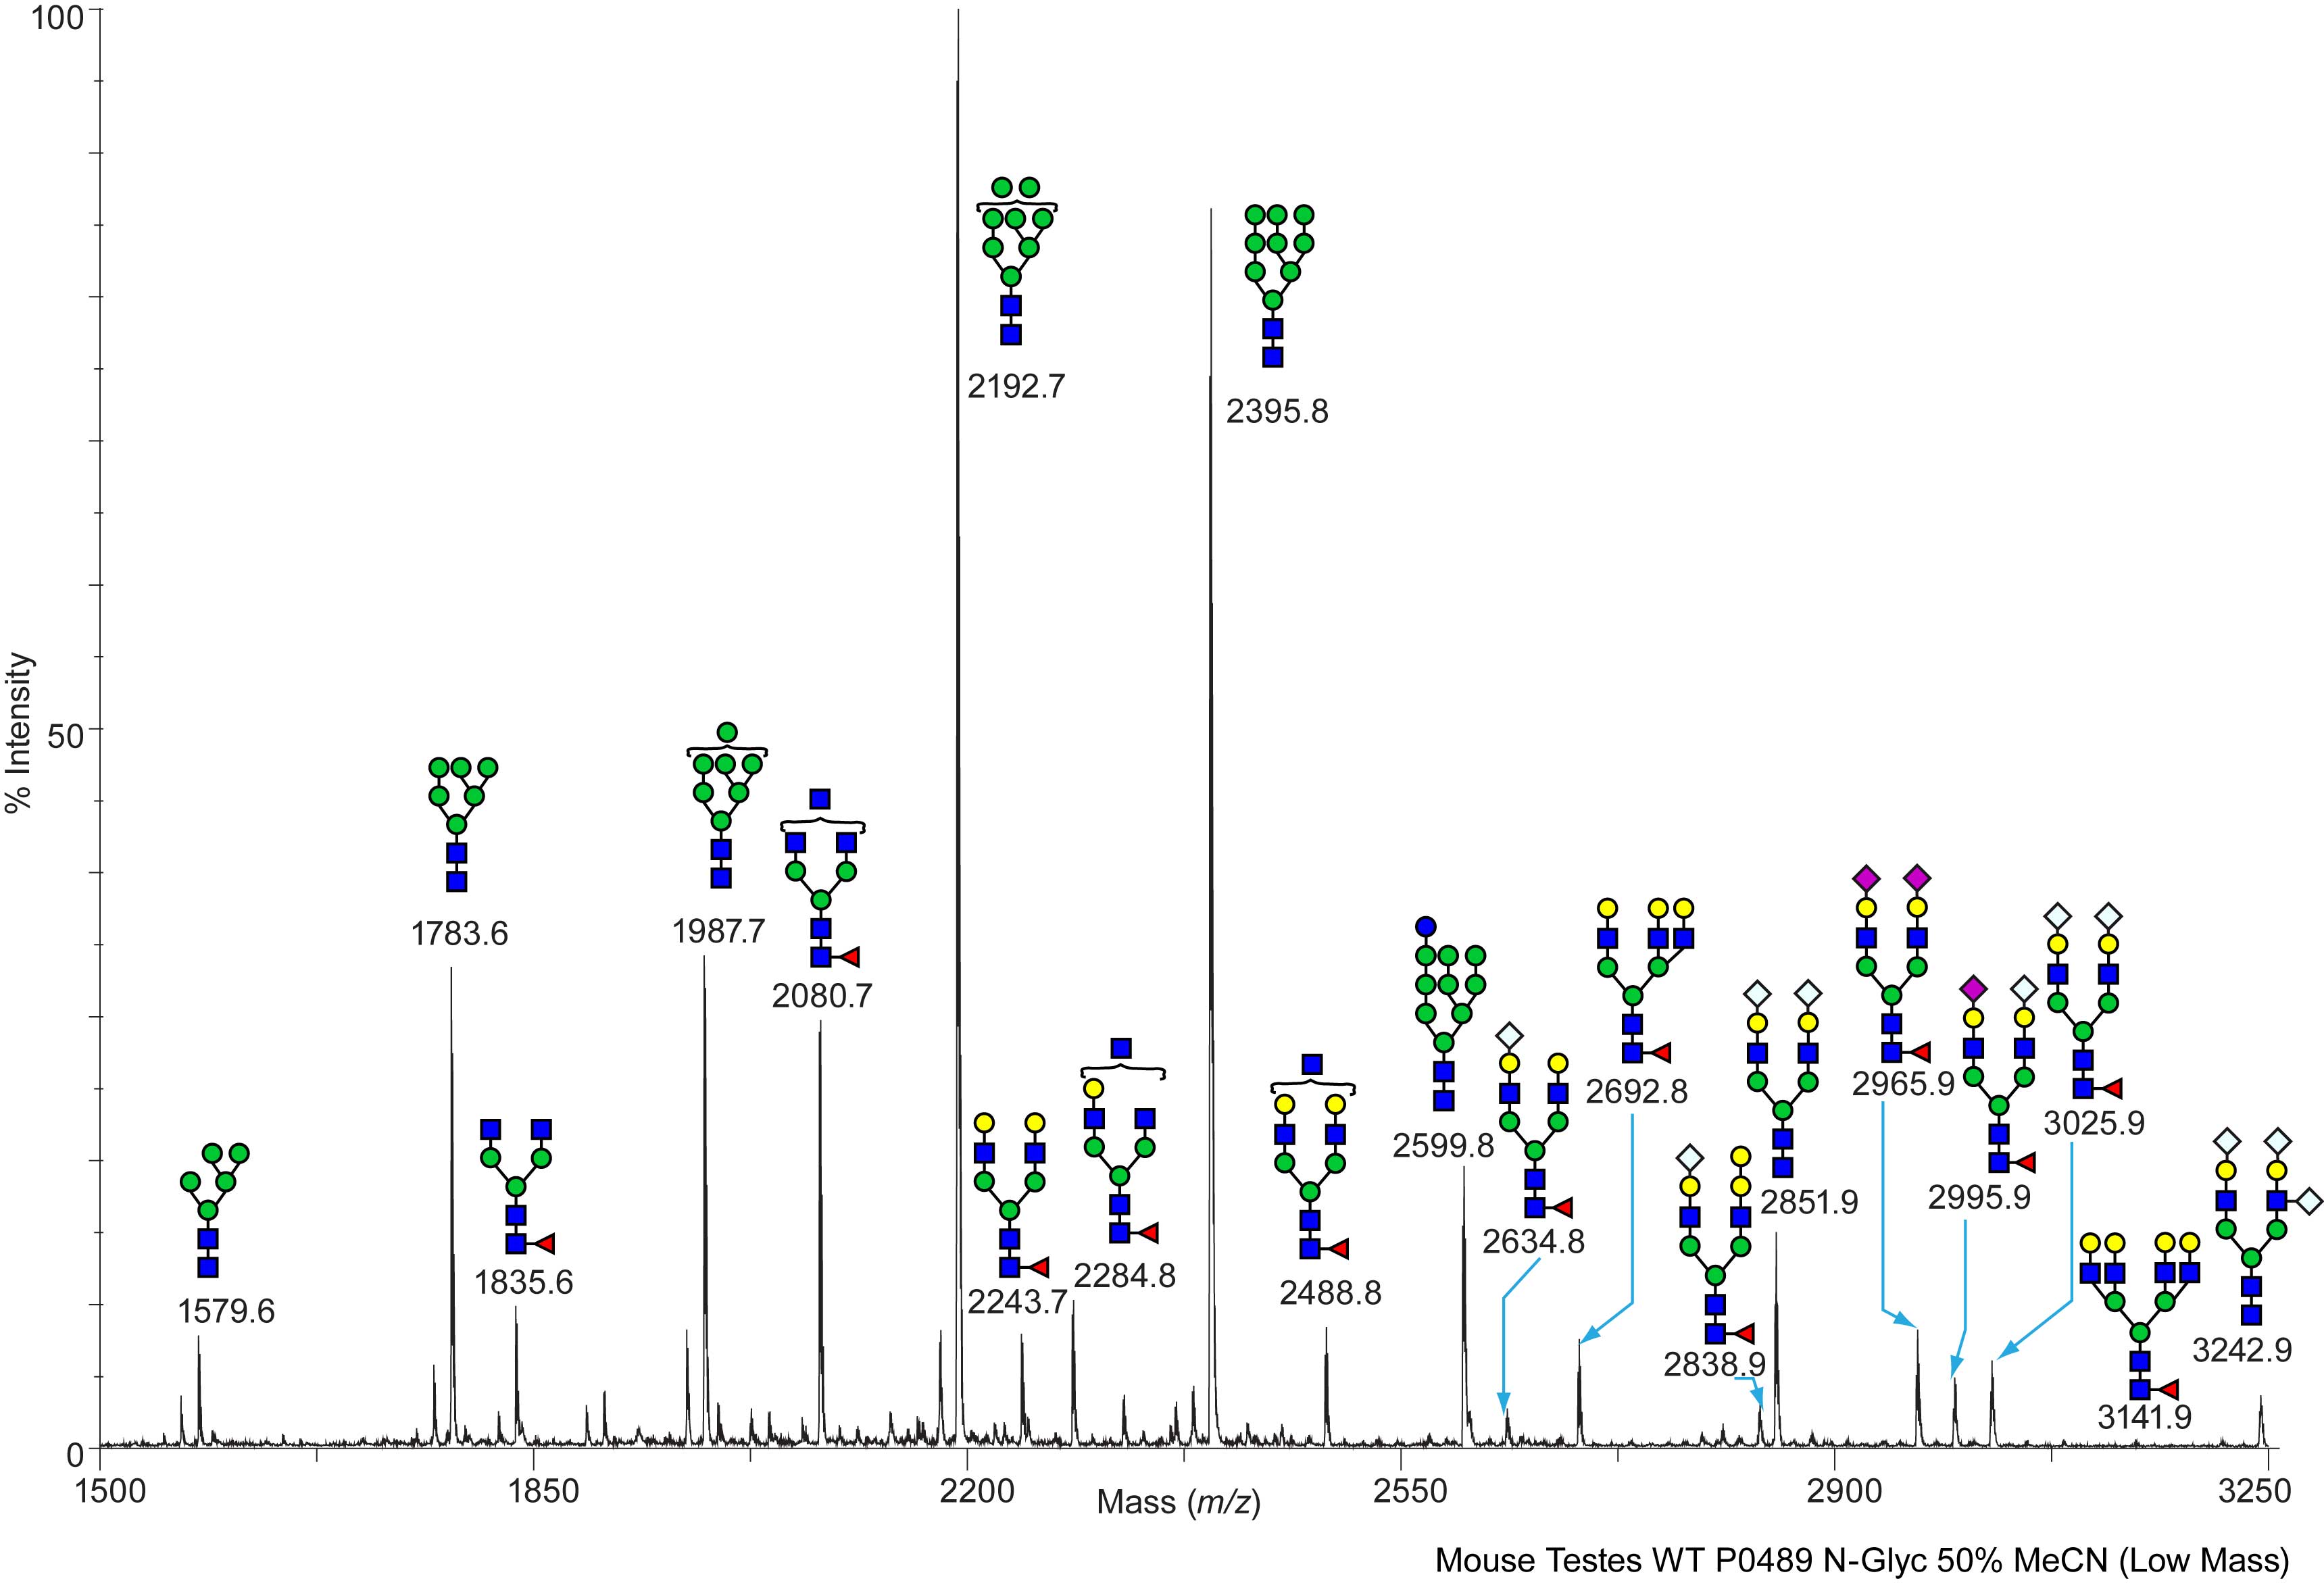
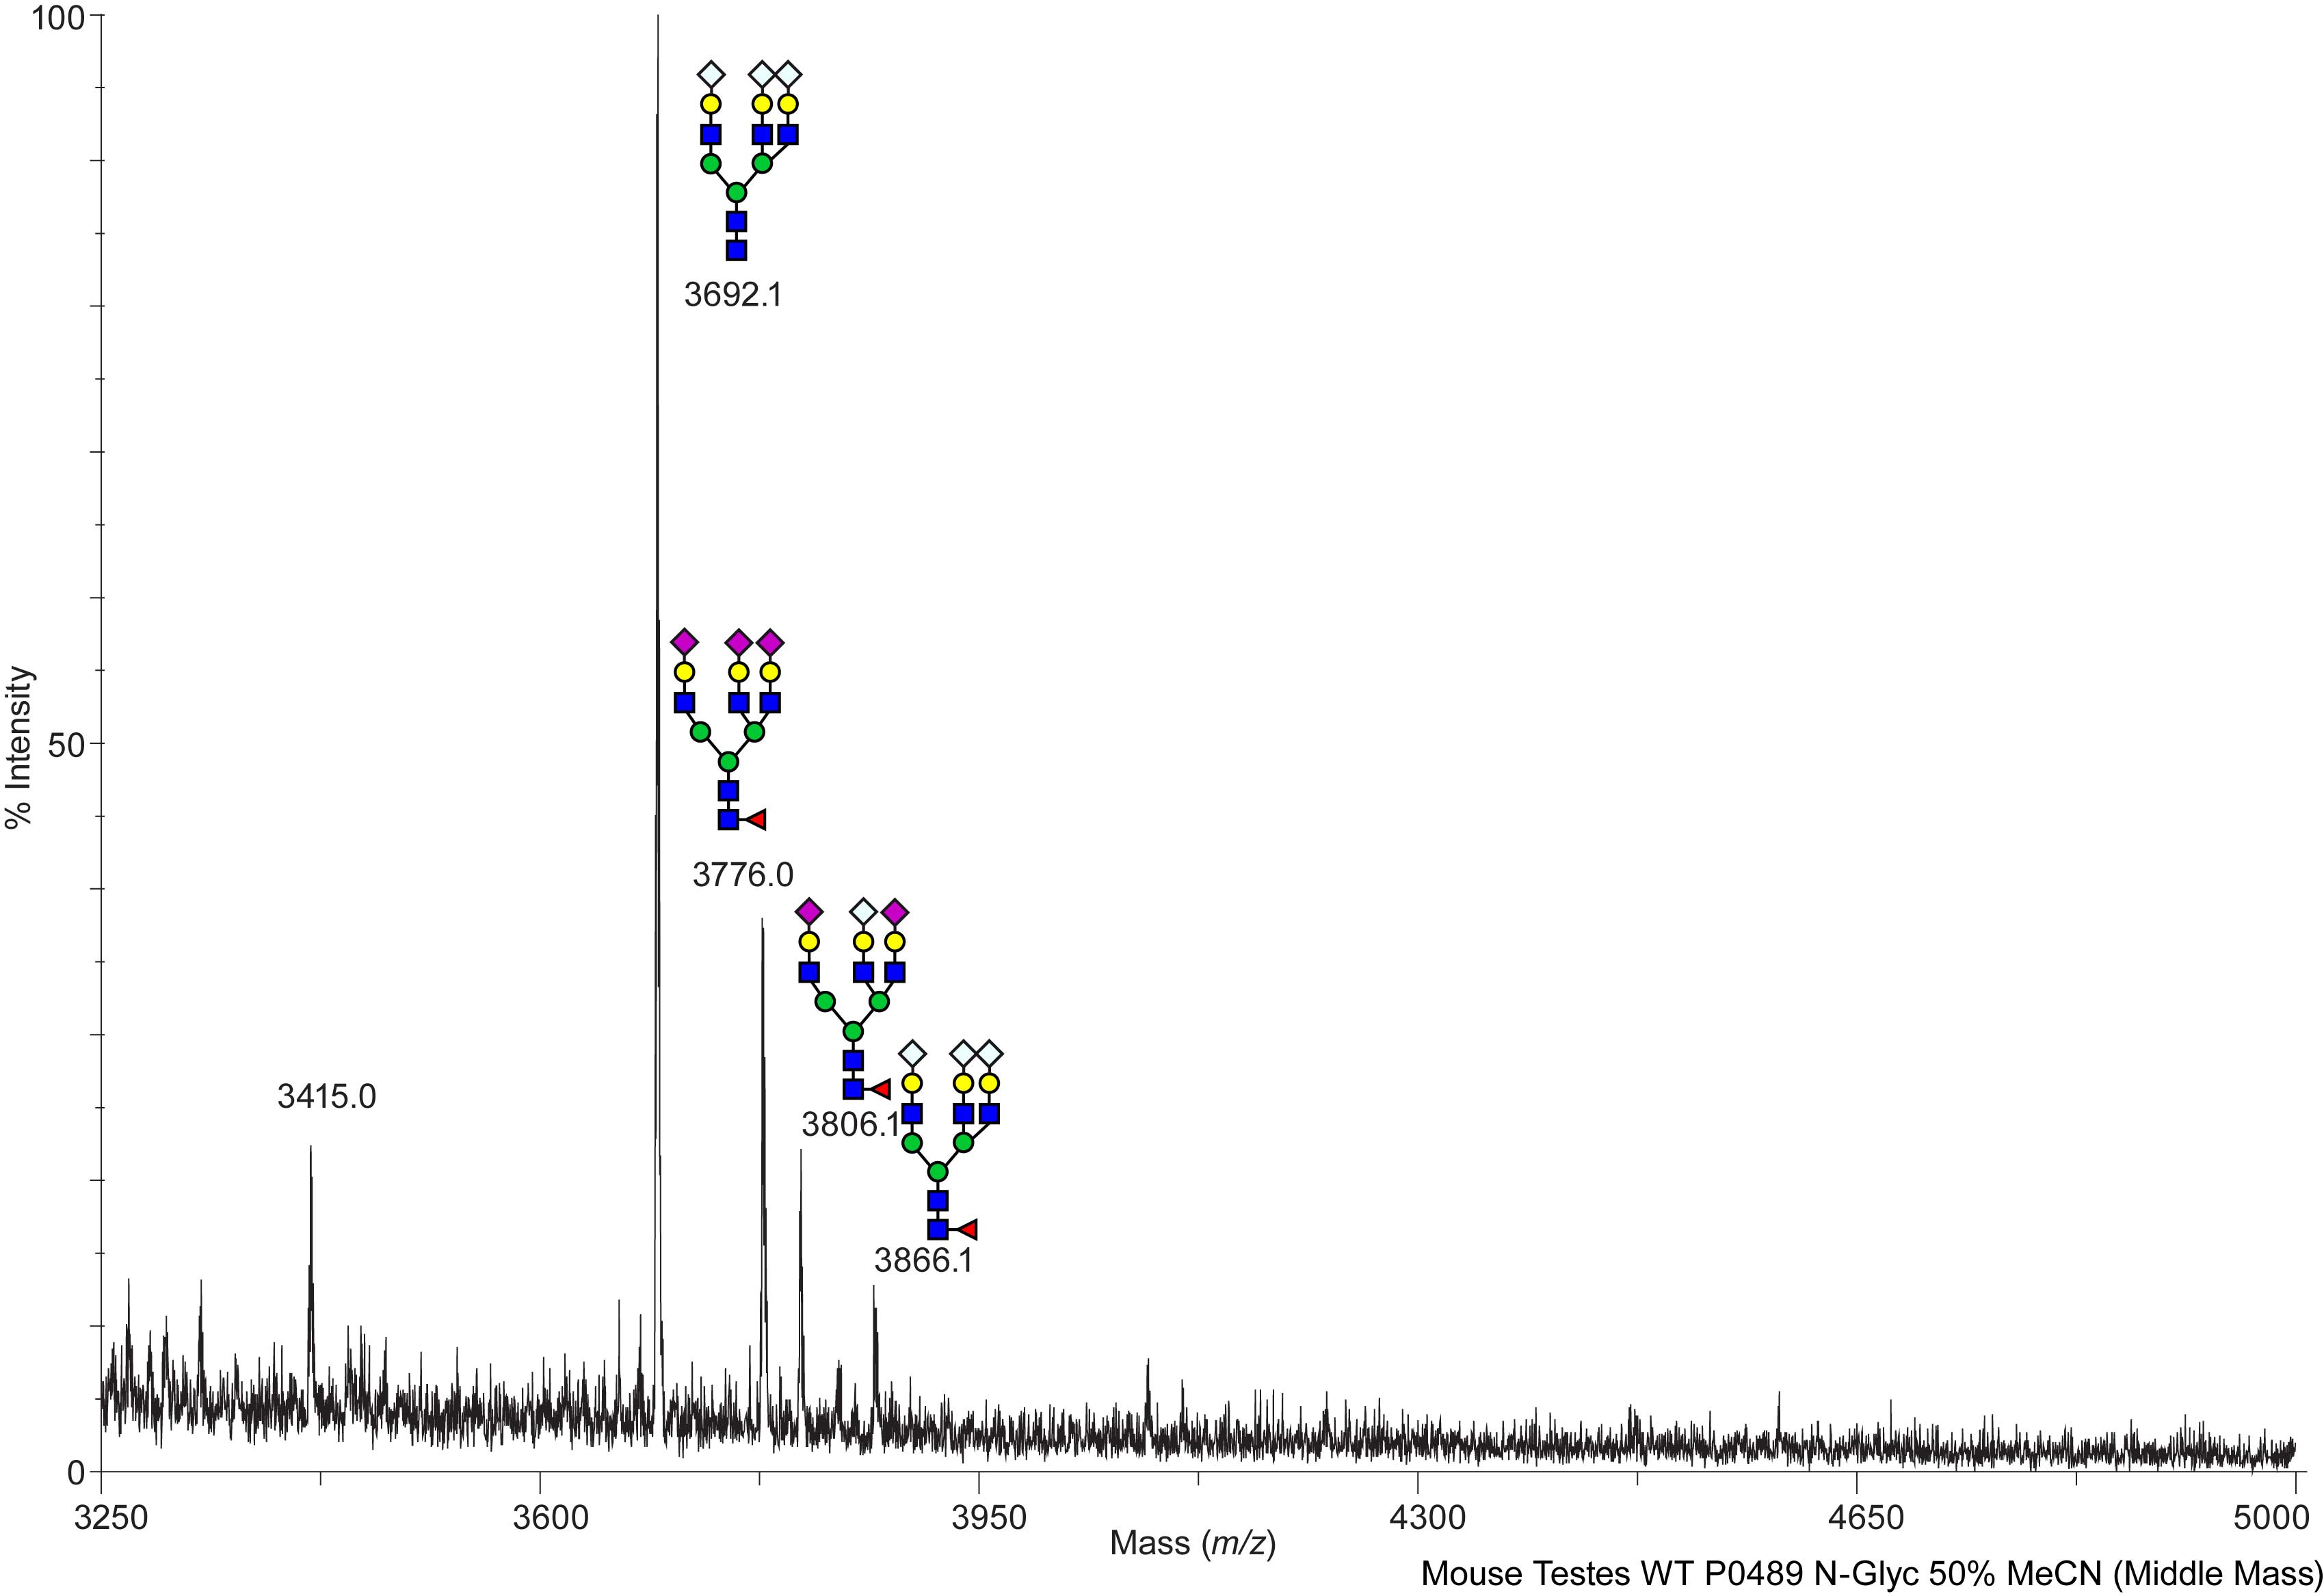
Mouse Wild Type Testes N-Linked C57BL/6 View experimental details      
Annotated file in JPG format Annotated file in PDF format
View Mass Spectrum data as text View Mass Peak file   Interactive Mass Spectrum Viewer
FC Mouse Fuct IV + VII Testes N-Linked C57BL/6 View experimental details      
Annotated file for lower mass range in JPG formatAnnotated file for higher mass range in JPG format Annotated file for lower mass range in PDF formatAnnotated file for higher mass range in PDF format
View Mass Spectrum data as text      
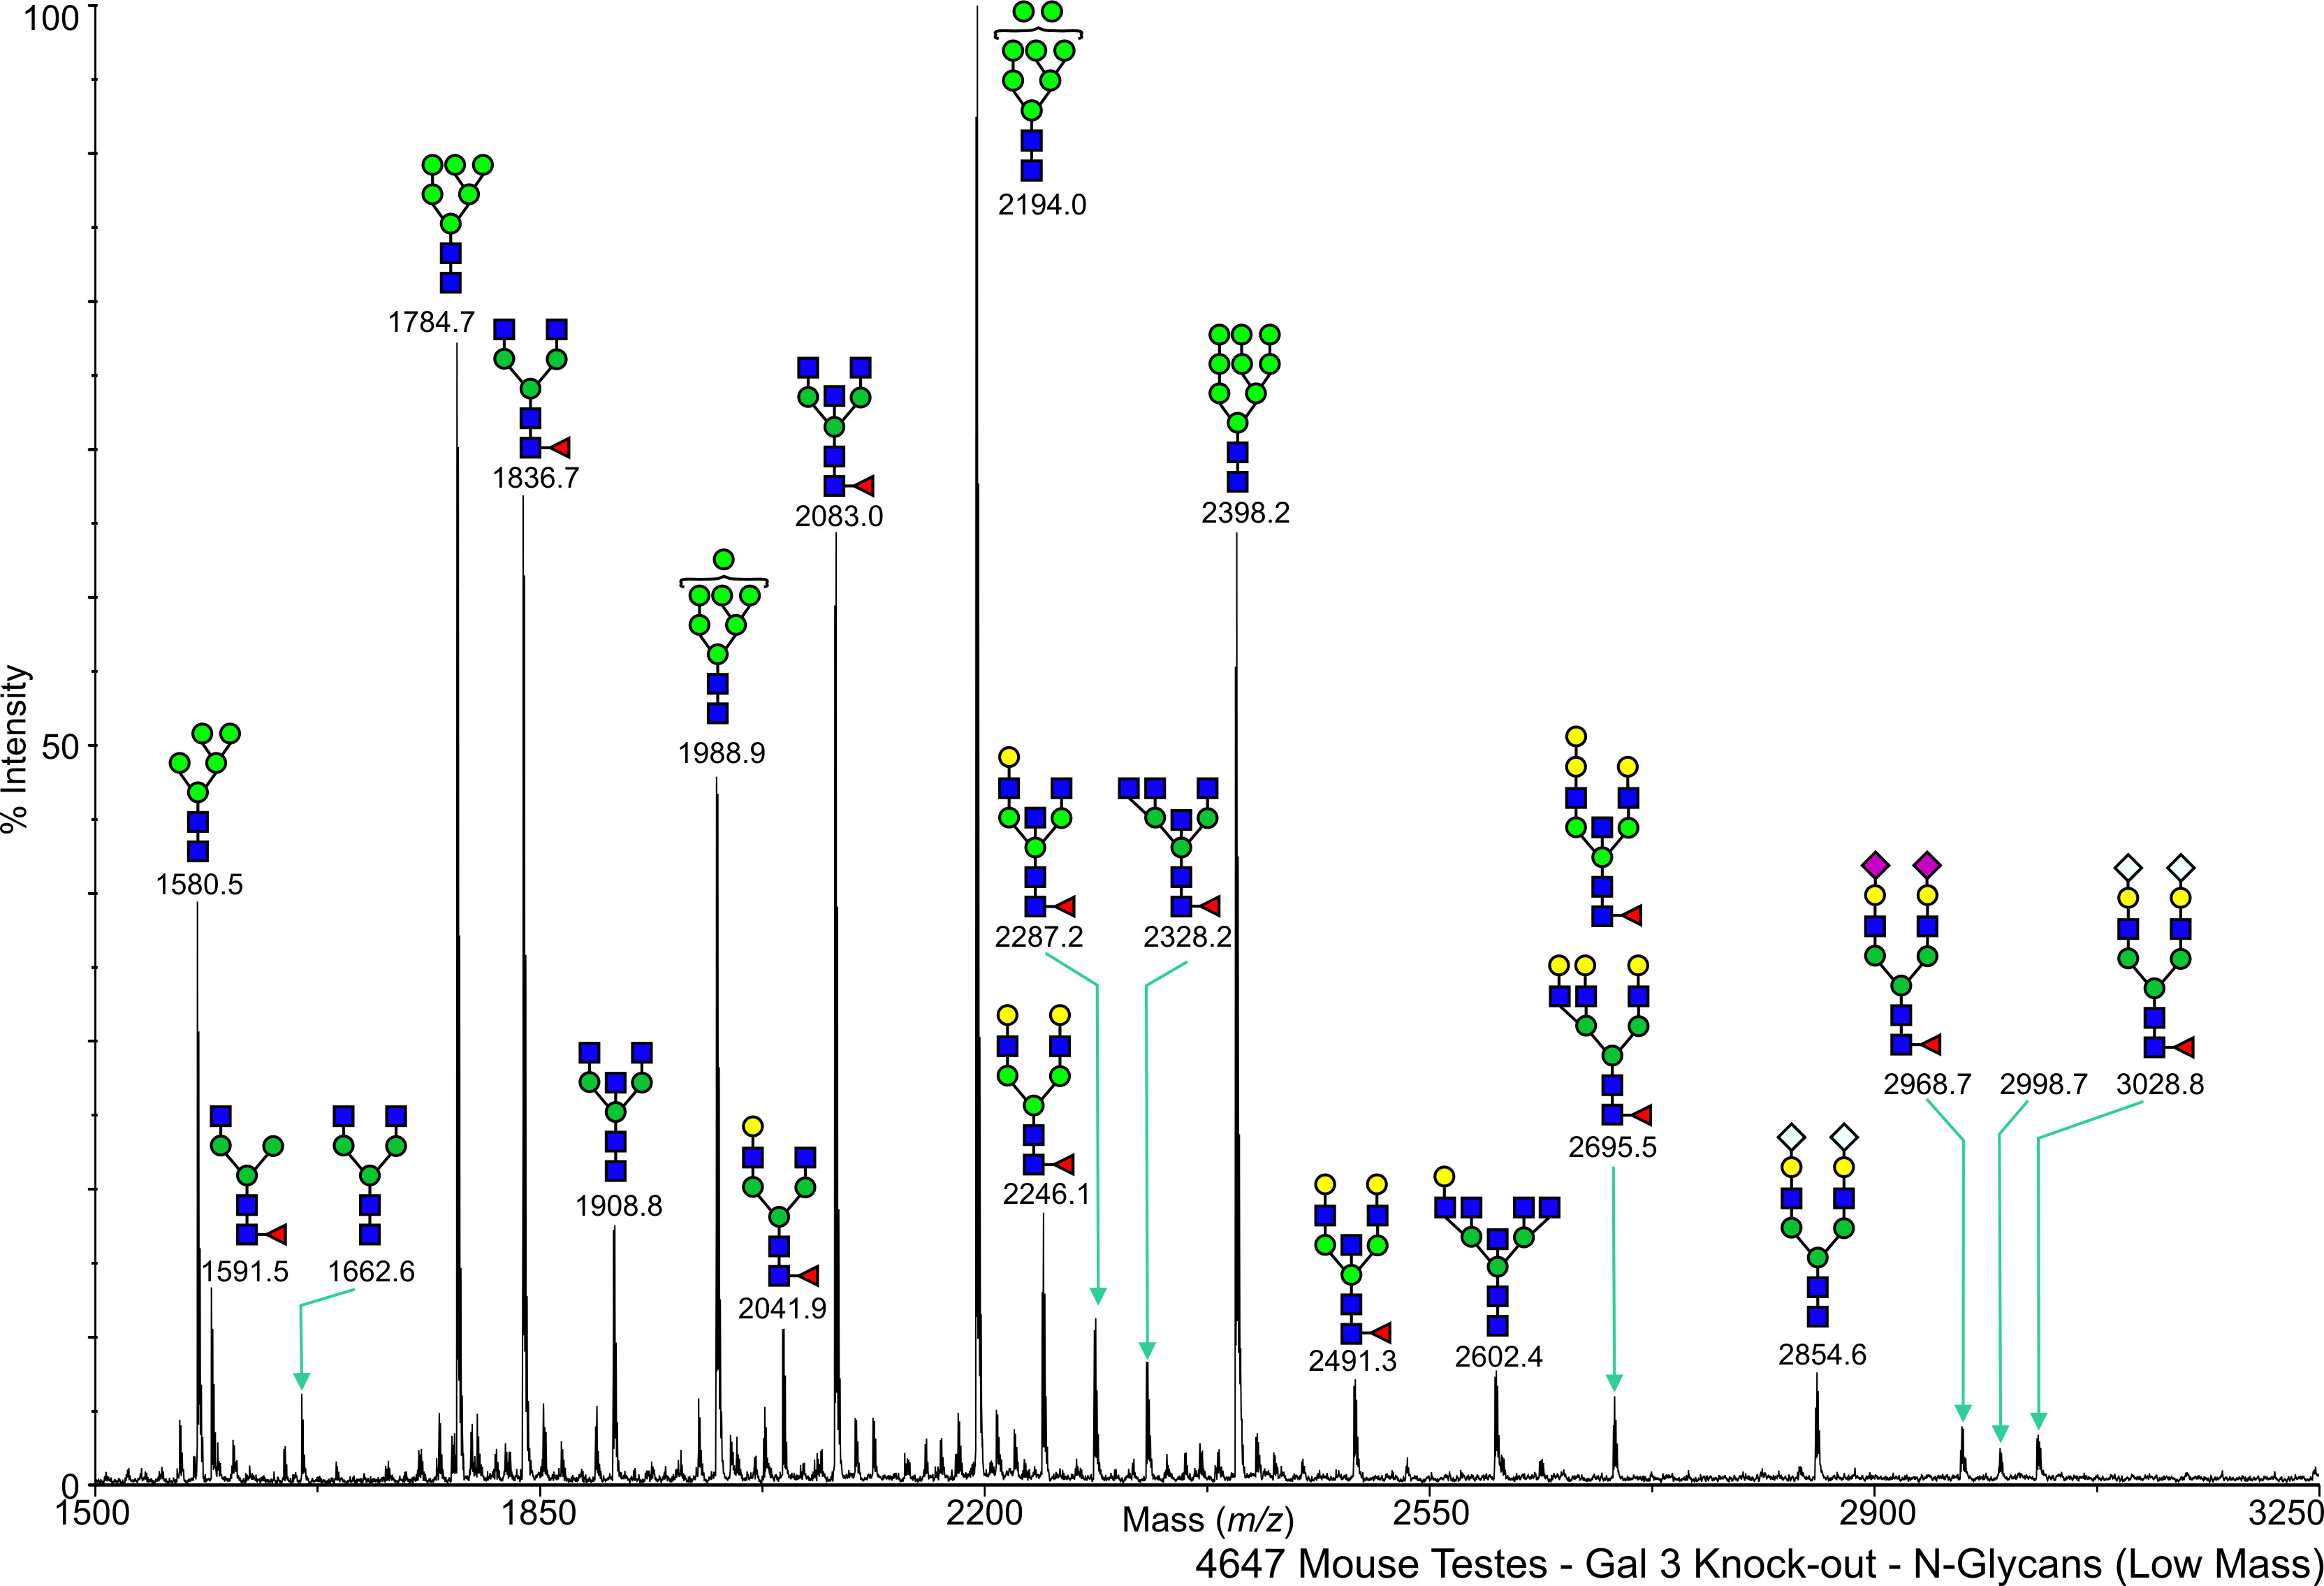
GT Mouse Gal 3 Testes N-Linked C57BL/6 View experimental details      
Annotated file in JPG format Annotated file in PDF format
View Mass Spectrum data as text View Mass Peak file   Interactive Mass Spectrum Viewer
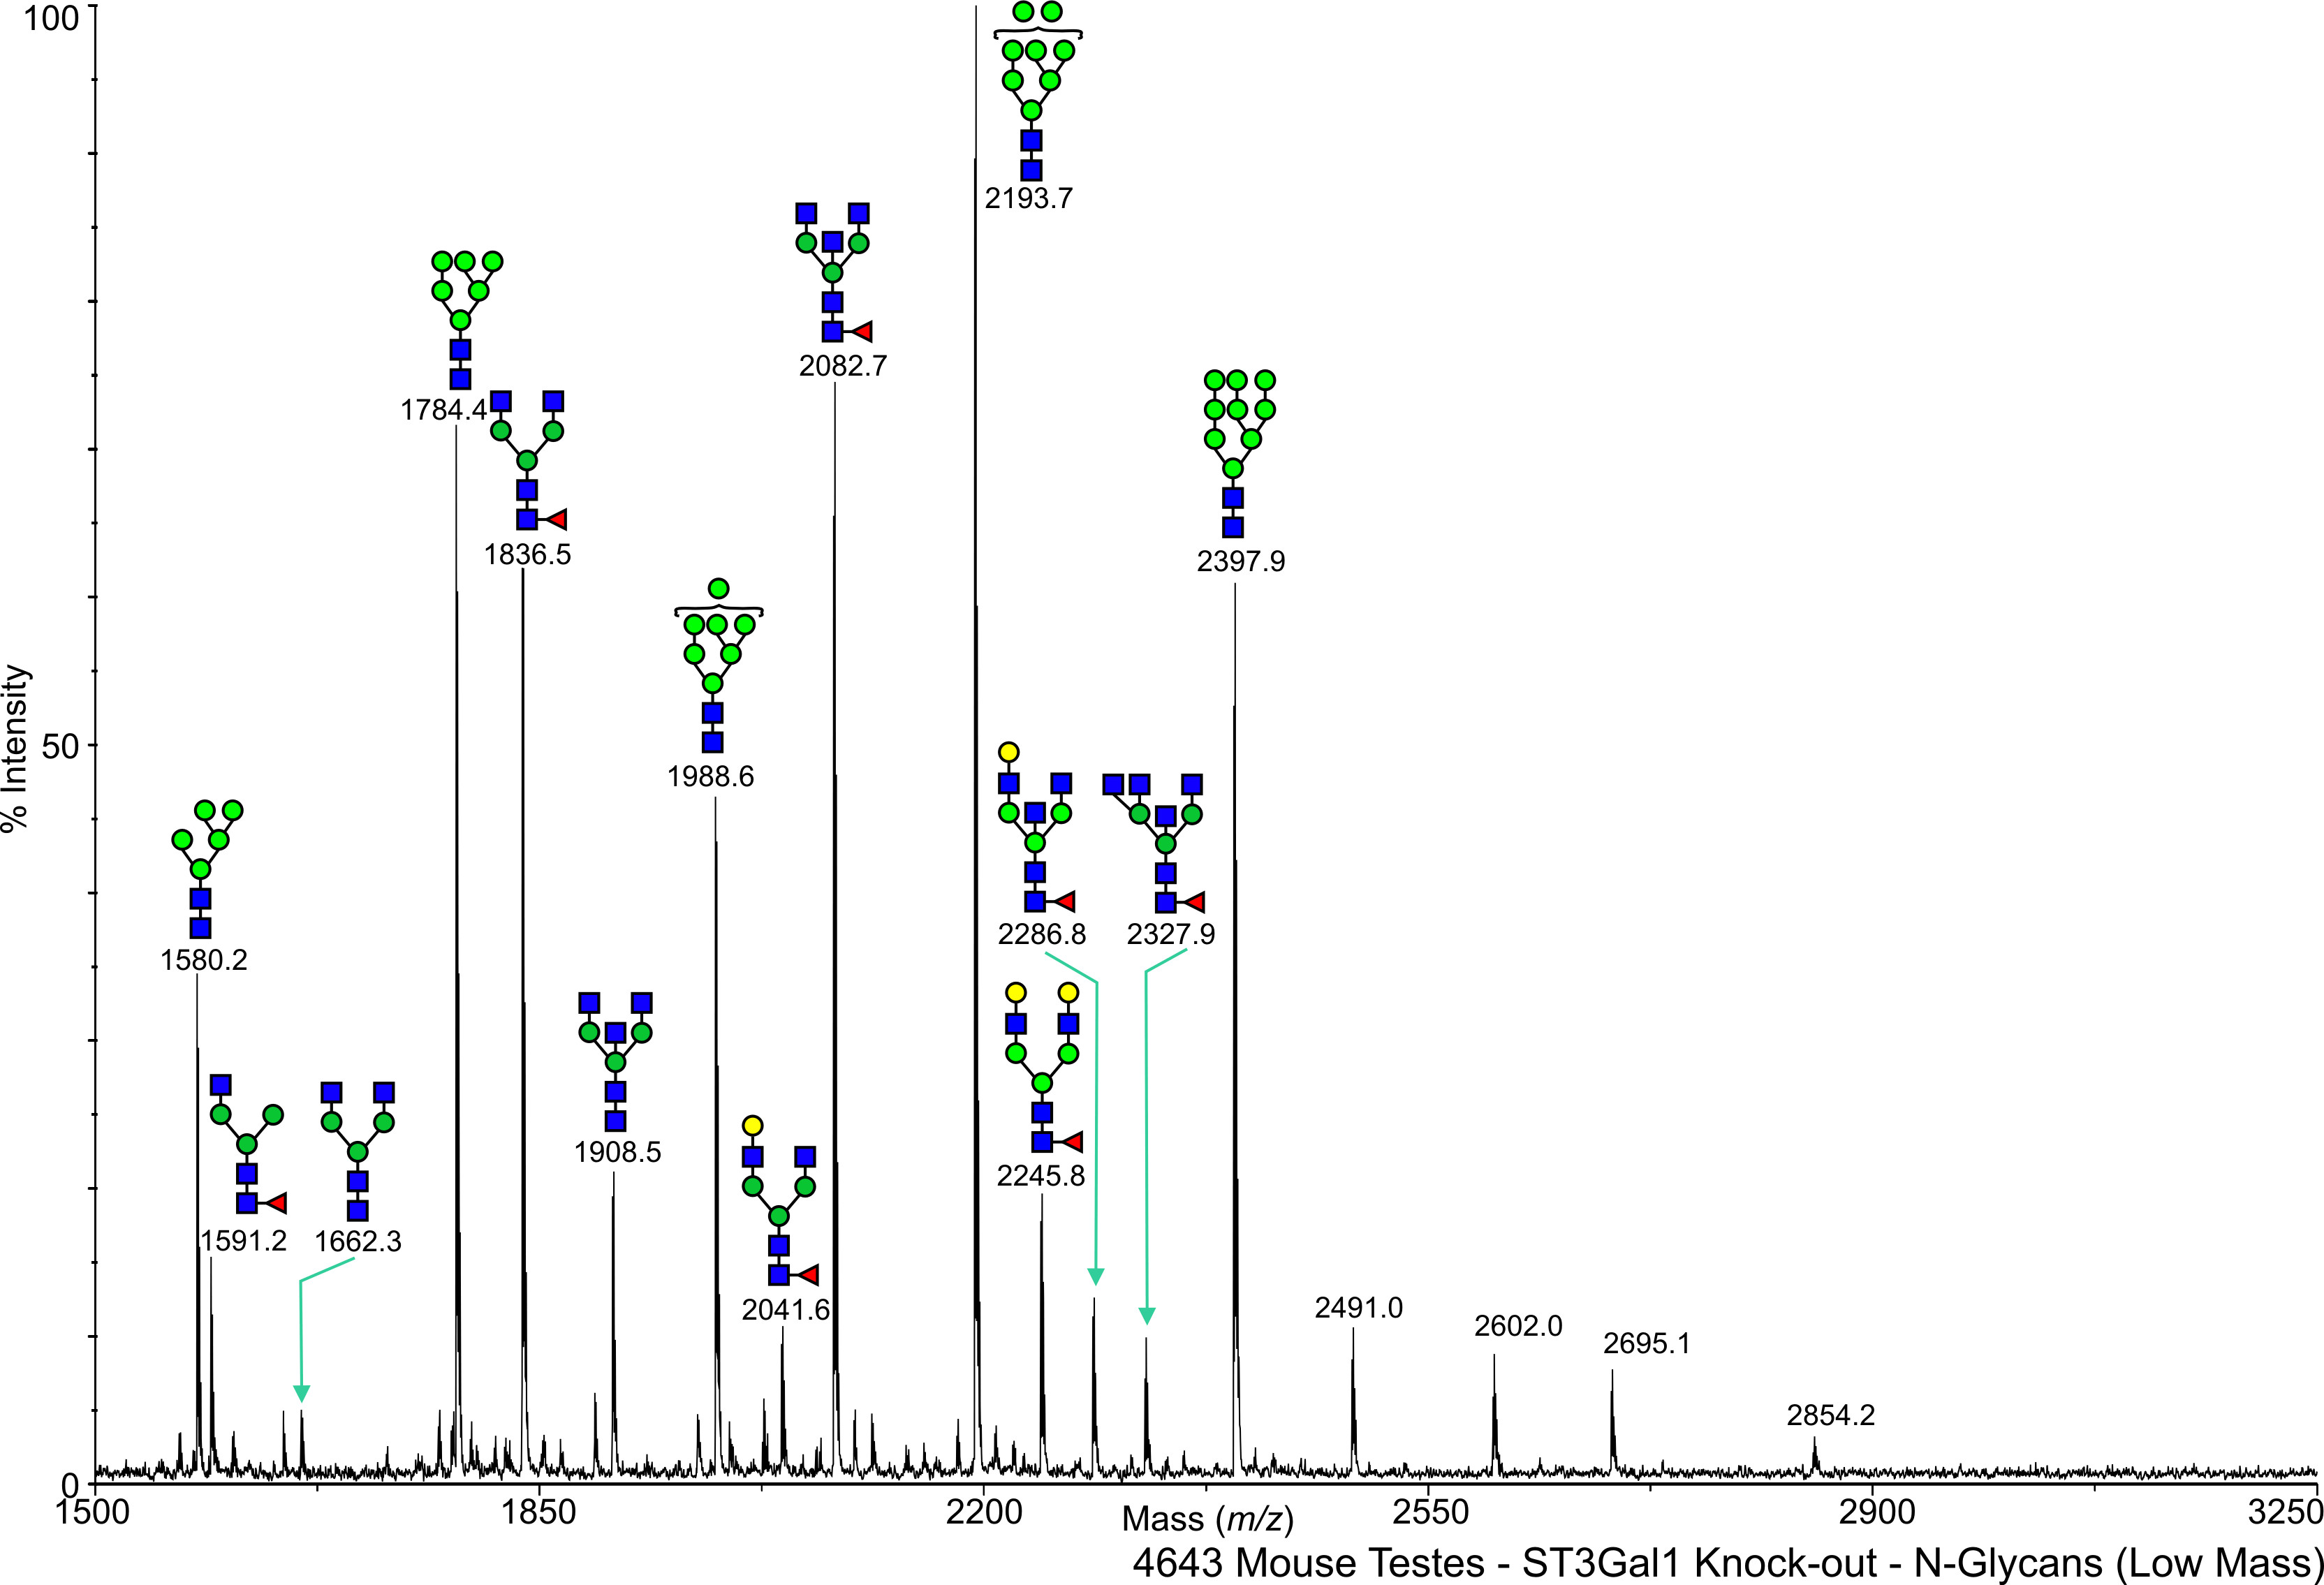
ST Mouse ST3 Gal 1 Testes N-Linked C57BL/6 View experimental details      
Annotated file in JPG format Annotated file in PDF format
View Mass Spectrum data as text View Mass Peak file   Interactive Mass Spectrum Viewer
Mouse Wild Type Testes O-Linked C57BL/6 View experimental details      
   
View Mass Spectrum data as text      
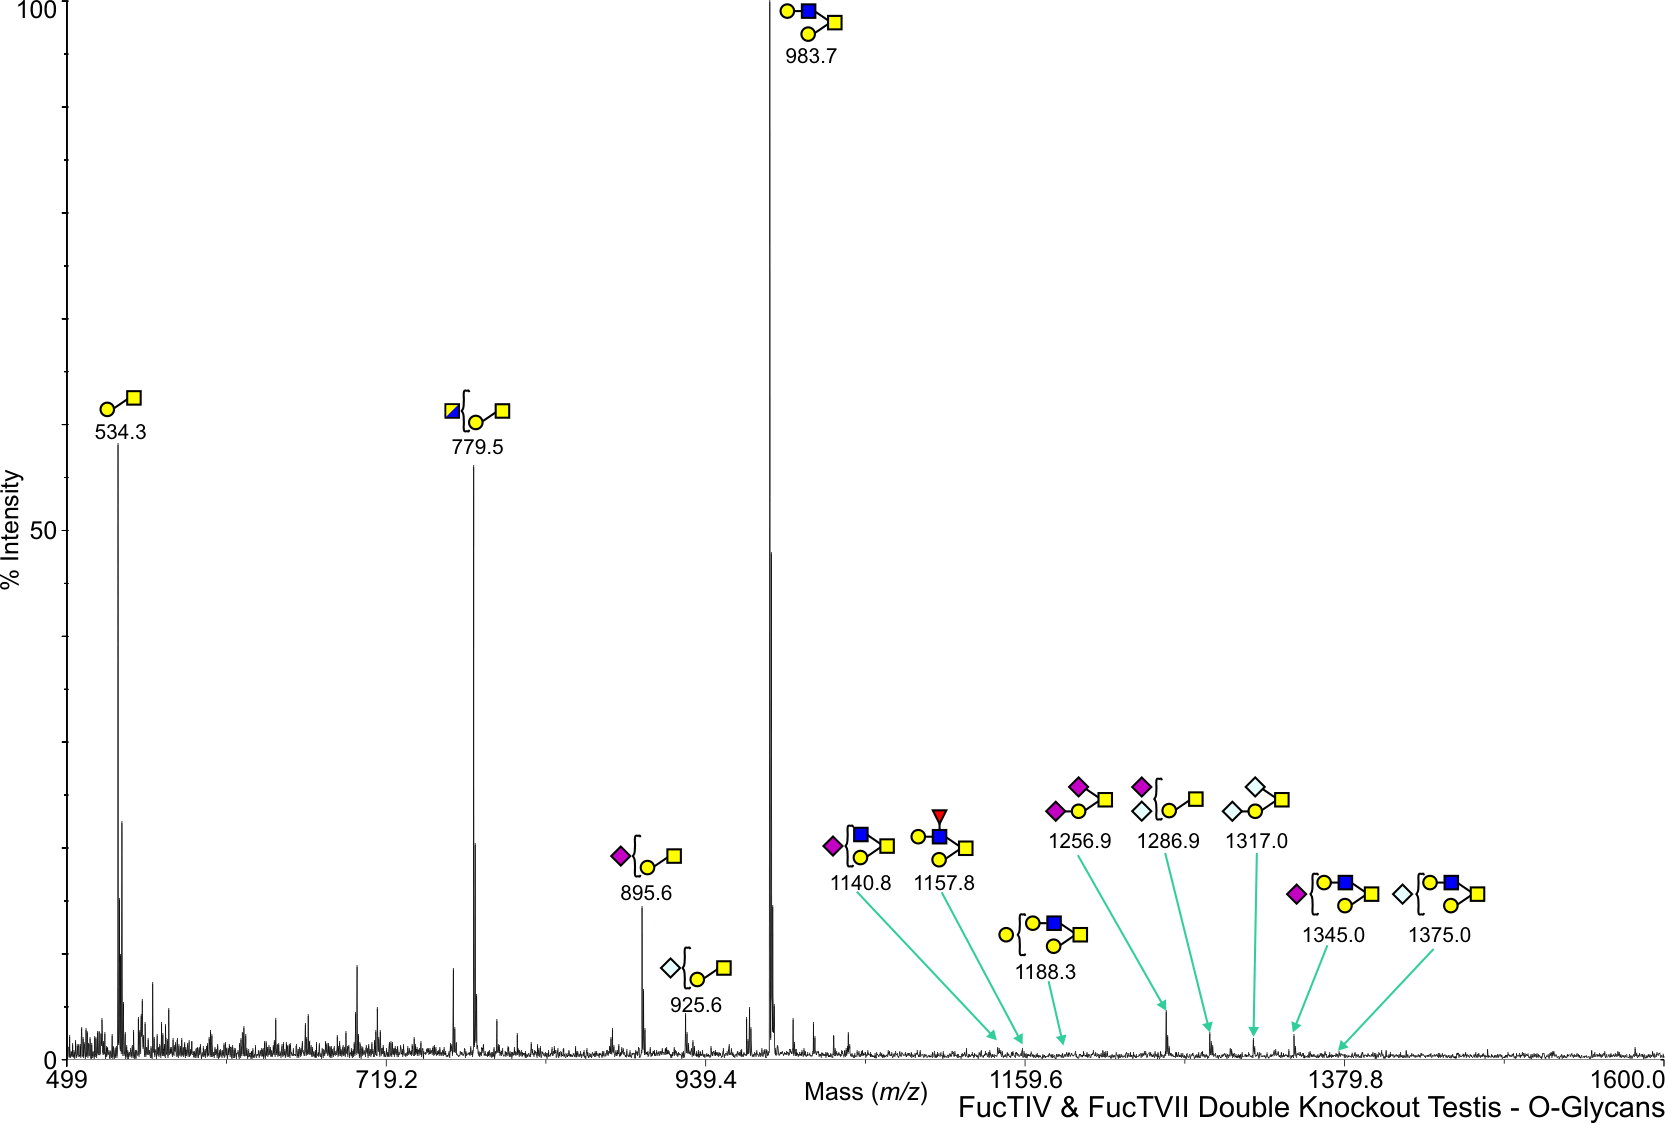
FC Mouse Fuct IV + VII Testes O-Linked C57BL/6 View experimental details      
Annotated file in JPG format Annotated file in PDF format
View Mass Spectrum data as text View Mass Peak file   Interactive Mass Spectrum Viewer
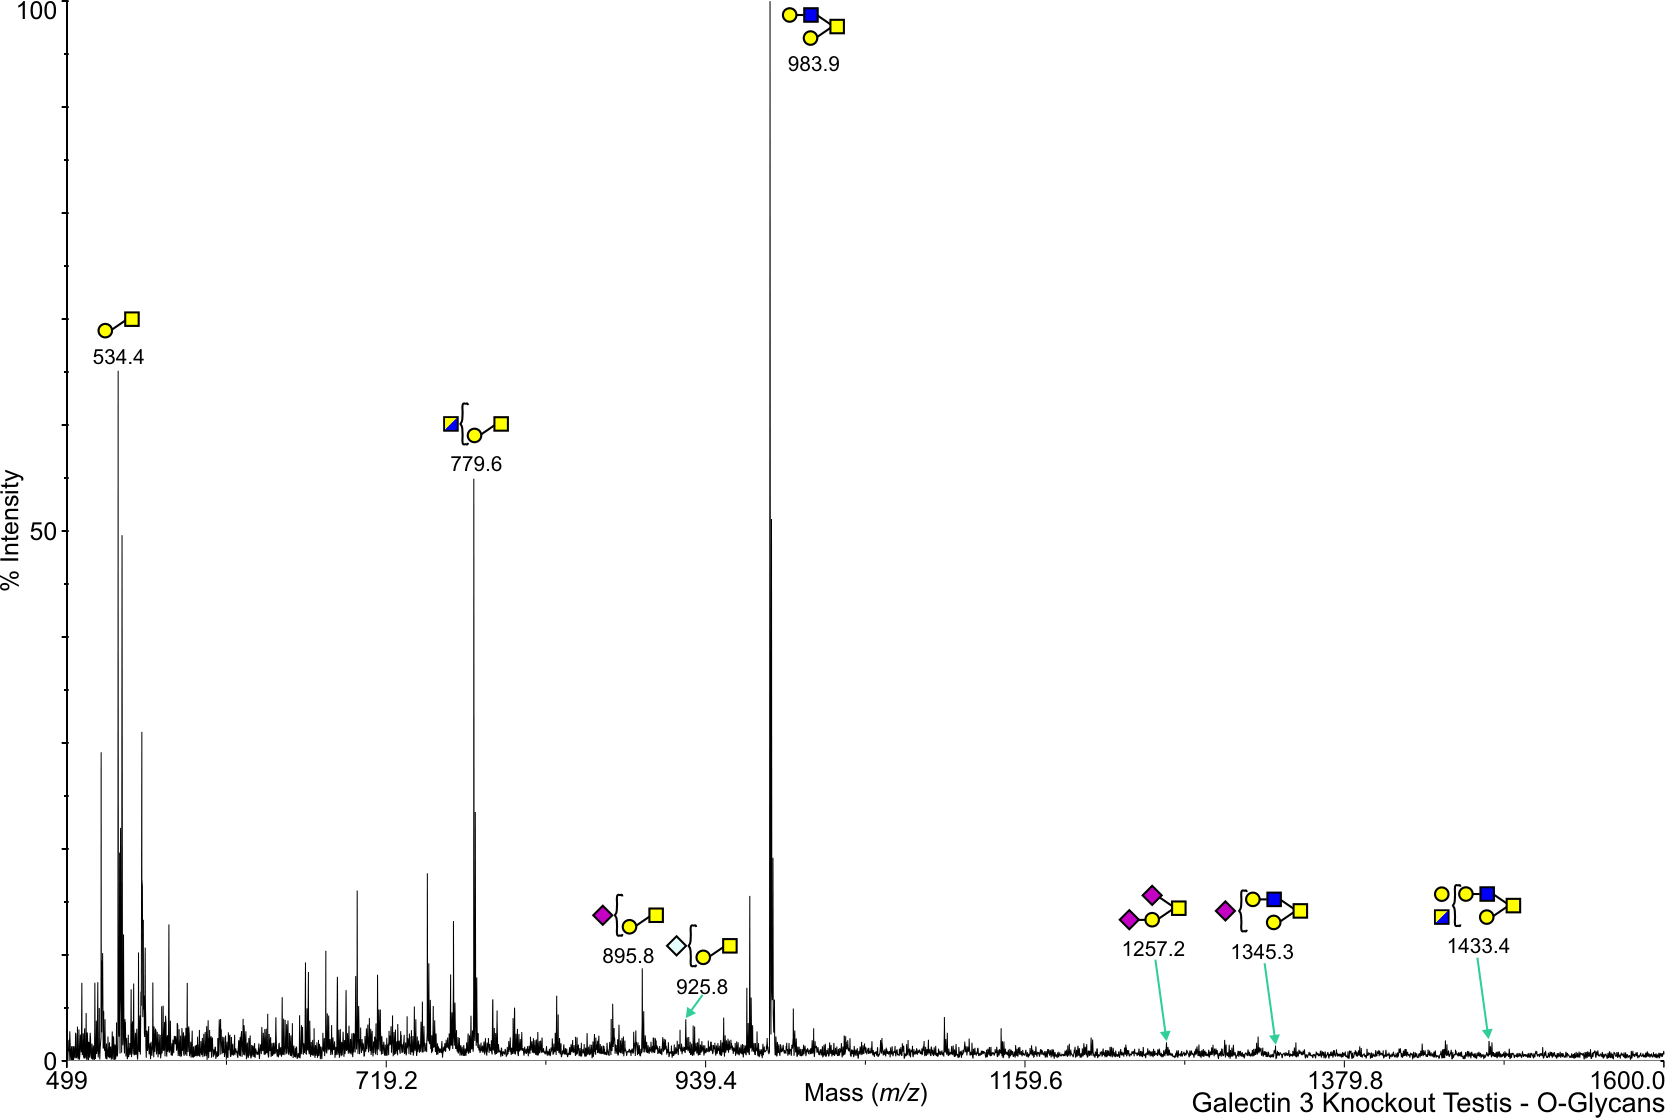
GT Mouse Gal 3 Testes O-Linked C57BL/6 View experimental details      
Annotated file in JPG format Annotated file in PDF format
View Mass Spectrum data as text View Mass Peak file   Interactive Mass Spectrum Viewer
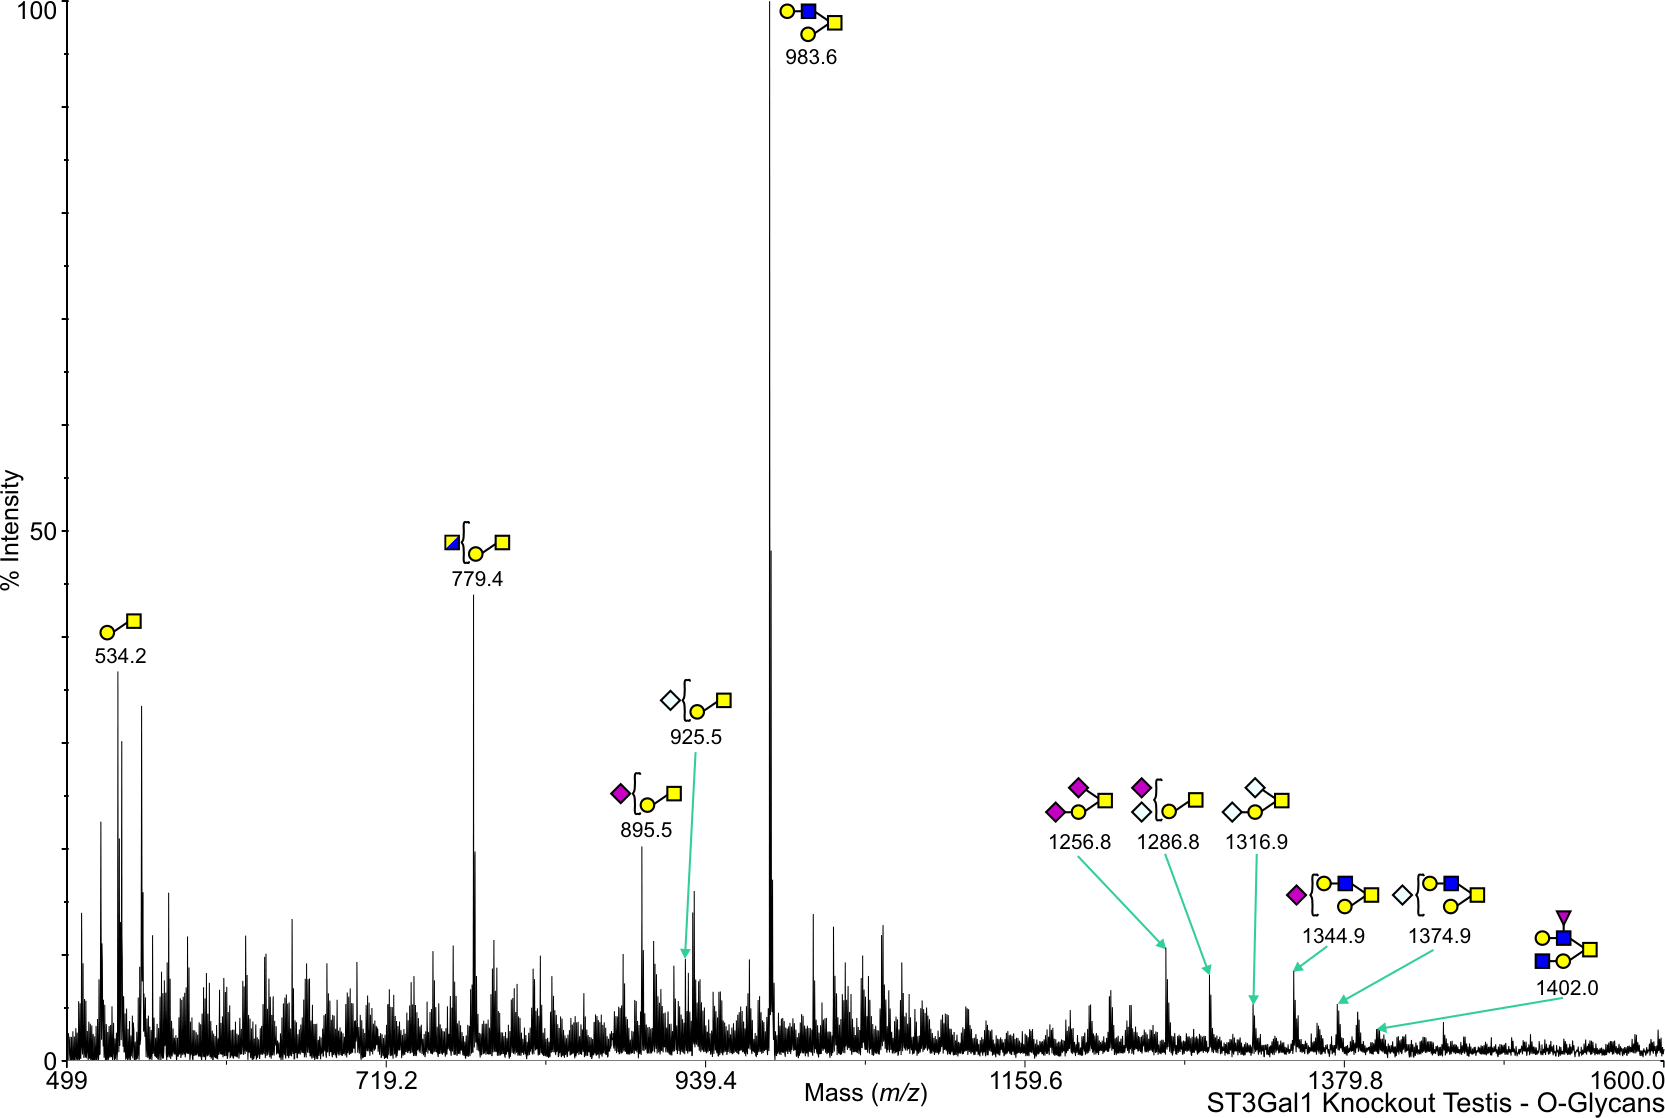
ST Mouse ST3 Gal 1 Testes O-Linked C57BL/6 View experimental details      
Annotated file in JPG format Annotated file in PDF format
View Mass Spectrum data as text View Mass Peak file   Interactive Mass Spectrum Viewer
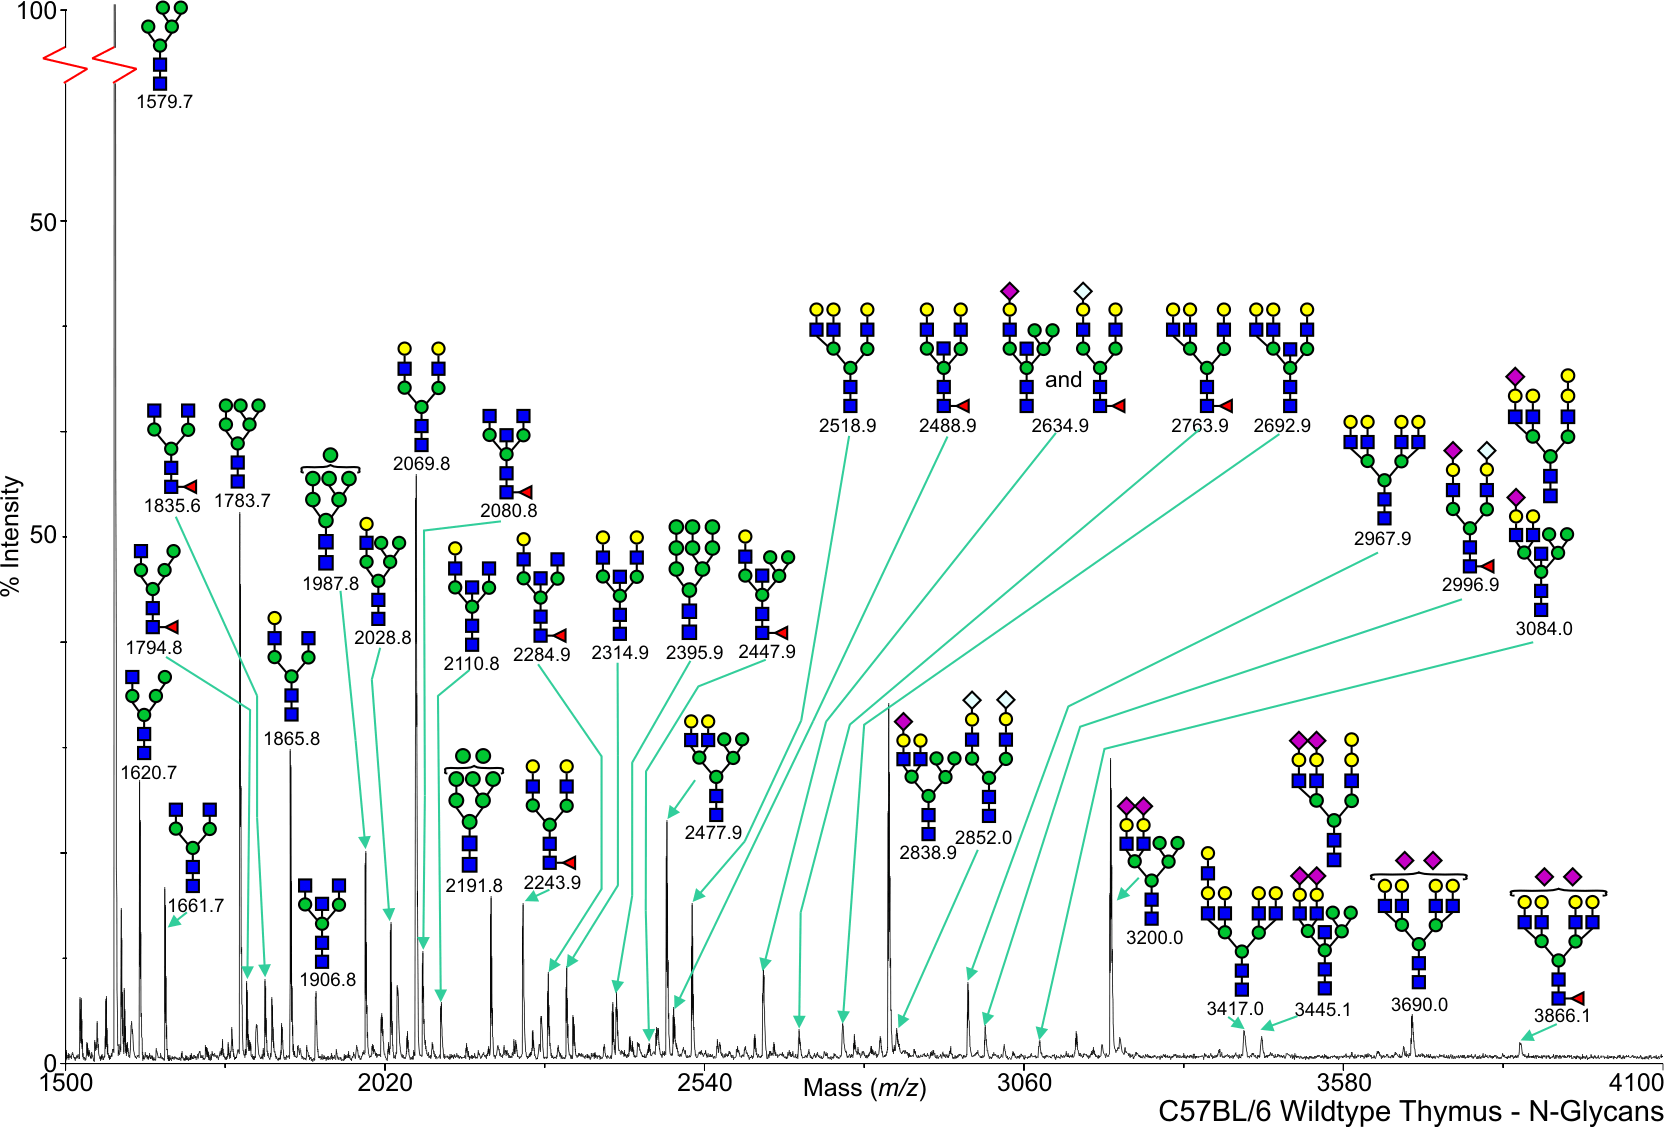
Mouse Wild Type Thymus N-Linked C57BL/6 View experimental details      
Annotated file in JPG format Annotated file in PDF format
View Mass Spectrum data as text View Mass Peak file   Interactive Mass Spectrum Viewer
FA Mouse Fuct IV Thymus N-Linked C57BL/6 View experimental details      
Annotated file in JPG format Annotated file in PDF format
View Mass Spectrum data as text View Mass Peak file   Interactive Mass Spectrum Viewer
FB Mouse Fuct VII Thymus N-Linked C57BL/6 View experimental details      
Annotated file in JPG format Annotated file in PDF format
View Mass Spectrum data as text View Mass Peak file   Interactive Mass Spectrum Viewer
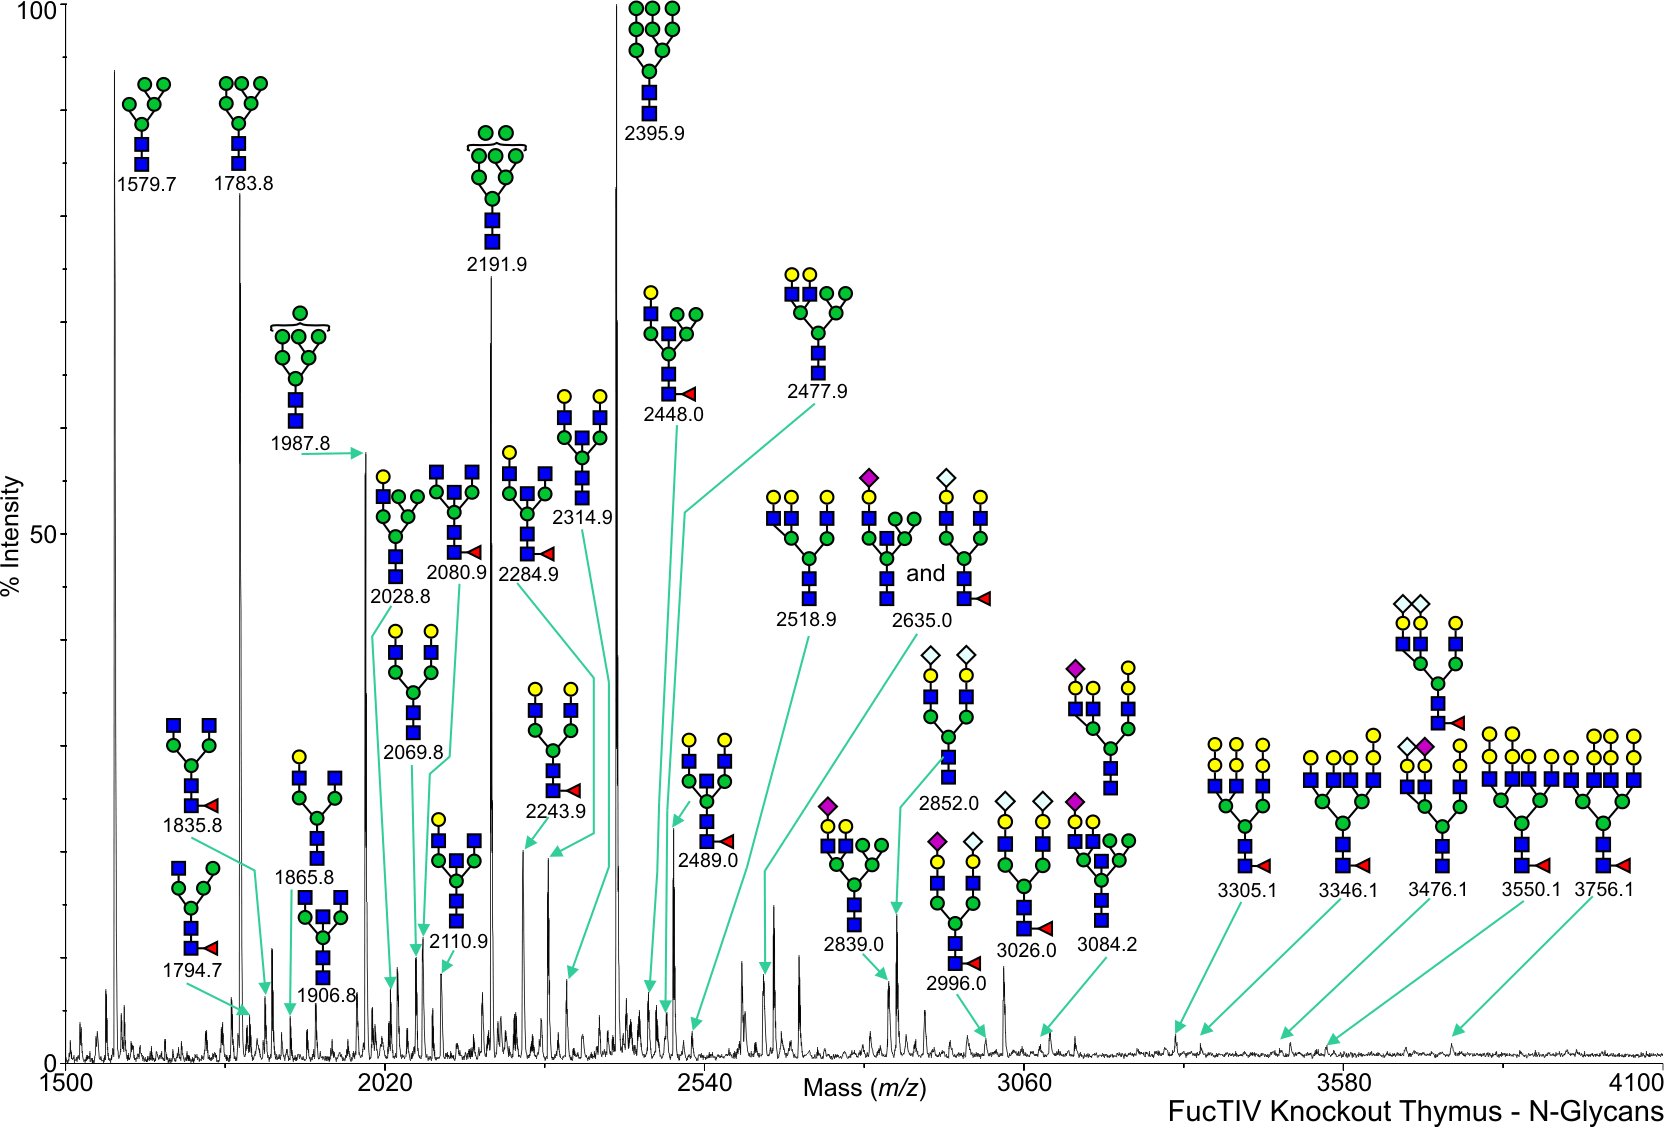
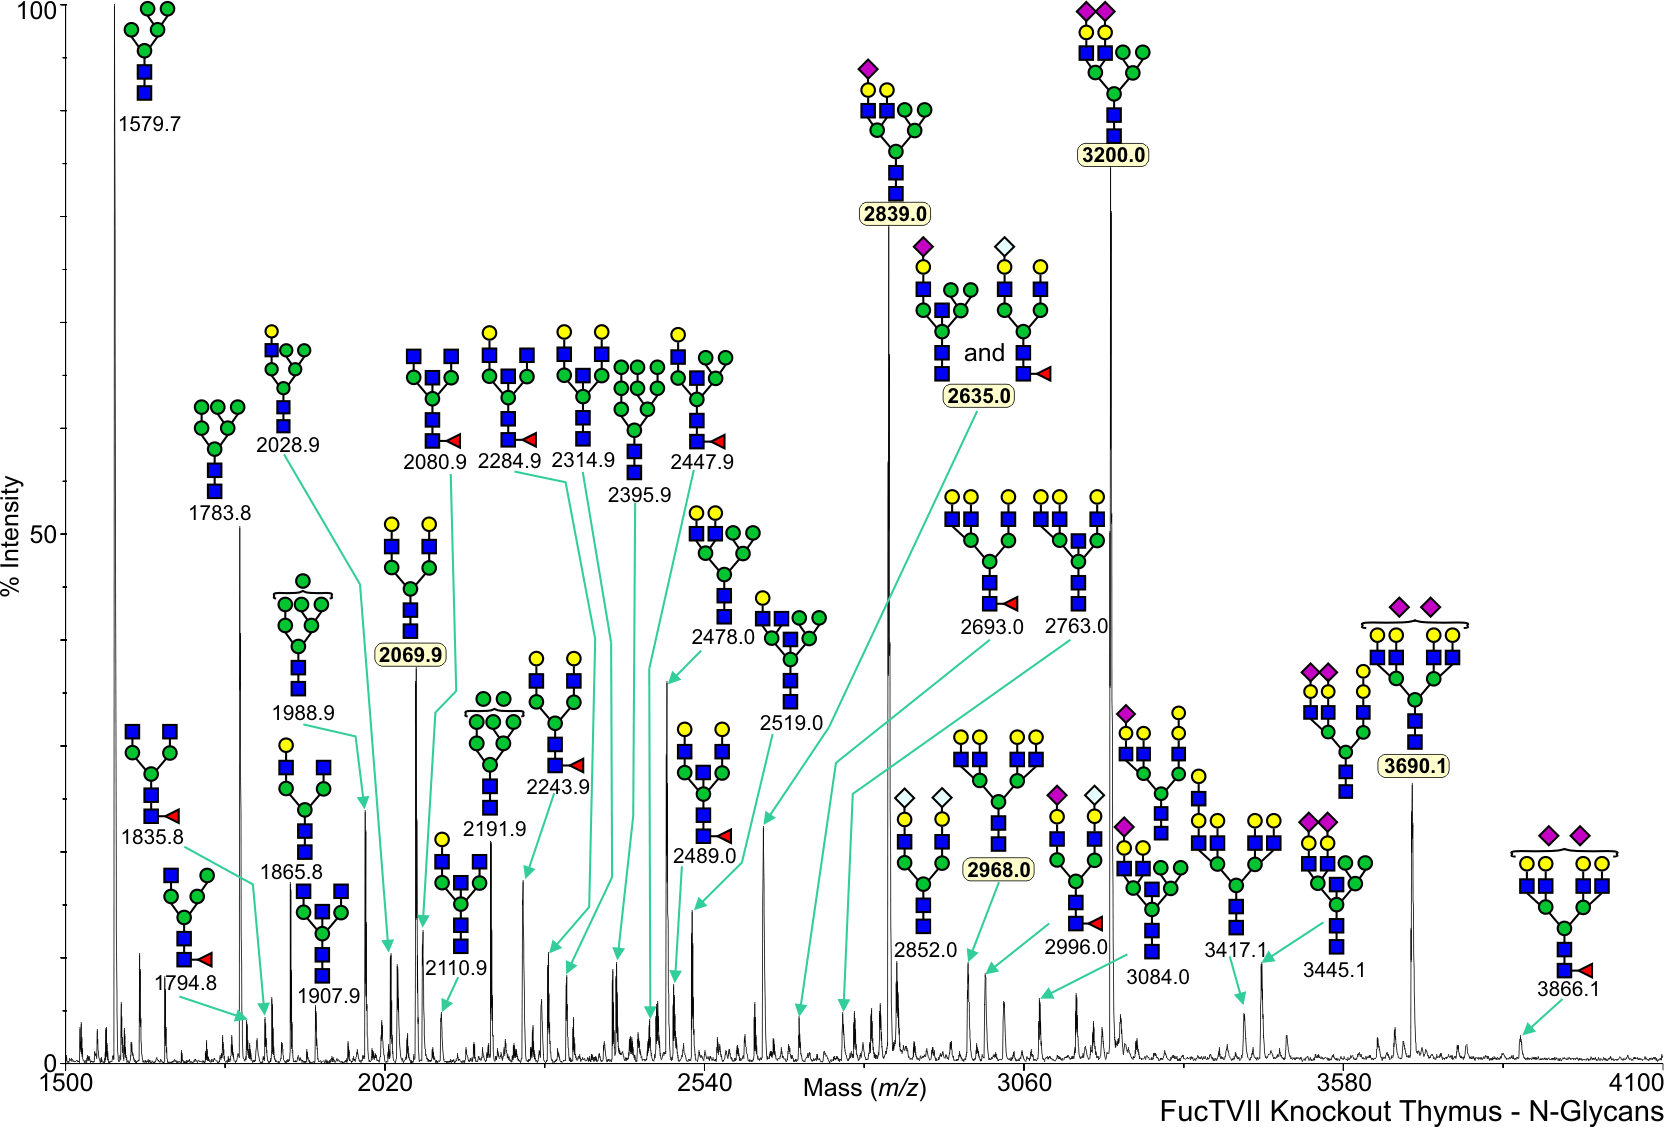
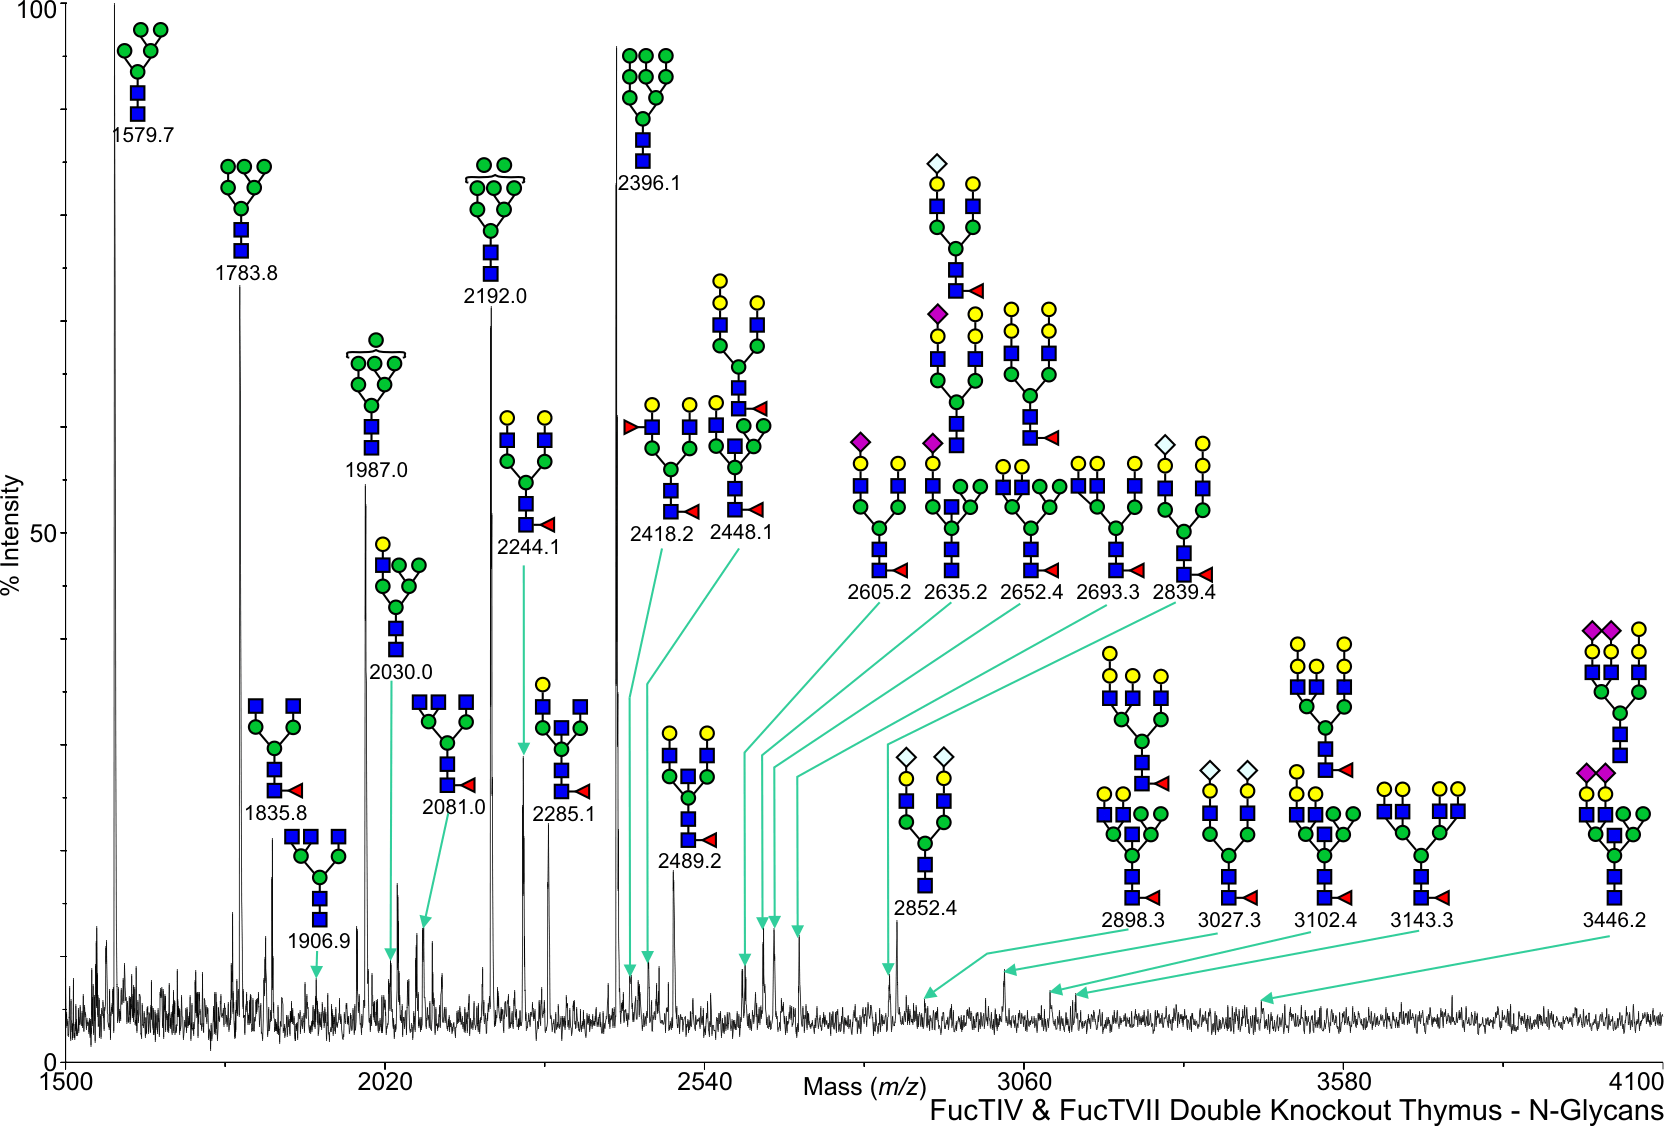
FC Mouse Fuct IV + VII Thymus N-Linked C57BL/6 View experimental details      
Annotated file in JPG format Annotated file in PDF format
View Mass Spectrum data as text View Mass Peak file   Interactive Mass Spectrum Viewer
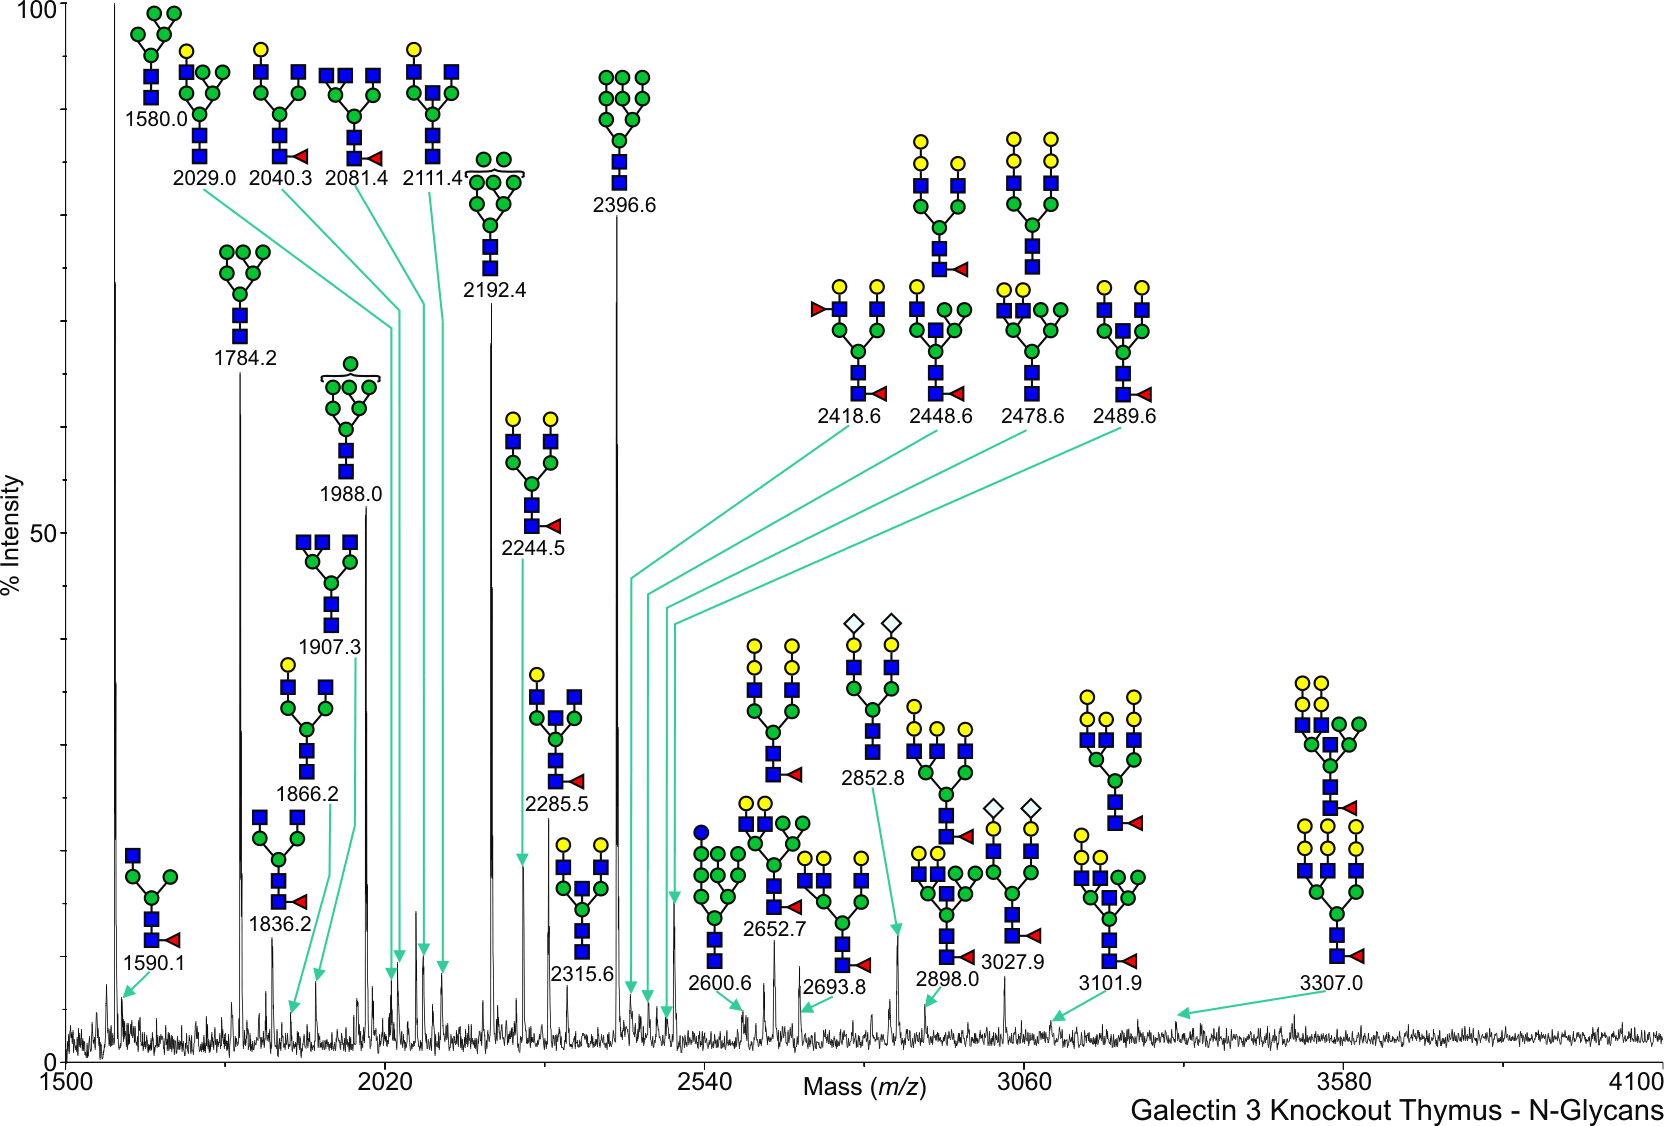
GT Mouse Gal 3 Thymus N-Linked C57BL/6 View experimental details      
Annotated file in JPG format Annotated file in PDF format
View Mass Spectrum data as text View Mass Peak file   Interactive Mass Spectrum Viewer
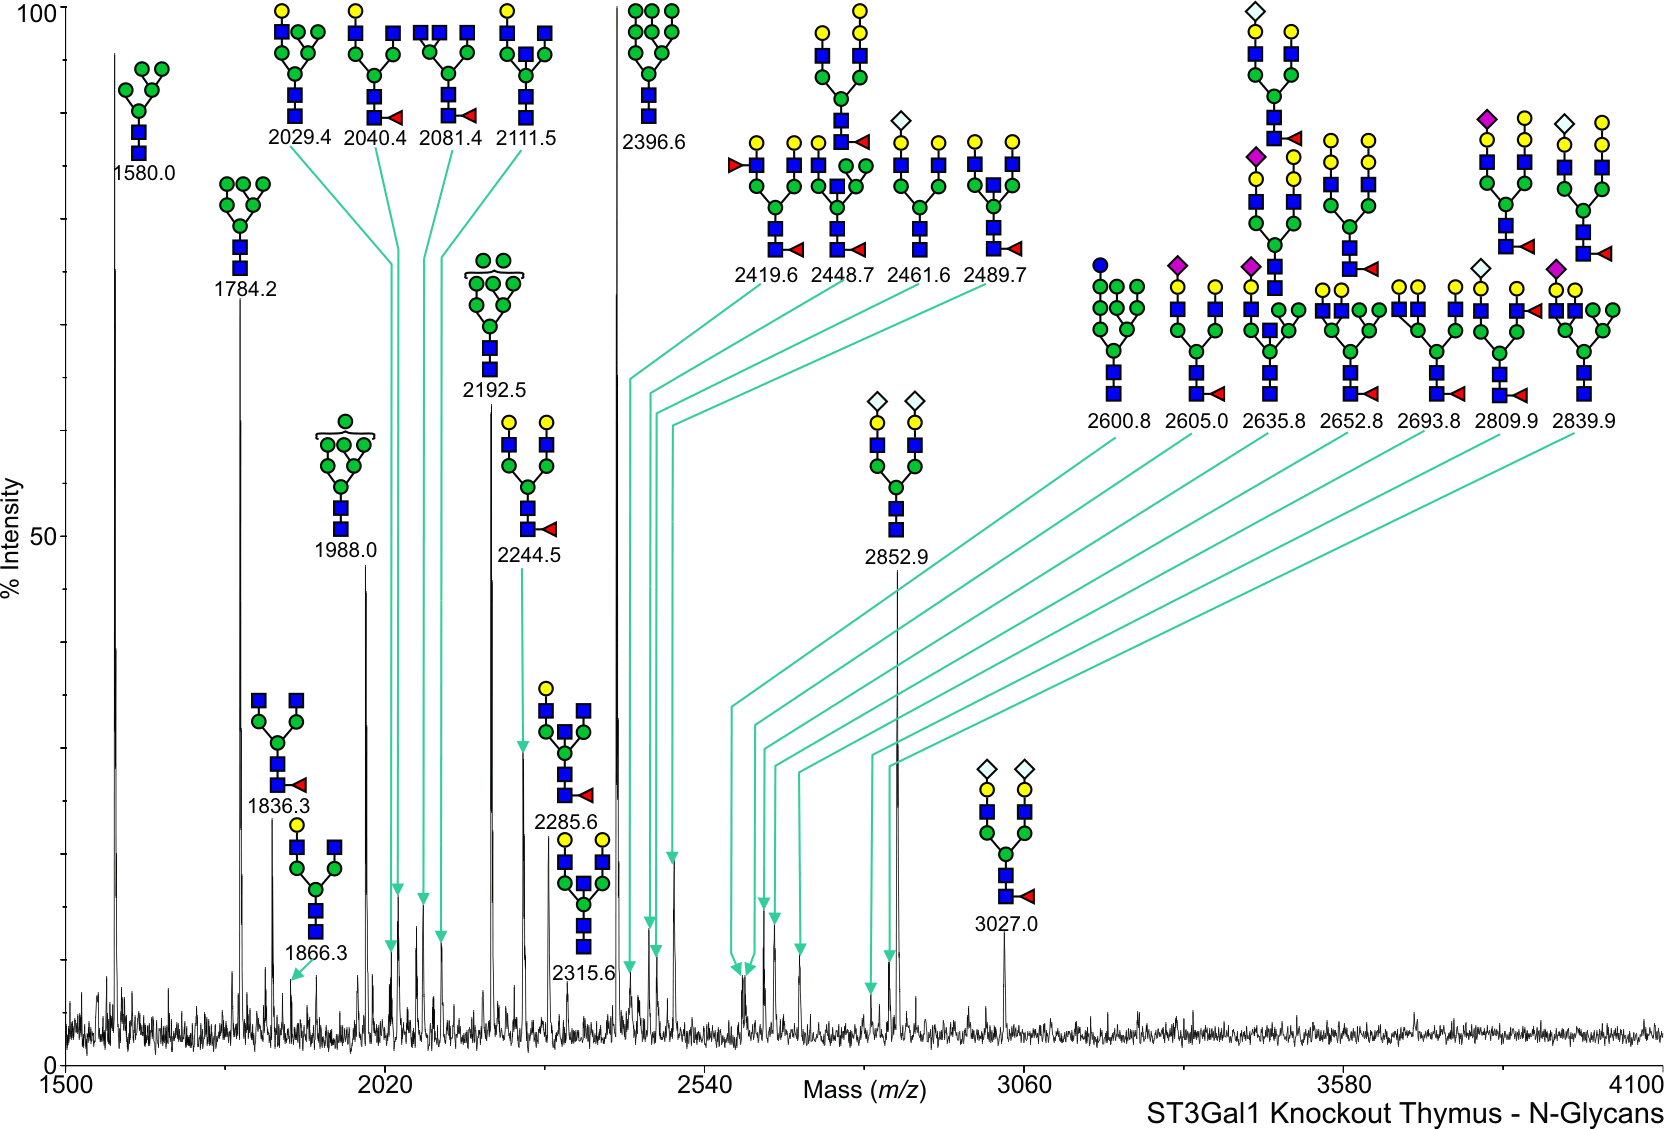
ST Mouse ST3 Gal 1 Thymus N-Linked C57BL/6 View experimental details      
Annotated file in JPG format Annotated file in PDF format
View Mass Spectrum data as text View Mass Peak file   Interactive Mass Spectrum Viewer
MG Mouse Core 2 GlcNAcT Thymus N-Linked C57BL/6 View experimental details      
   
View Mass Spectrum data as text      
Mouse CT GalNAcT Thymus N-Linked C57BL/6 View experimental details      
   
View Mass Spectrum data as text      
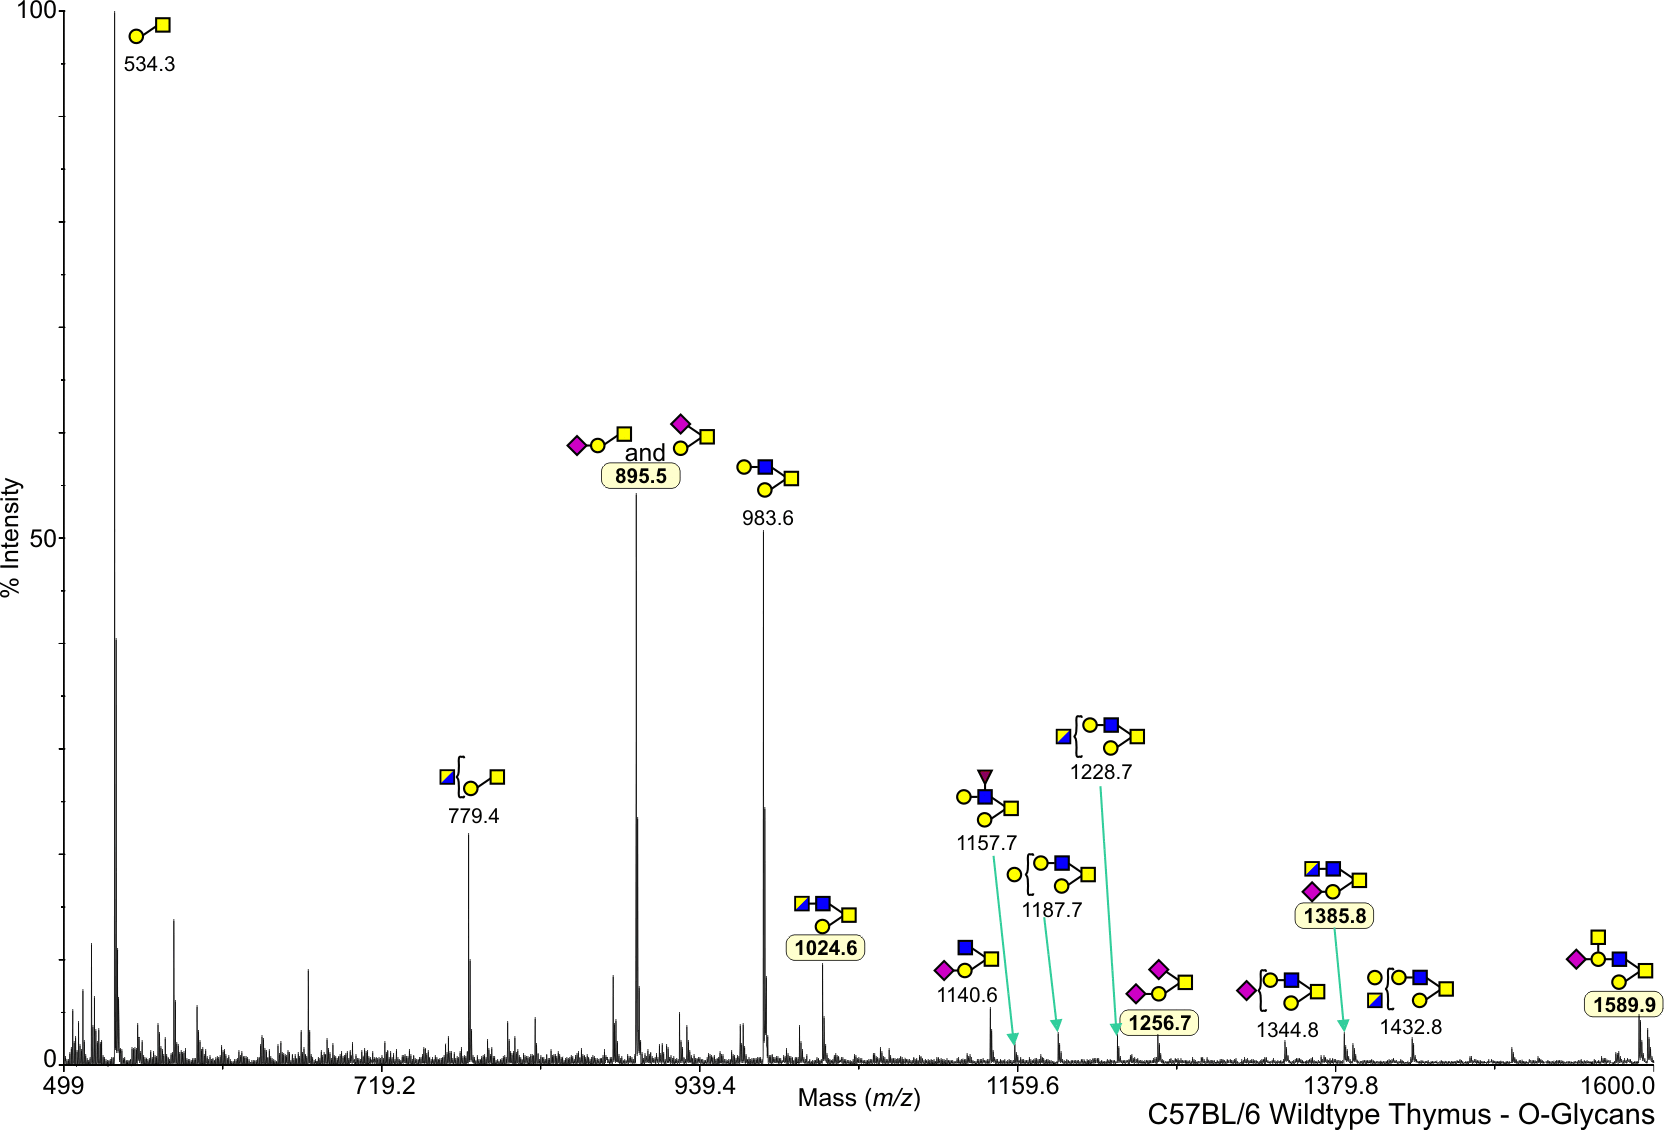
Mouse Wild Type Thymus O-Linked C57BL/6 View experimental details      
Annotated file in JPG format Annotated file in PDF format
View Mass Spectrum data as text View Mass Peak file   Interactive Mass Spectrum Viewer
FA Mouse Fuct IV Thymus O-Linked C57BL/6 View experimental details      
   
View Mass Spectrum data as text      
FB Mouse Fuct VII Thymus O-Linked C57BL/6 View experimental details      
Annotated file in JPG format Annotated file in PDF format
View Mass Spectrum data as text View Mass Peak file   Interactive Mass Spectrum Viewer
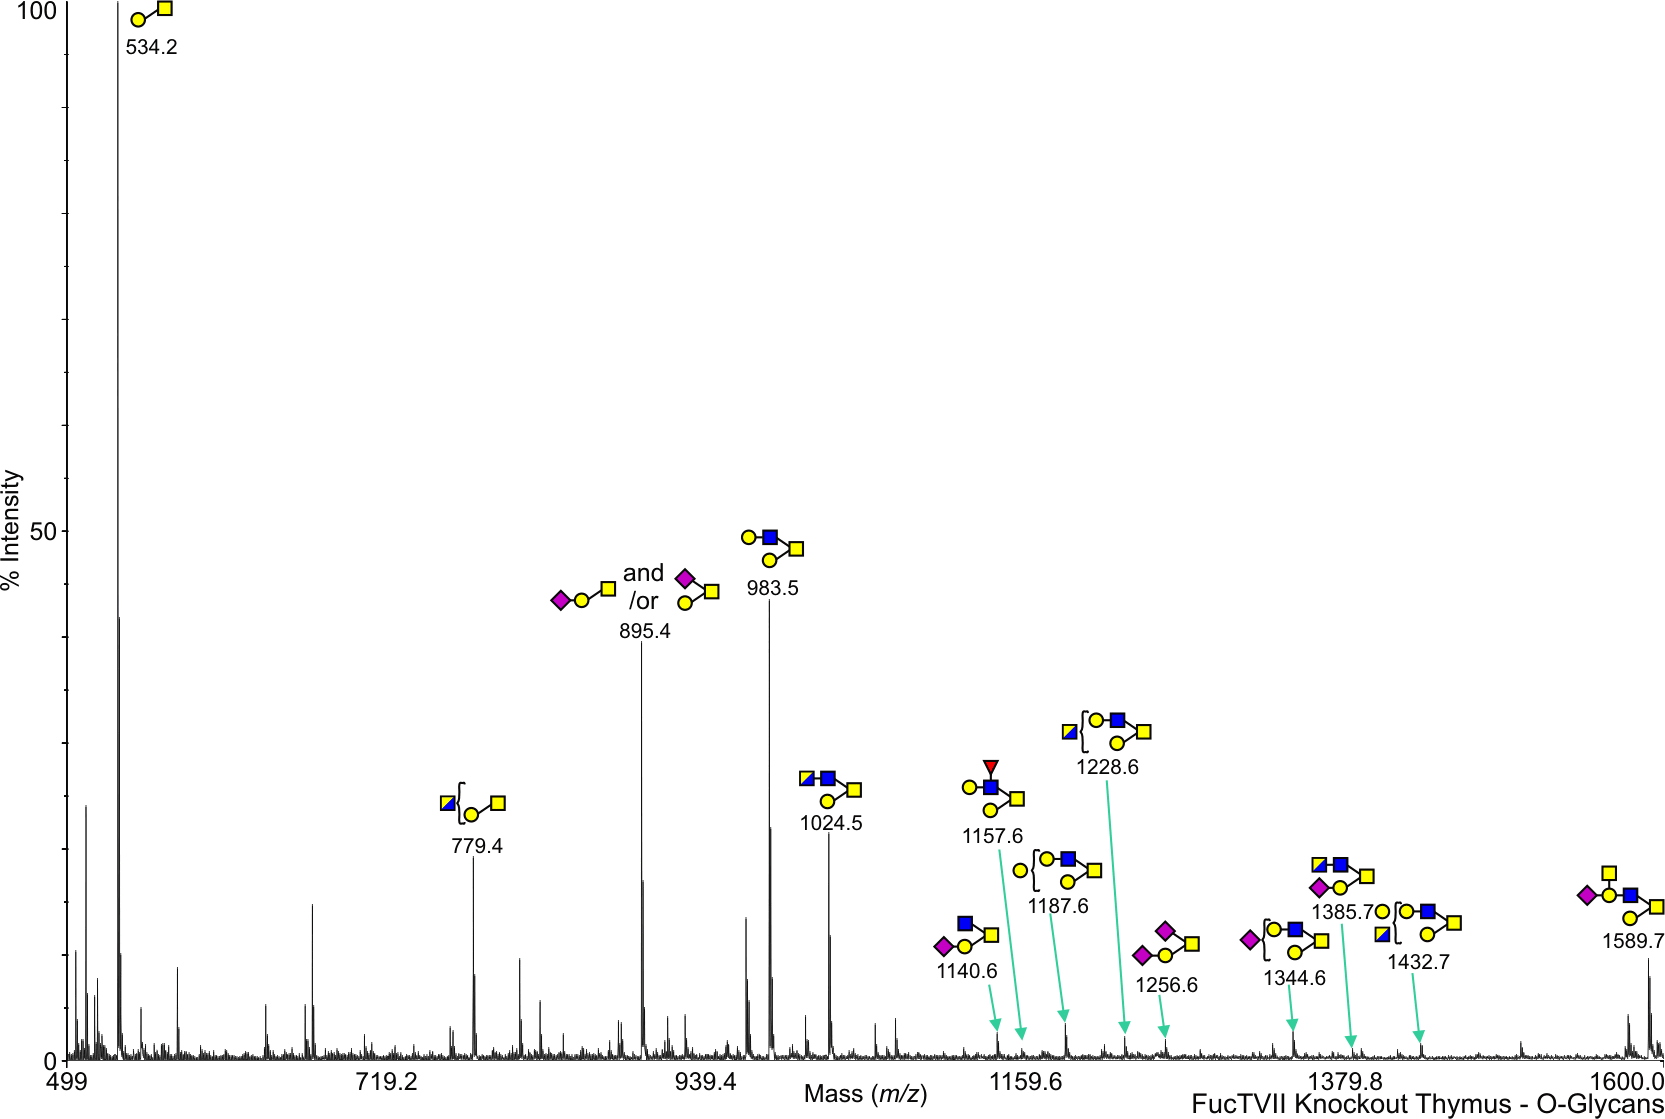
FC Mouse Fuct IV + VII Thymus O-Linked C57BL/6 View experimental details      
   
View Mass Spectrum data as text      
GT Mouse Gal 3 Thymus O-Linked C57BL/6 View experimental details      
   
View Mass Spectrum data as text      
ST Mouse ST3 Gal 1 Thymus O-Linked C57BL/6 View experimental details      
   
View Mass Spectrum data as text      
MG Mouse Core 2 GlcNAcT Thymus O-Linked C57BL/6 View experimental details      
   
View Mass Spectrum data as text      
Mouse CT GalNAcT Thymus O-Linked C57BL/6 View experimental details      
   
View Mass Spectrum data as text      
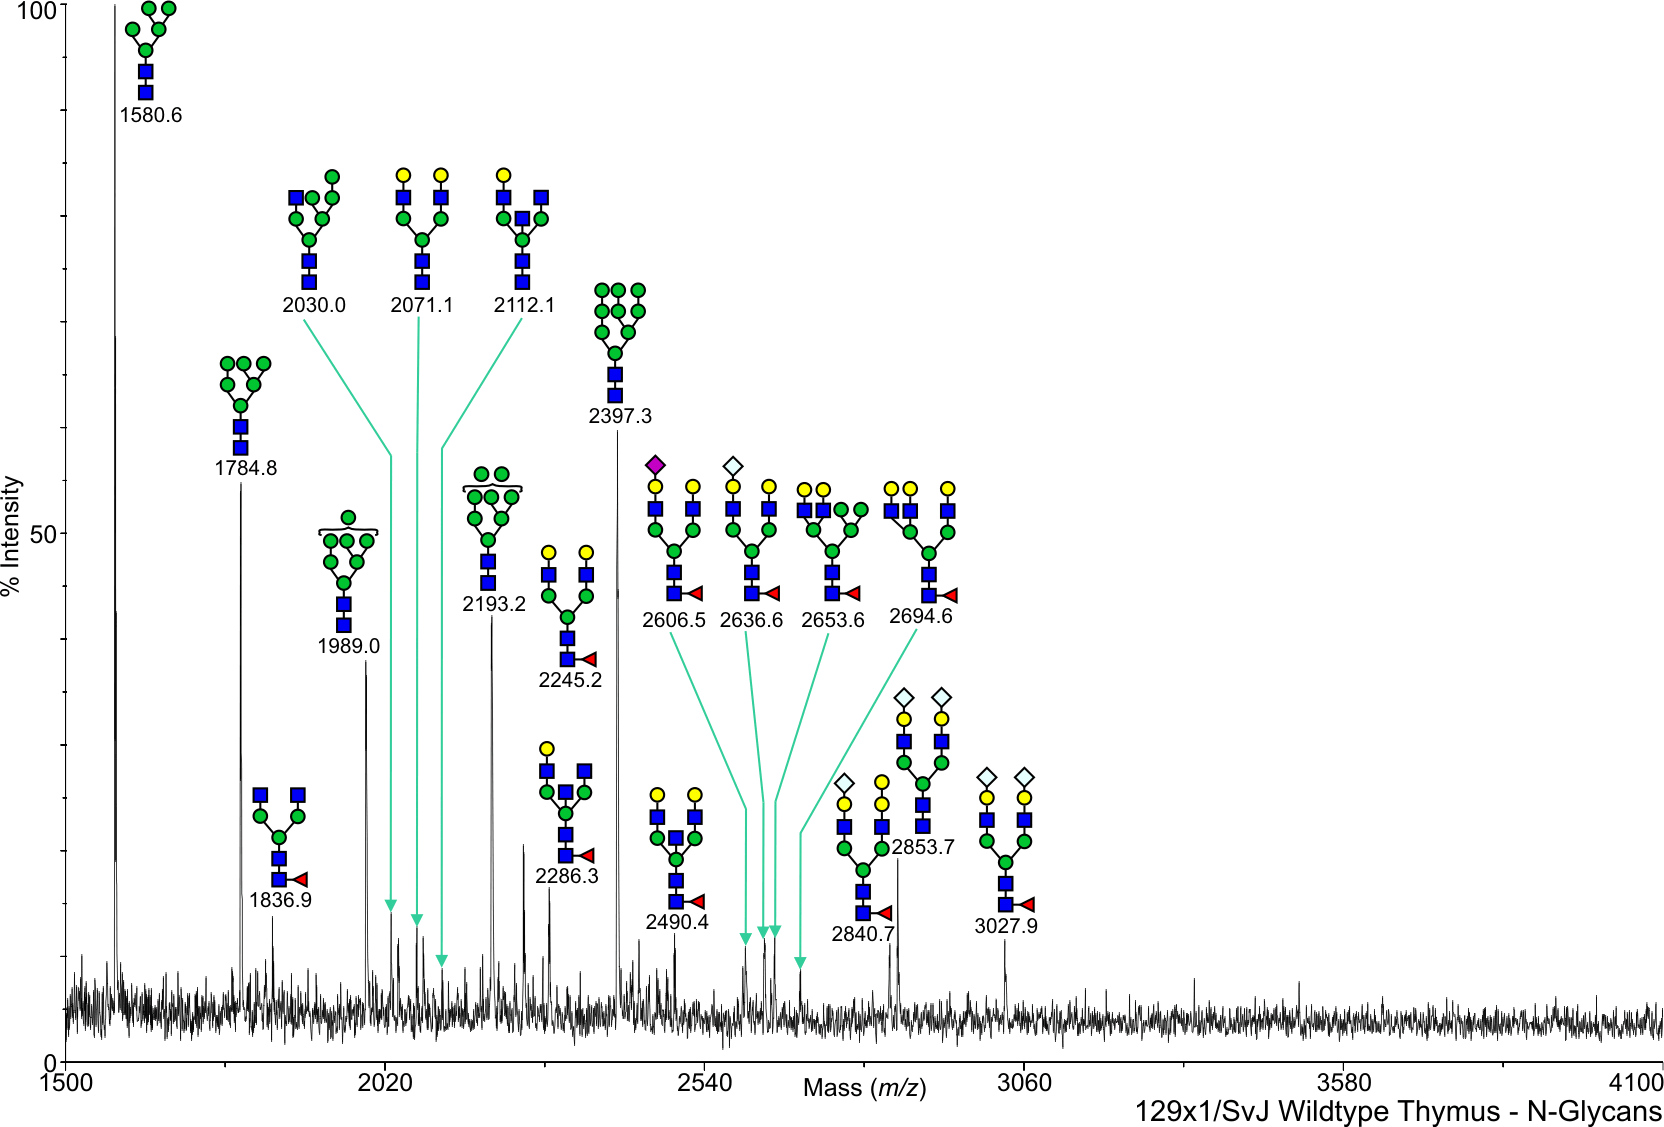
Mouse Wild Type Thymus N-Linked 129x1SvJ View experimental details      
Annotated file in JPG format Annotated file in PDF format
View Mass Spectrum data as text View Mass Peak file   Interactive Mass Spectrum Viewer
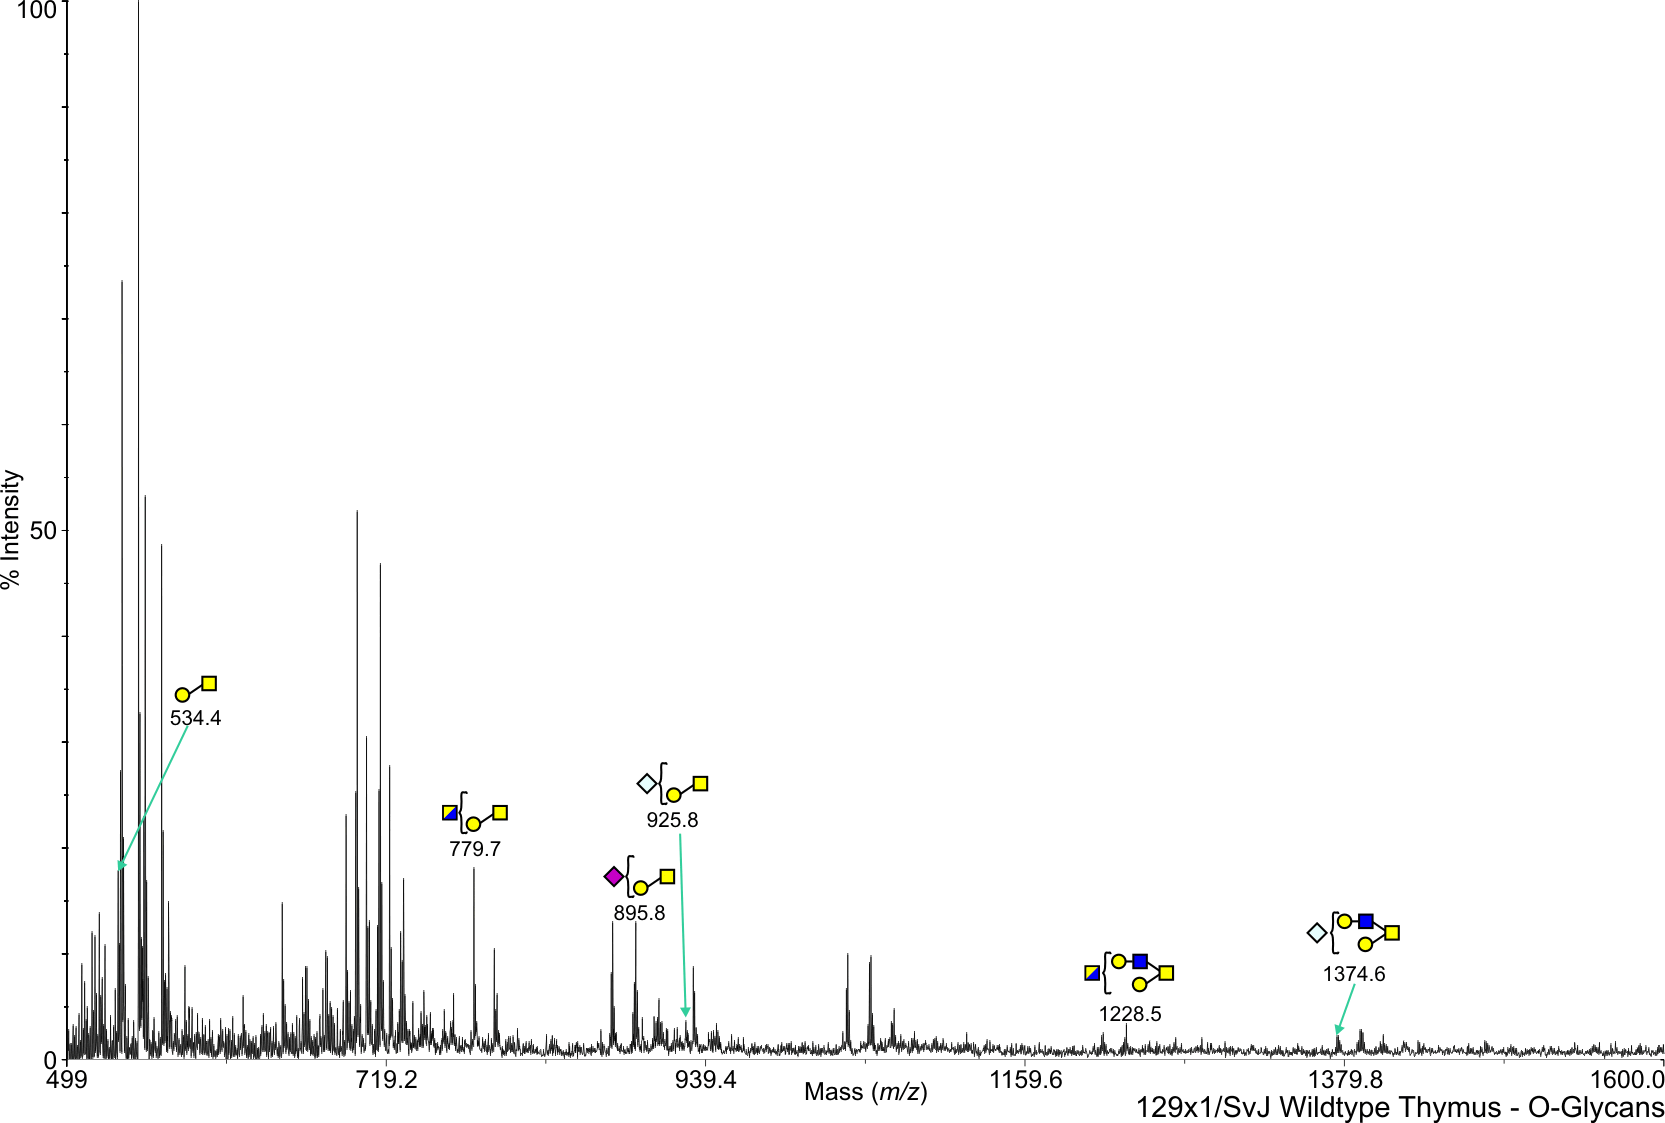
Mouse Wild Type Thymus O-Linked 129x1SvJ View experimental details      
Annotated file in JPG format Annotated file in PDF format
View Mass Spectrum data as text View Mass Peak file   Interactive Mass Spectrum Viewer
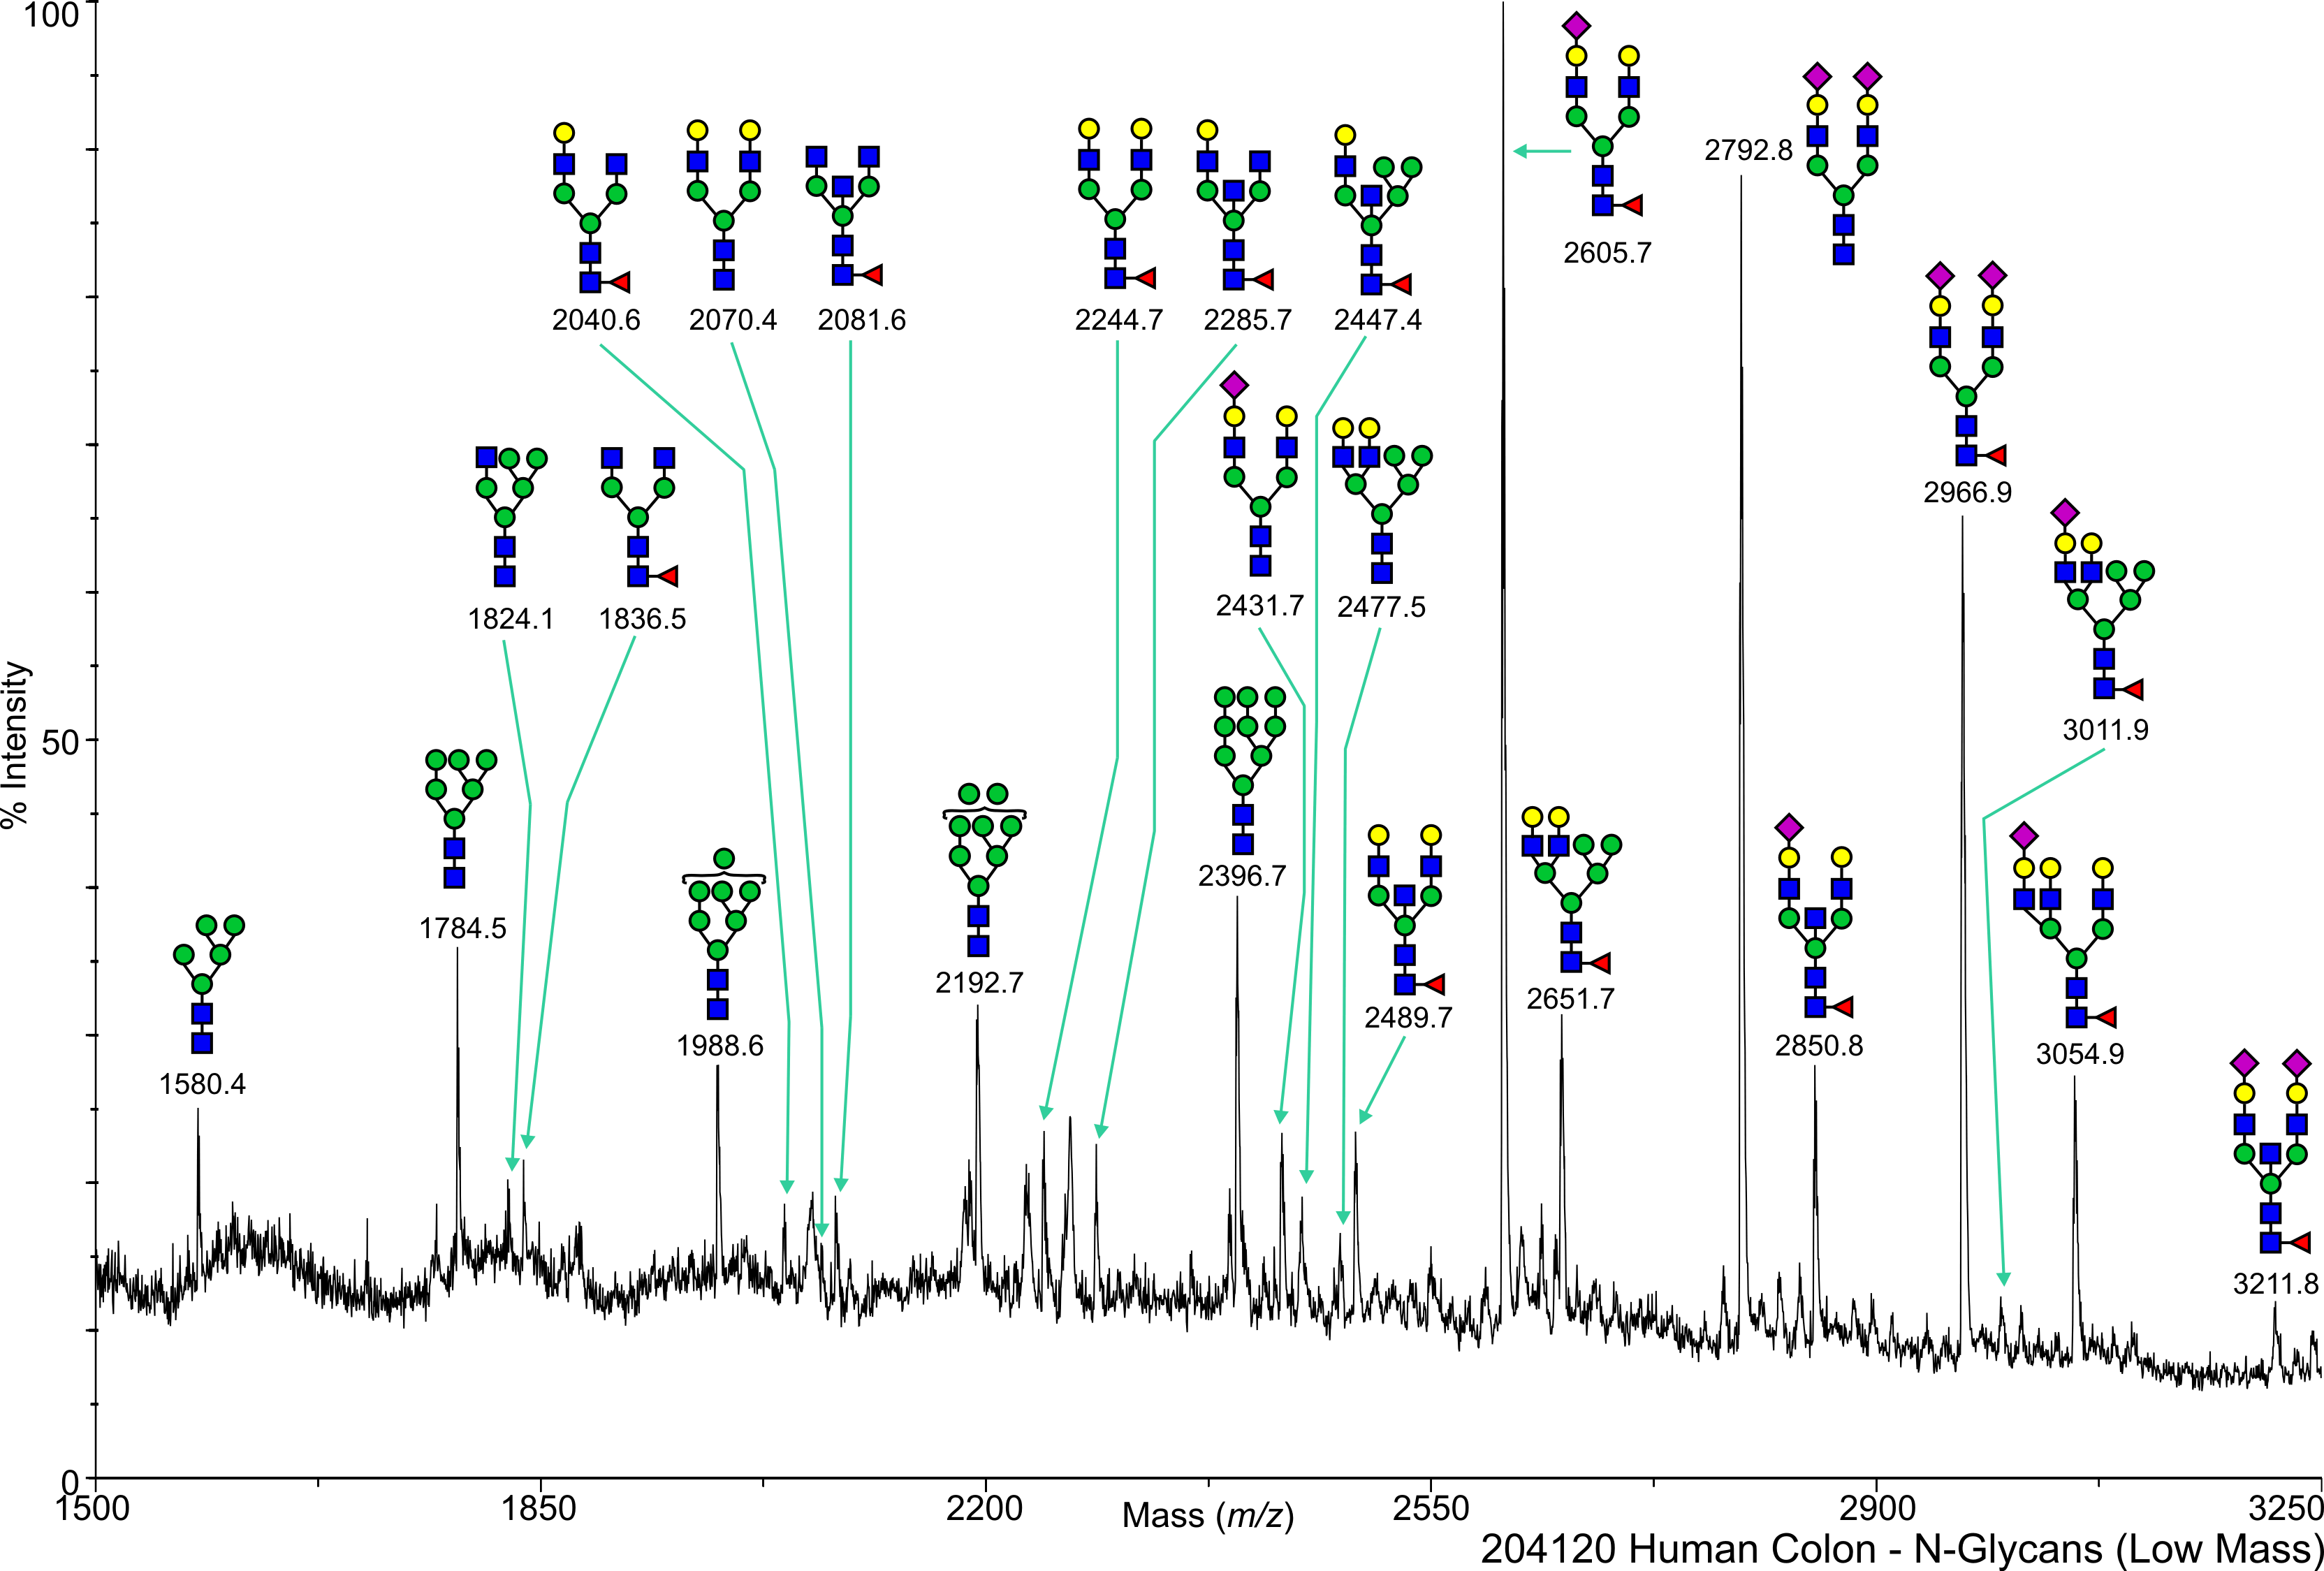
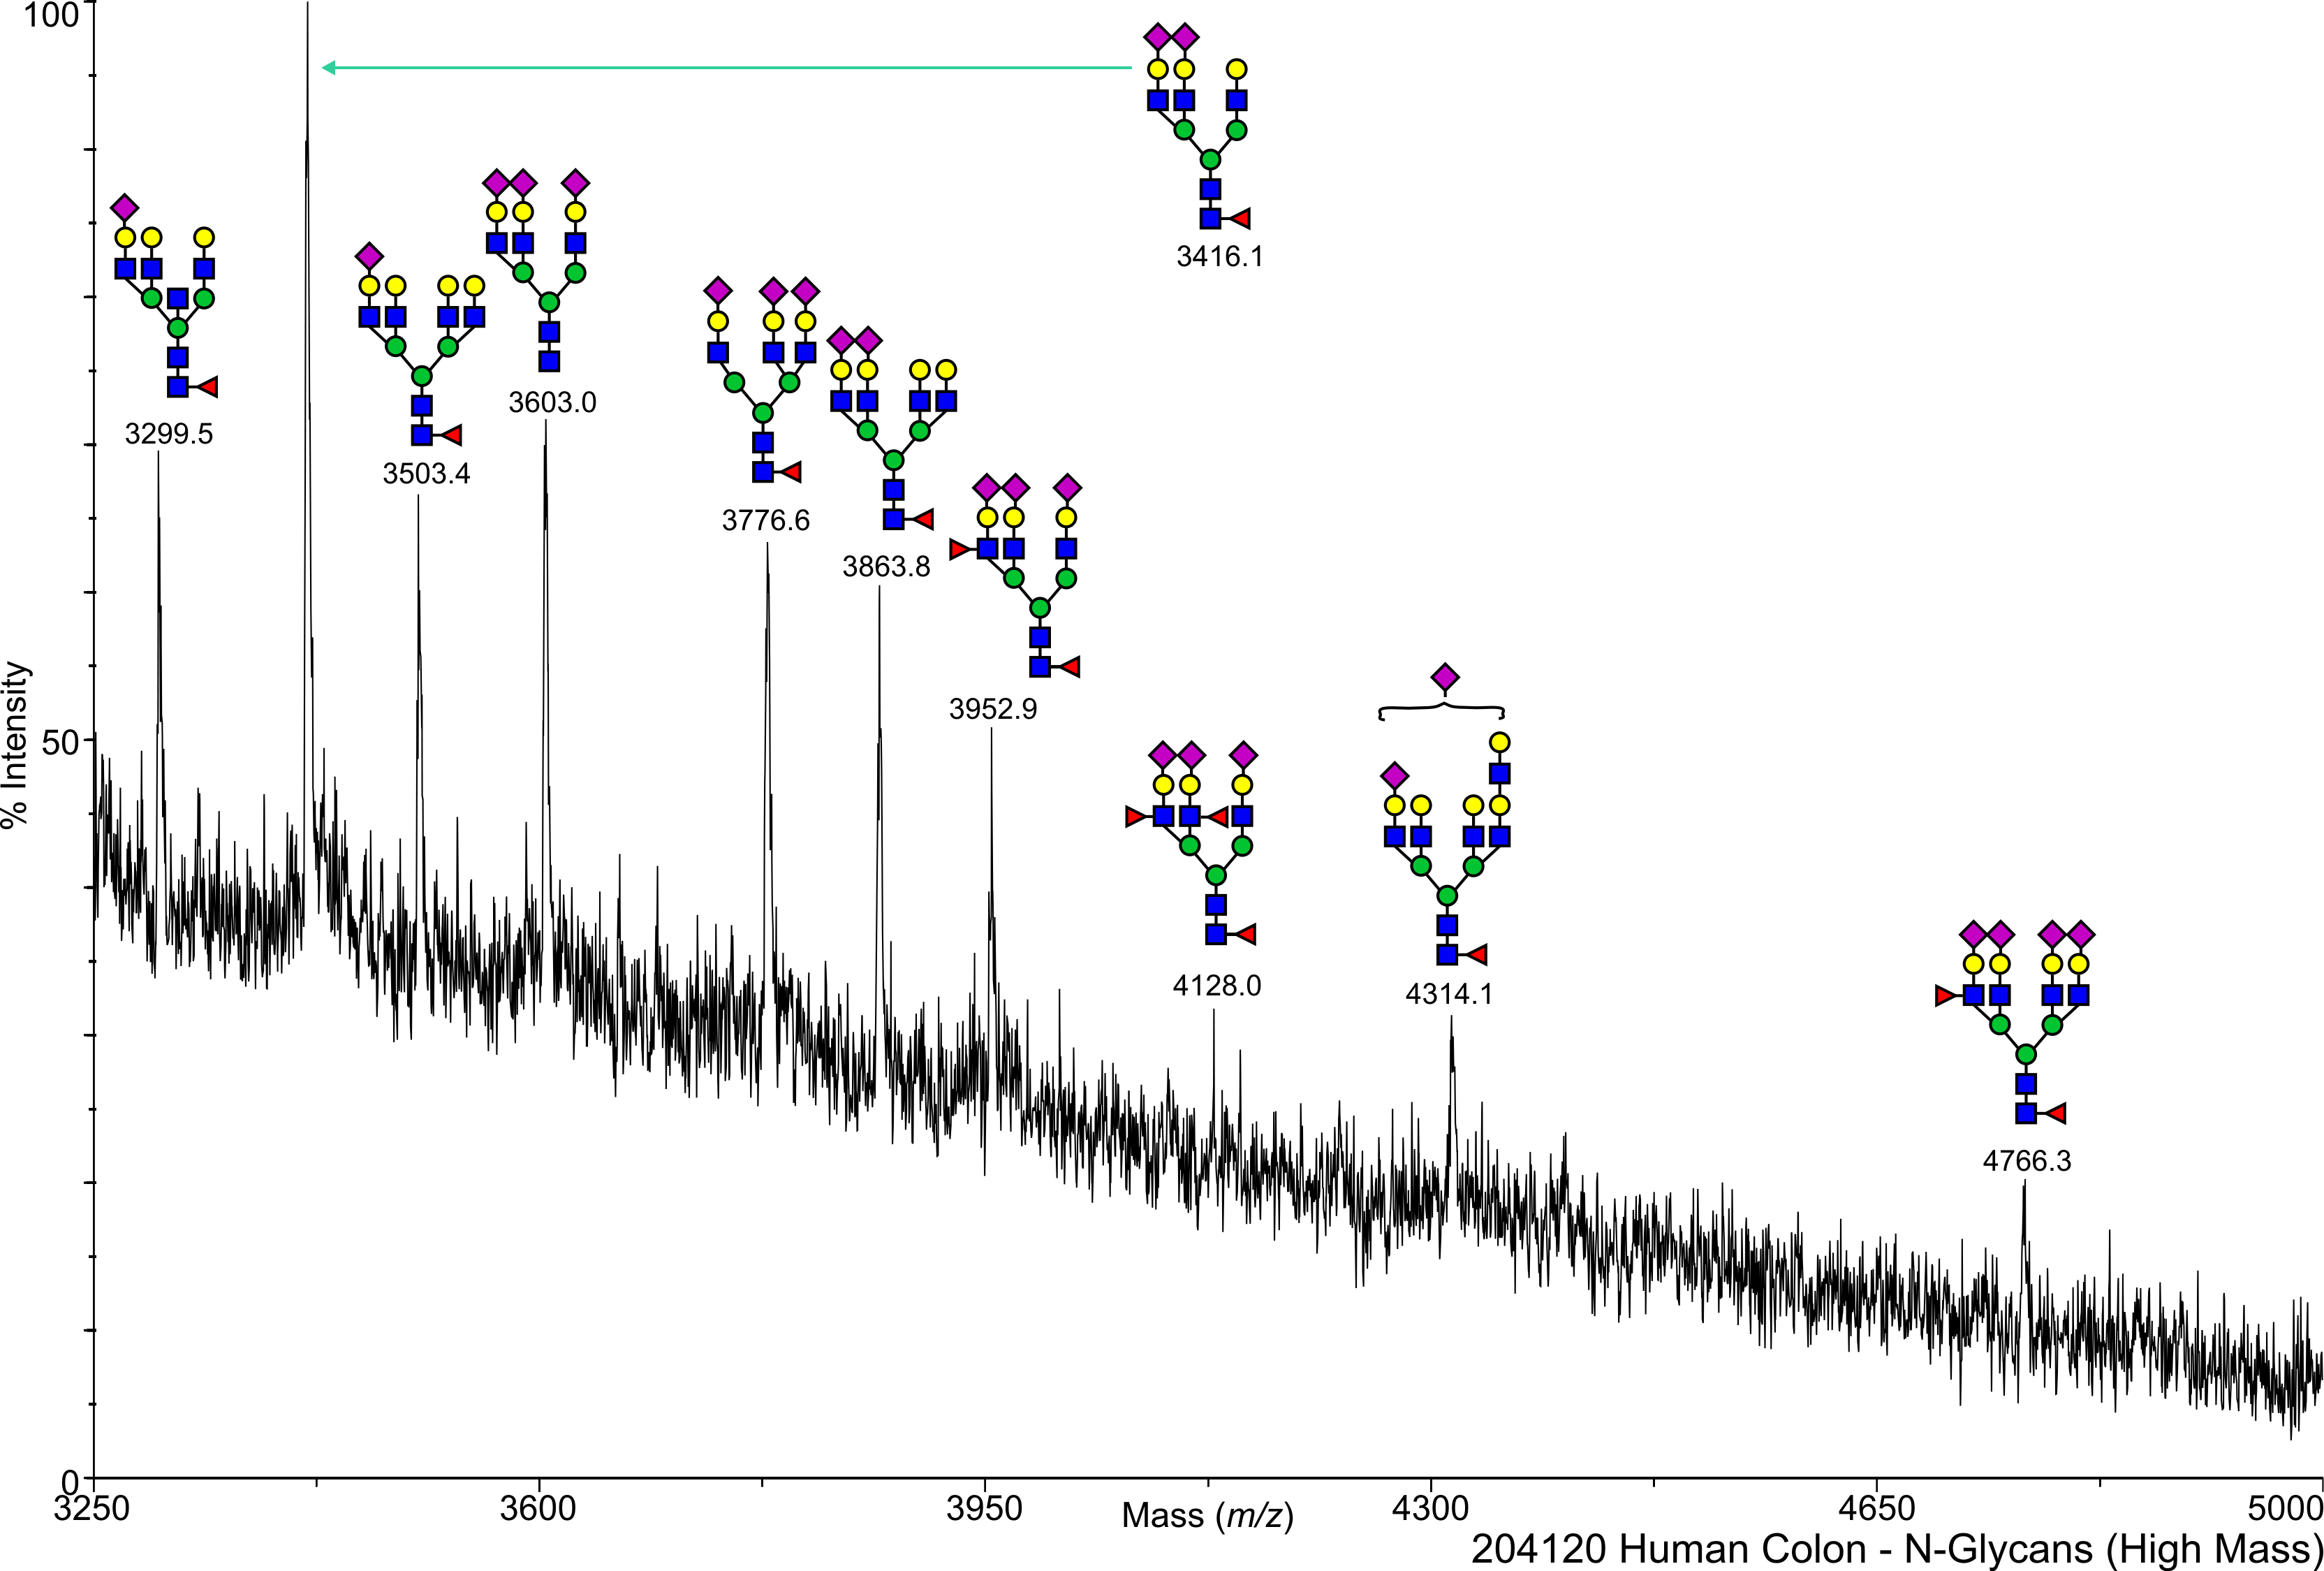
Human Colon N-Linked 204120 Salomon,Daniel View experimental details      
Annotated file for lower mass range in JPG formatAnnotated file for higher mass range in JPG format Annotated file for lower mass range in PDF formatAnnotated file for higher mass range in PDF format
       
cfg_rRequest_1691
Human Colon N-Linked 204151 Salomon,Daniel View experimental details      
   
       
cfg_rRequest_1691
Human Colon O-Linked 204120 Salomon,Daniel View experimental details      
   
       
cfg_rRequest_1691
Human Colon O-Linked 204151 Salomon,Daniel View experimental details      
   
       
cfg_rRequest_1691
Human Heart N-Linked 204120 Salomon,Daniel View experimental details      
   
         
cfg_rRequest_1691
Human Heart N-Linked 204151 Salomon,Daniel View experimental details      
   
       
cfg_rRequest_1691
Human Heart N-Linked A002 Salomon,Daniel View experimental details      
   
       
cfg_rRequest_1691
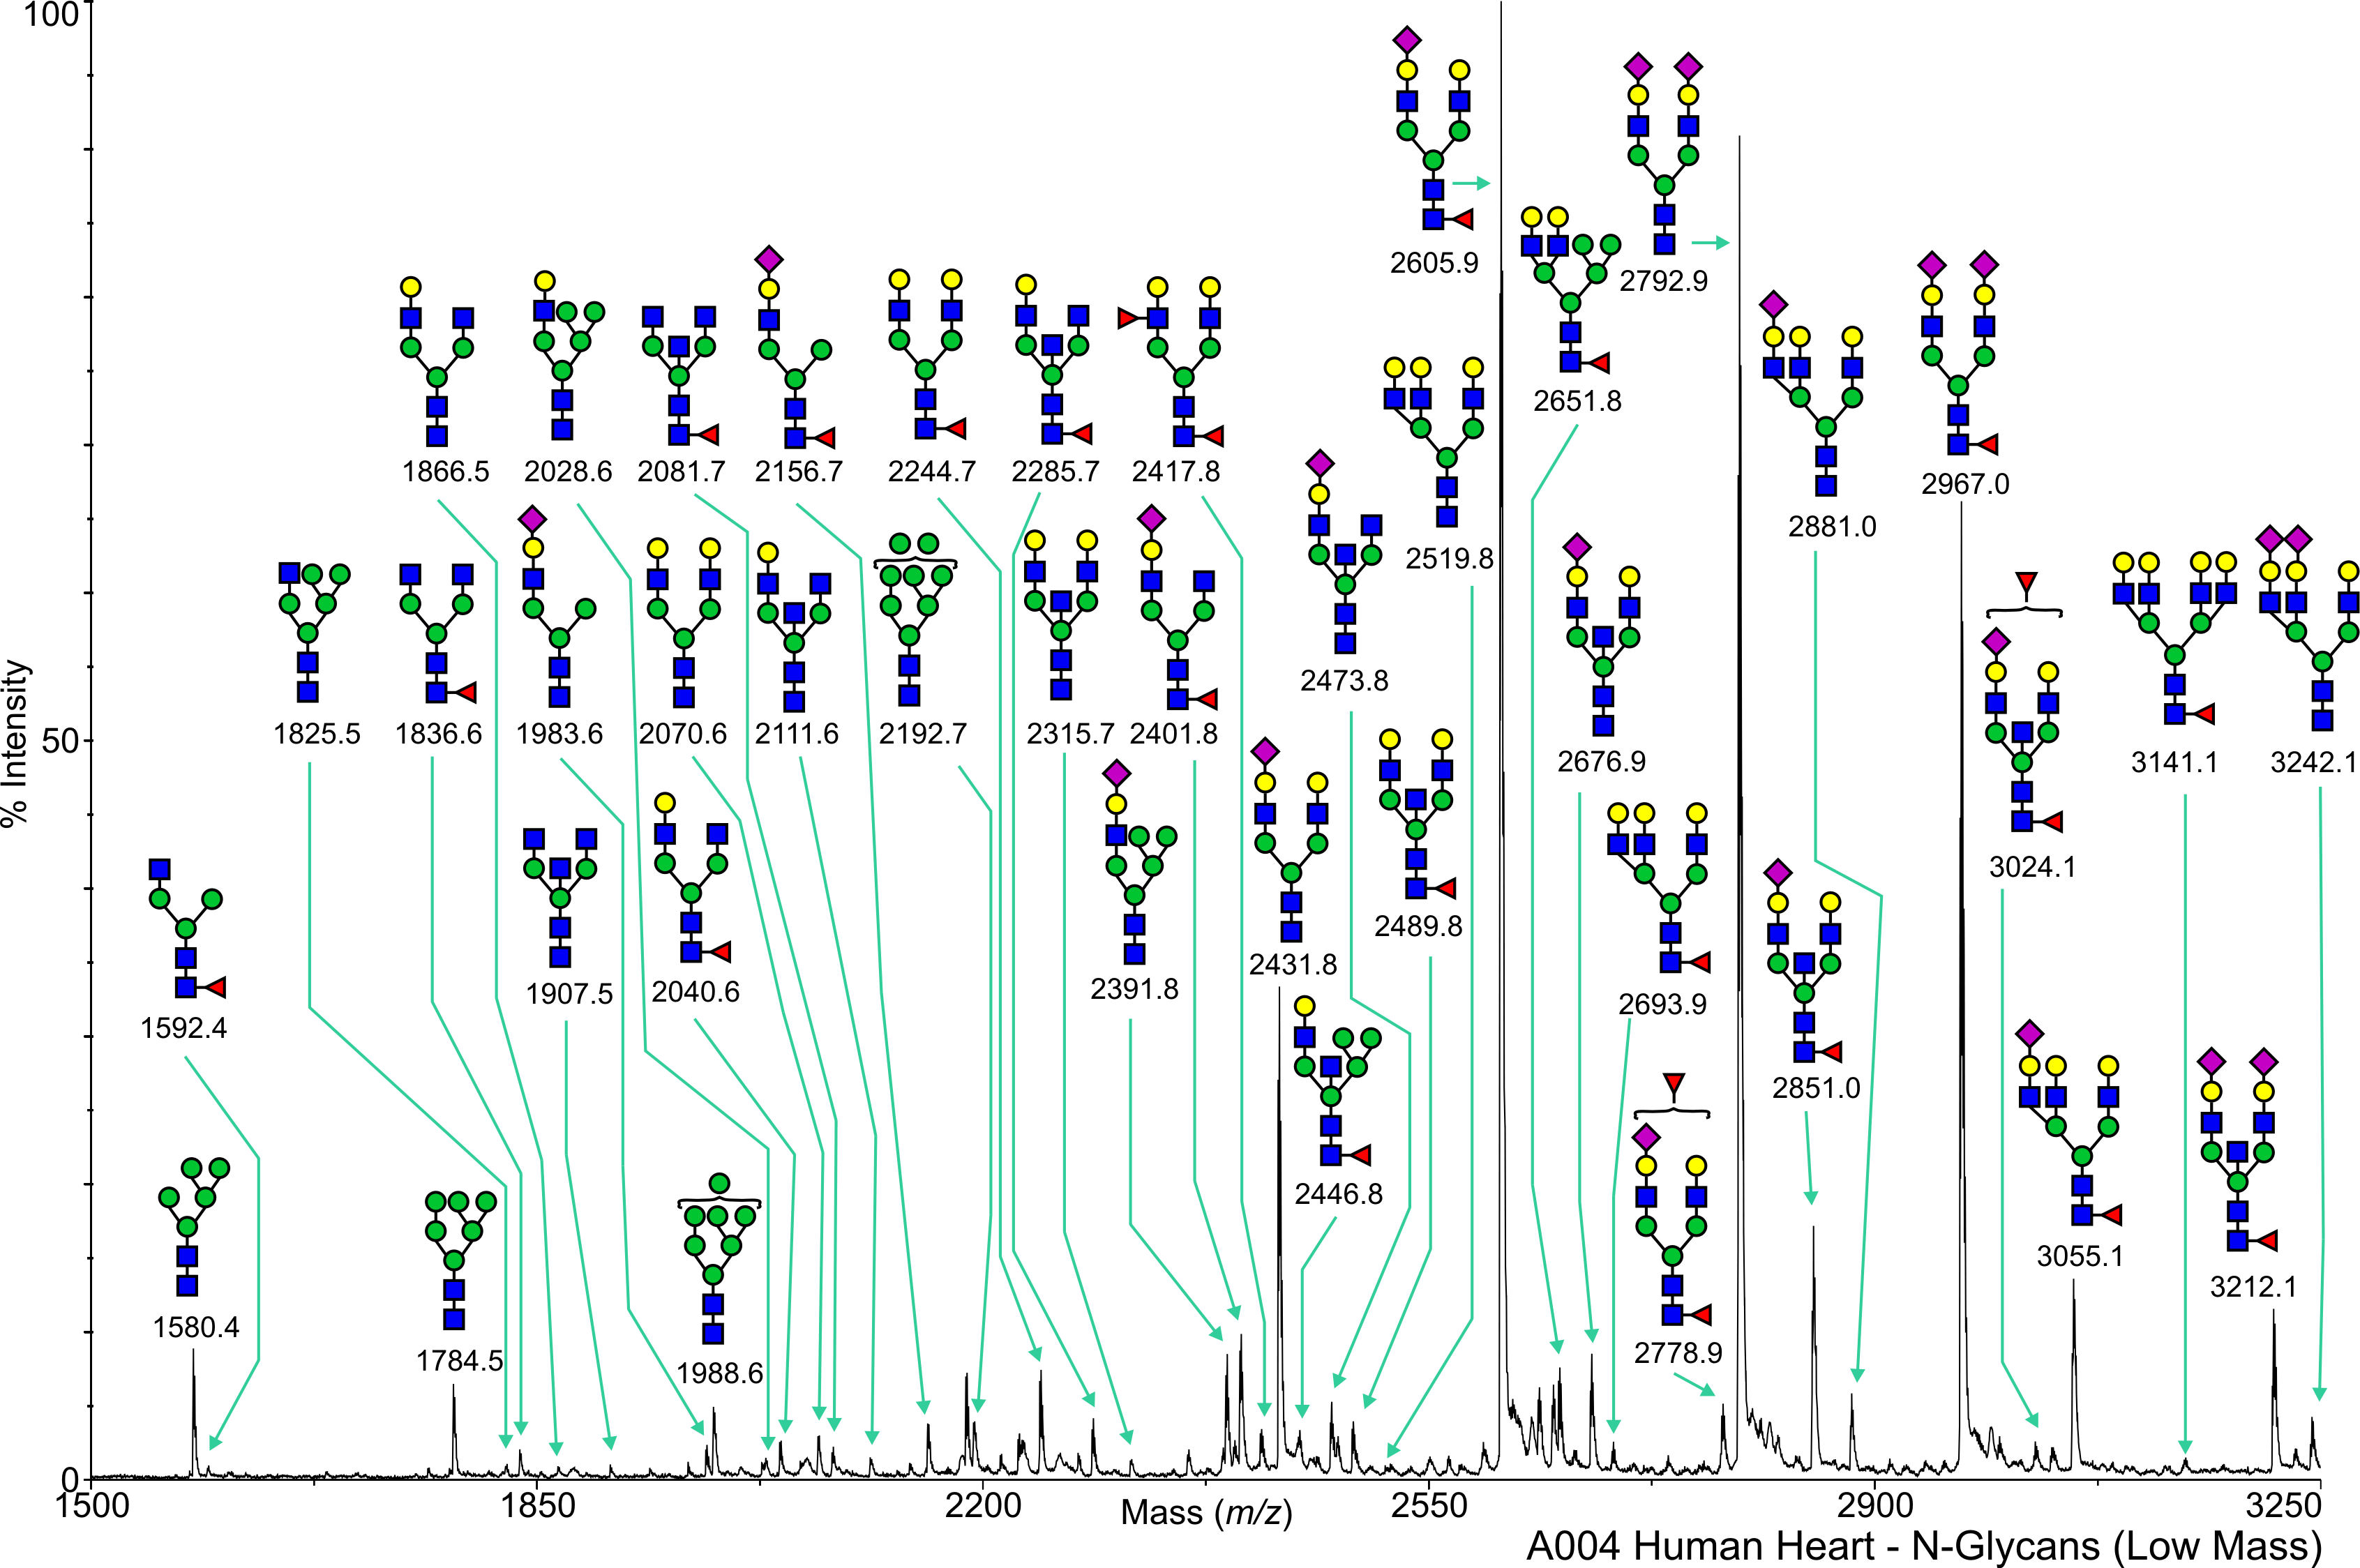
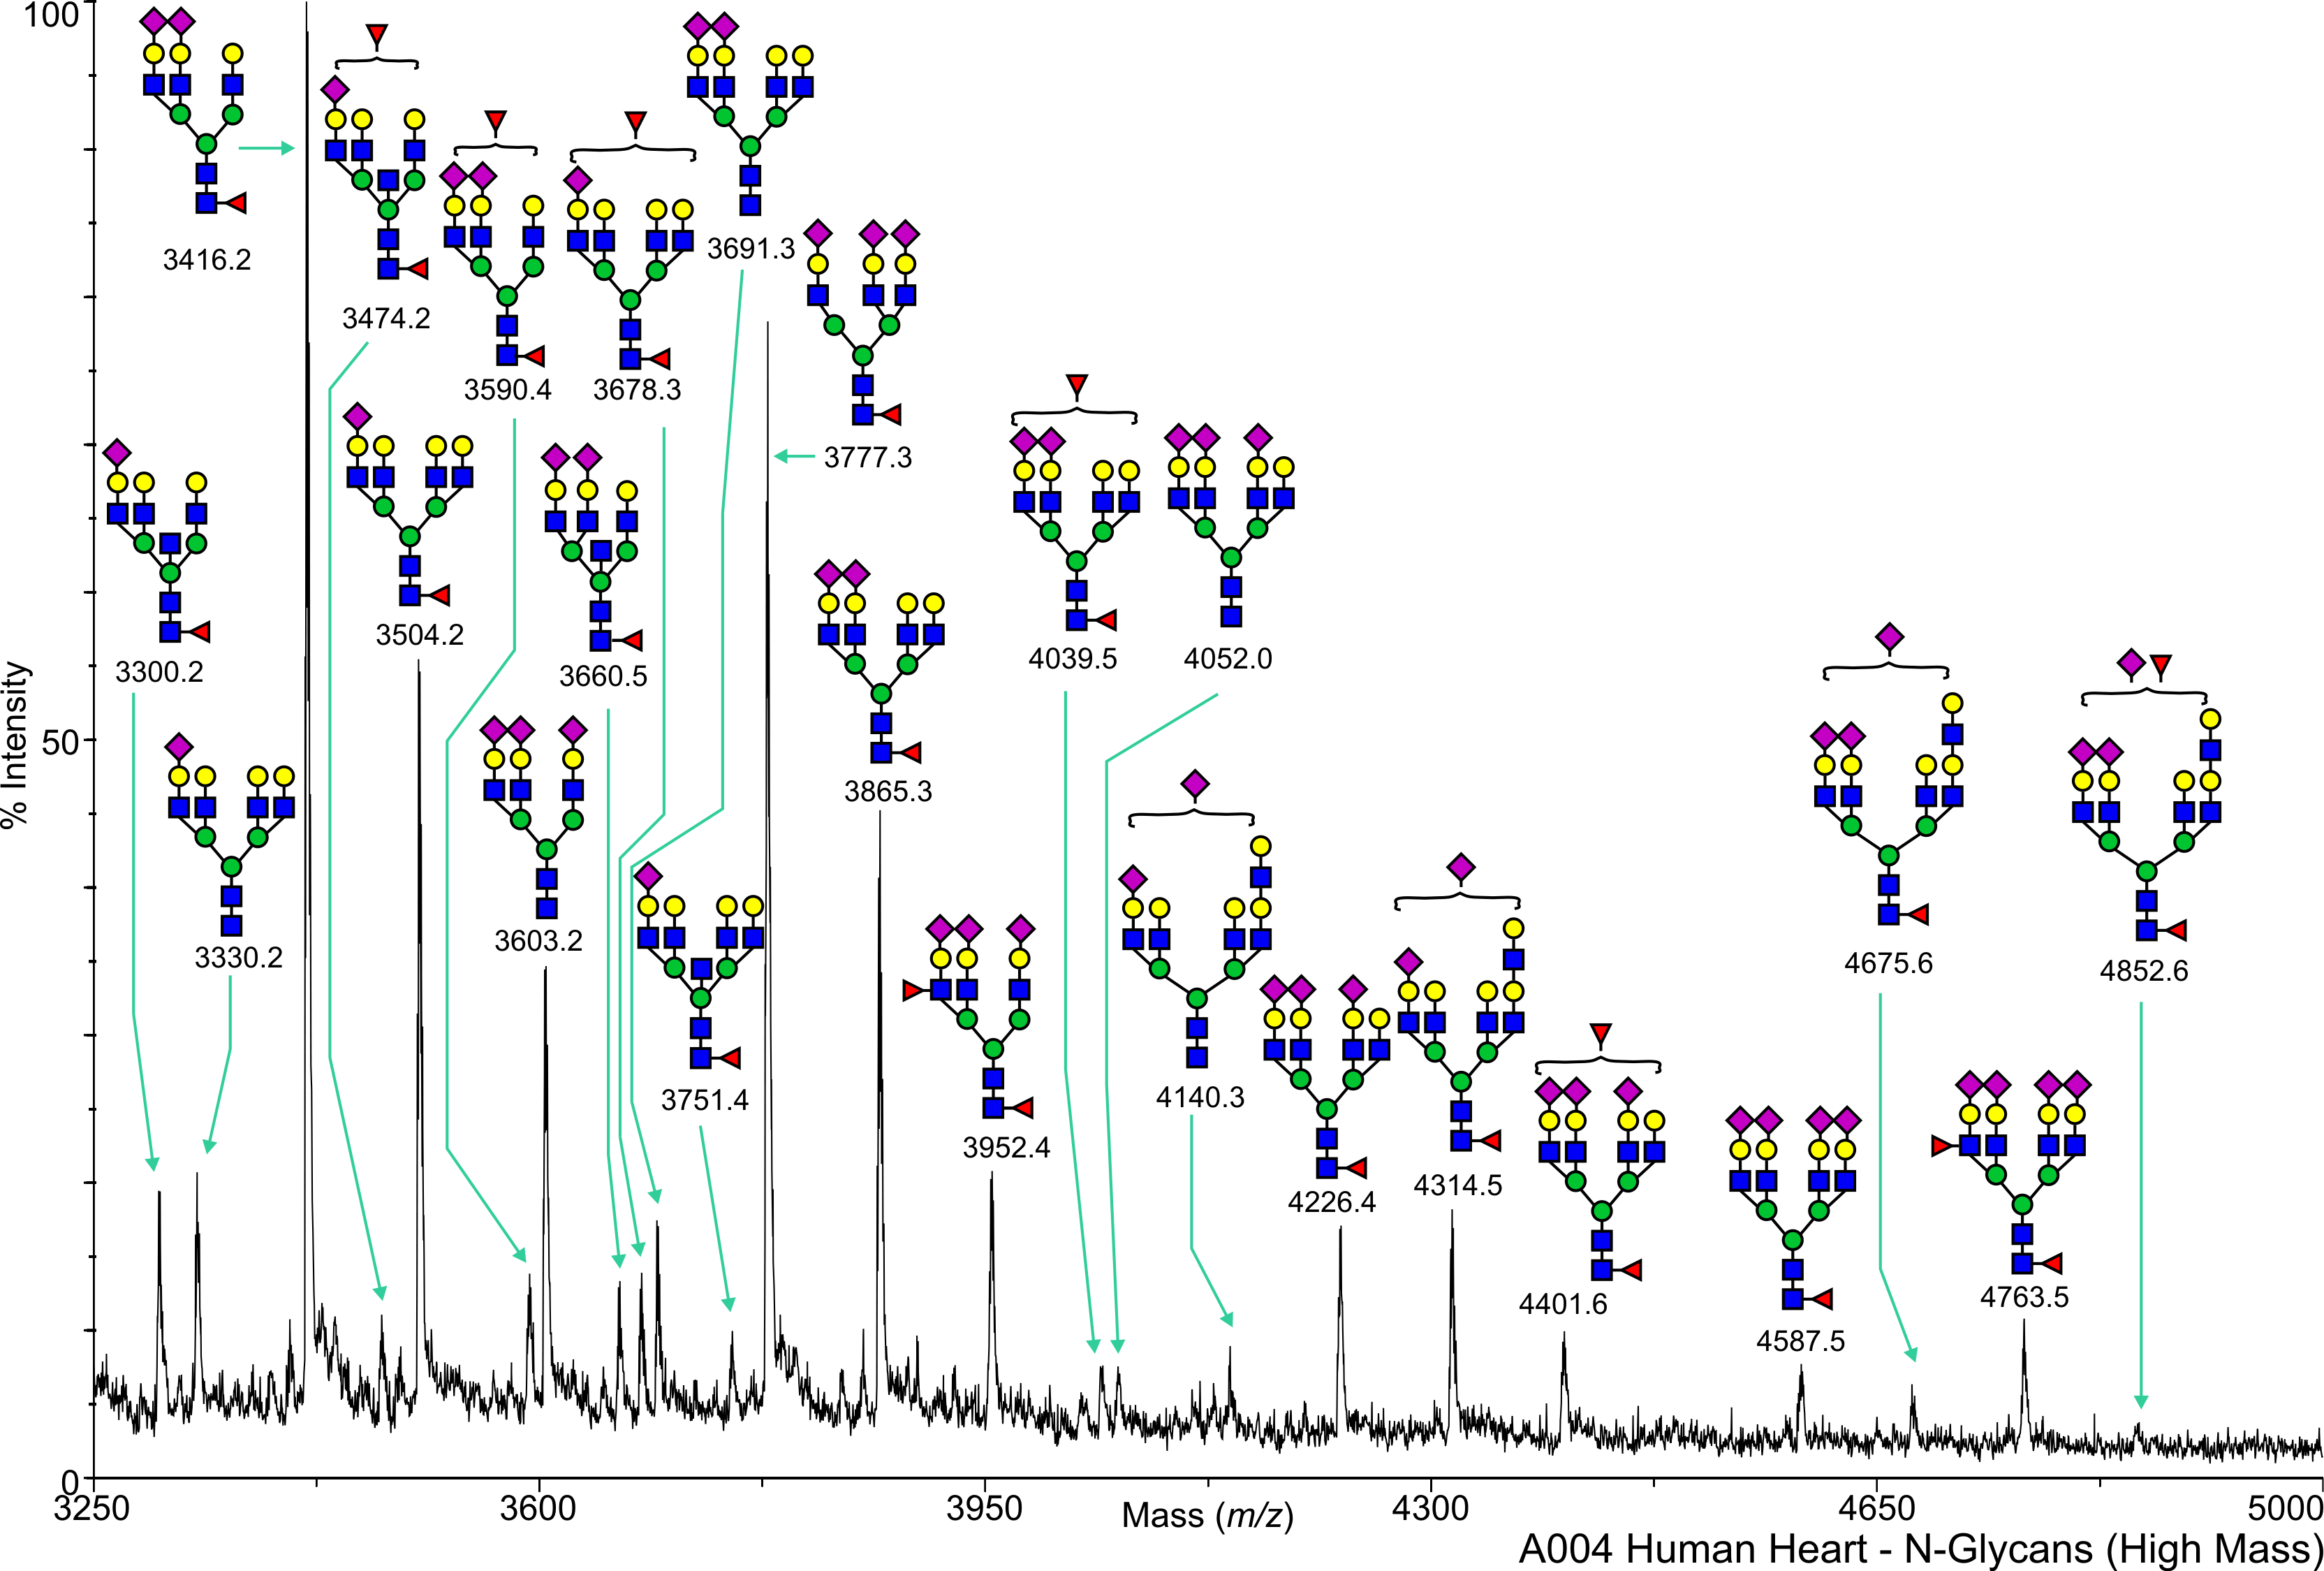
Human Heart N-Linked A004 Salomon,Daniel View experimental details      
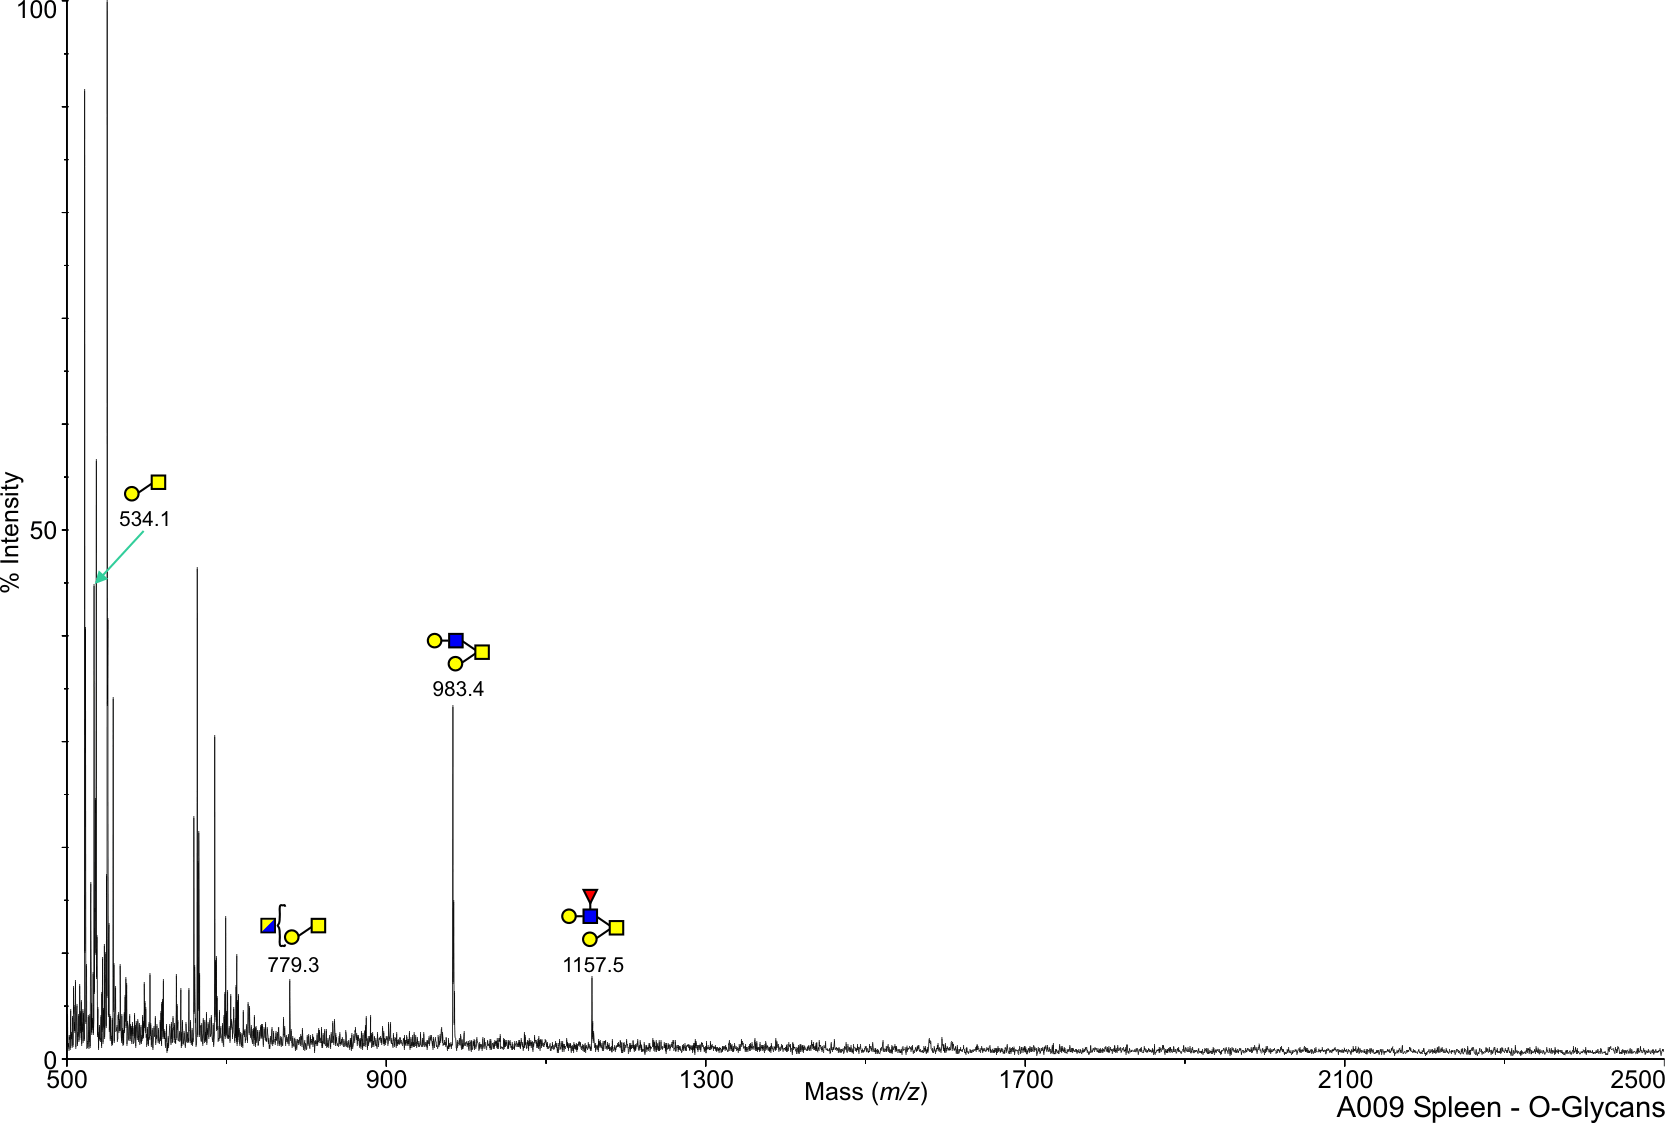
Annotated file for lower mass range in JPG formatAnnotated file for higher mass range in JPG format Annotated file for lower mass range in PDF formatAnnotated file for higher mass range in PDF format
       
cfg_rRequest_1691
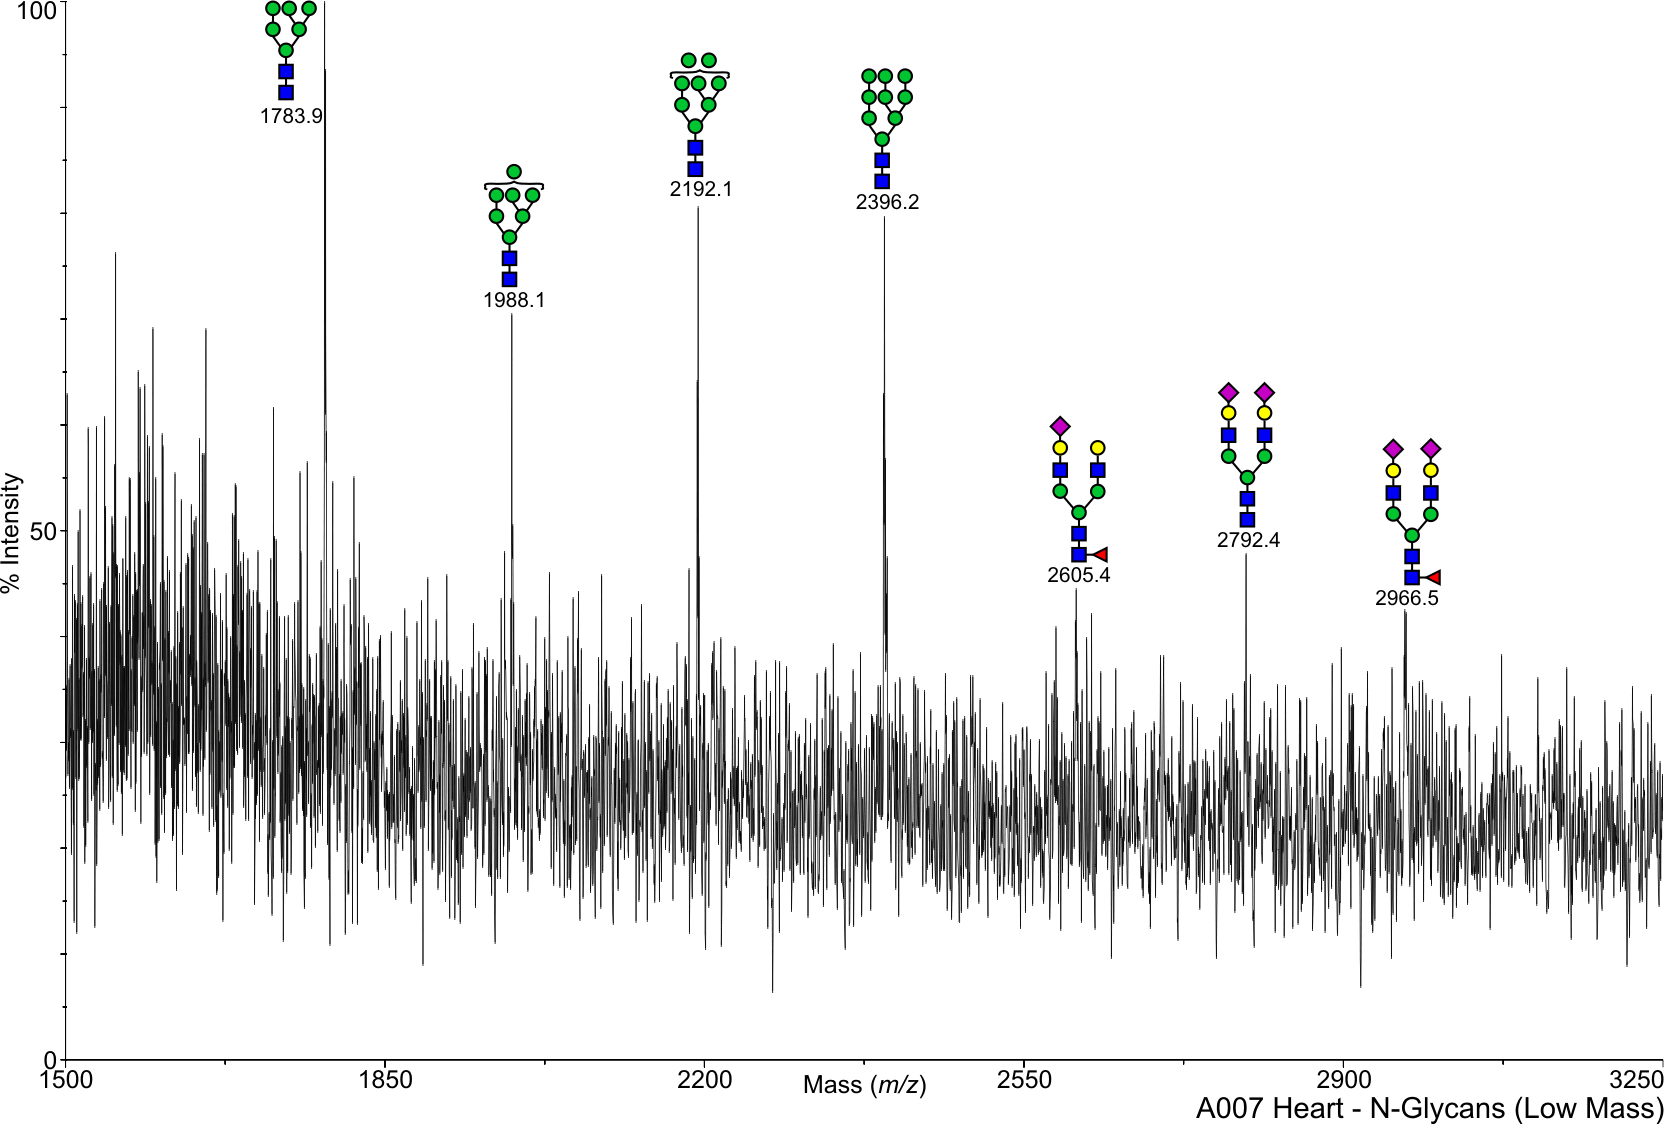
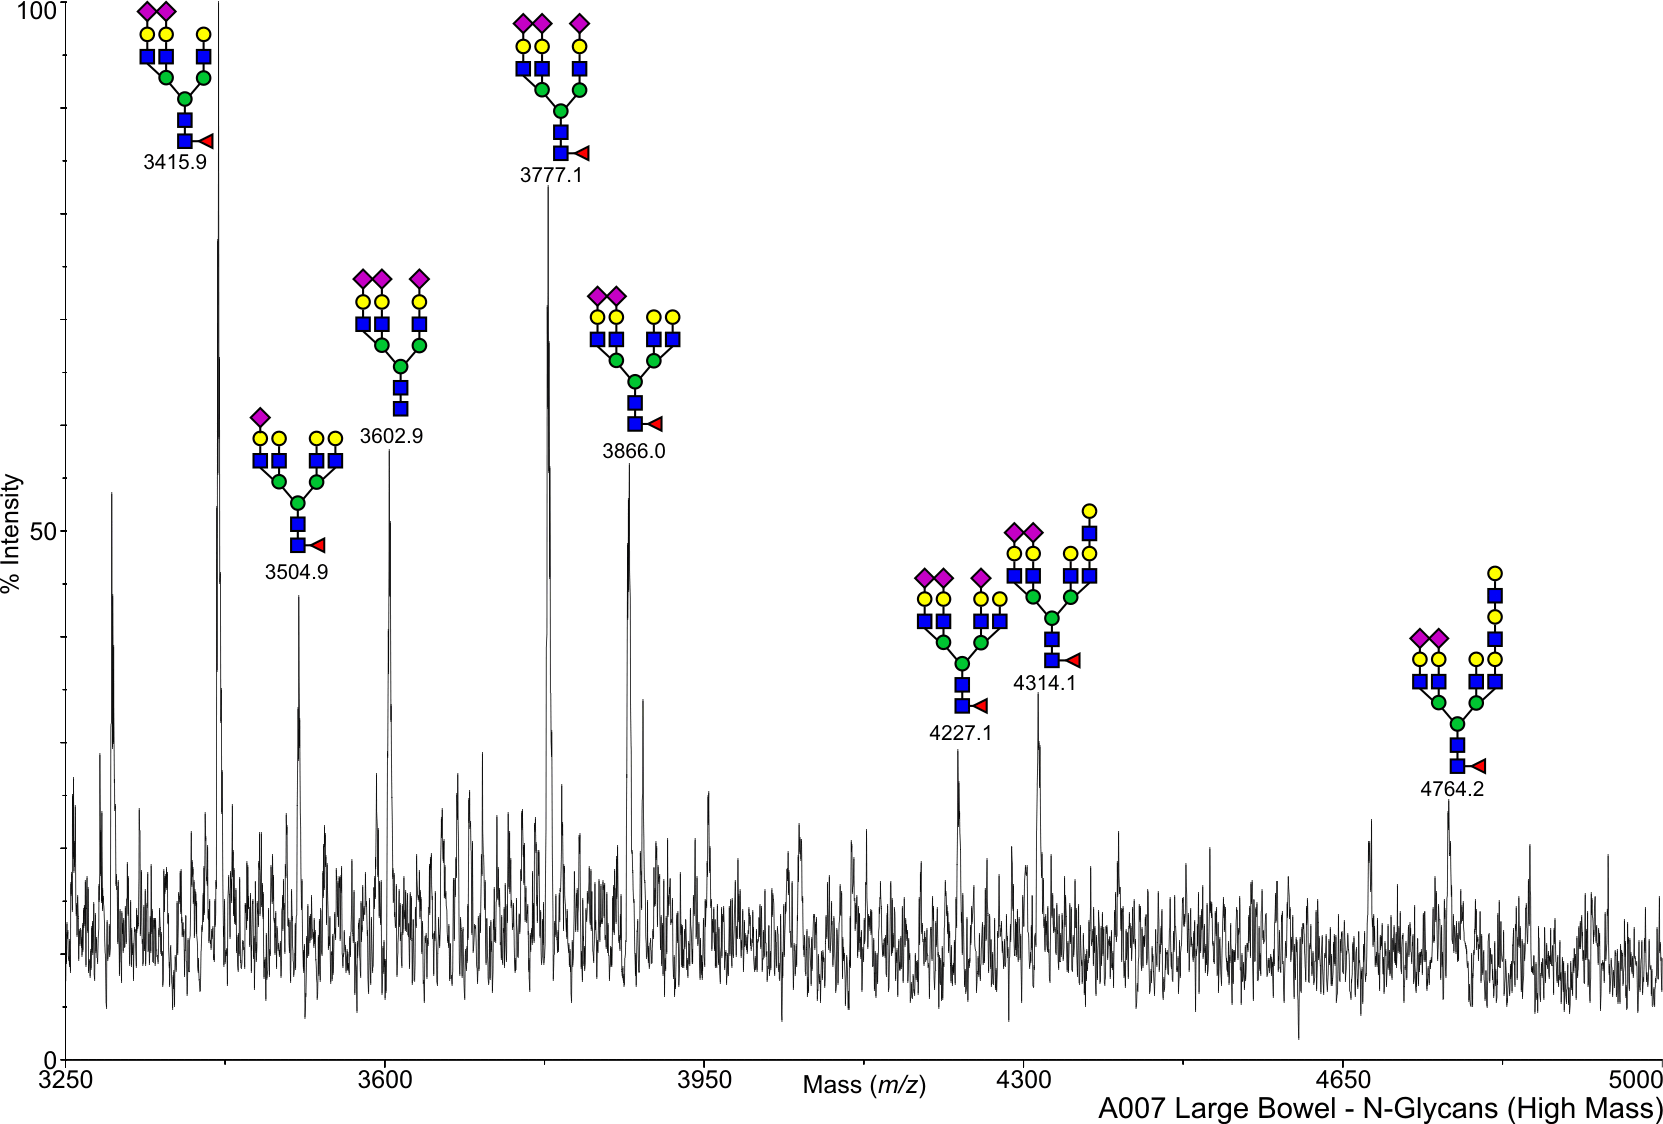
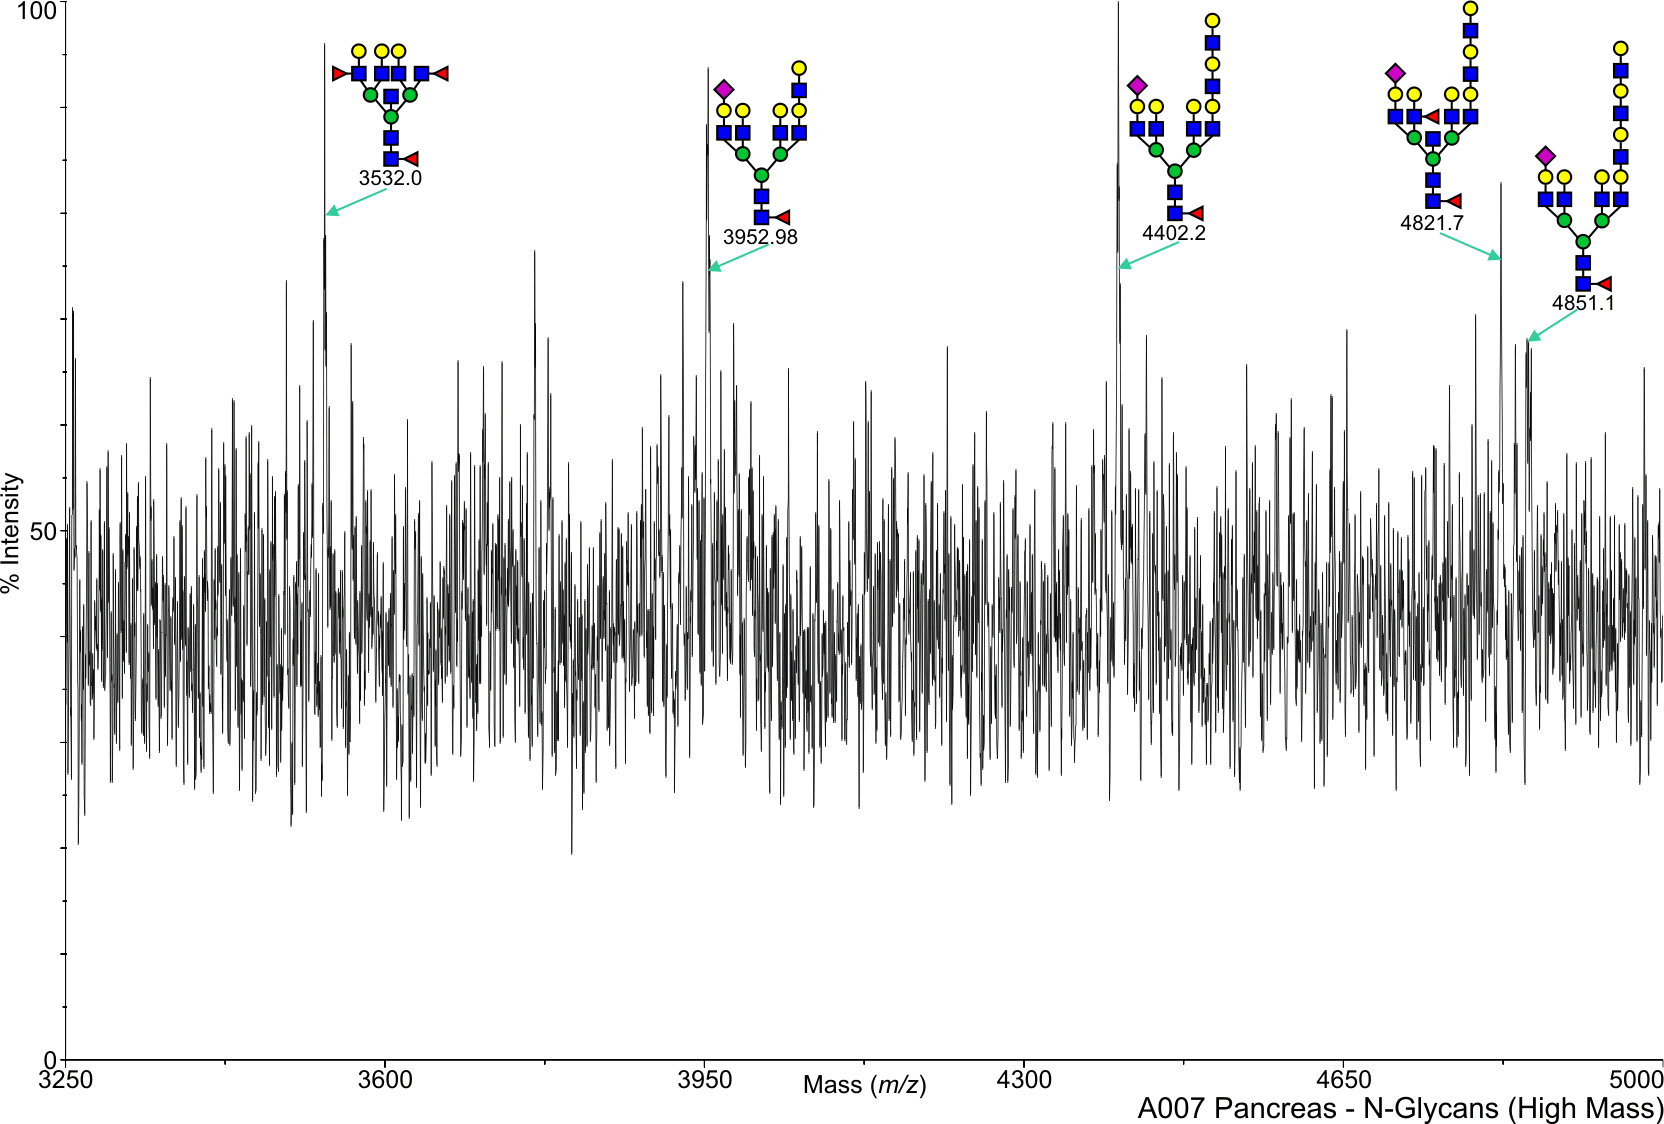
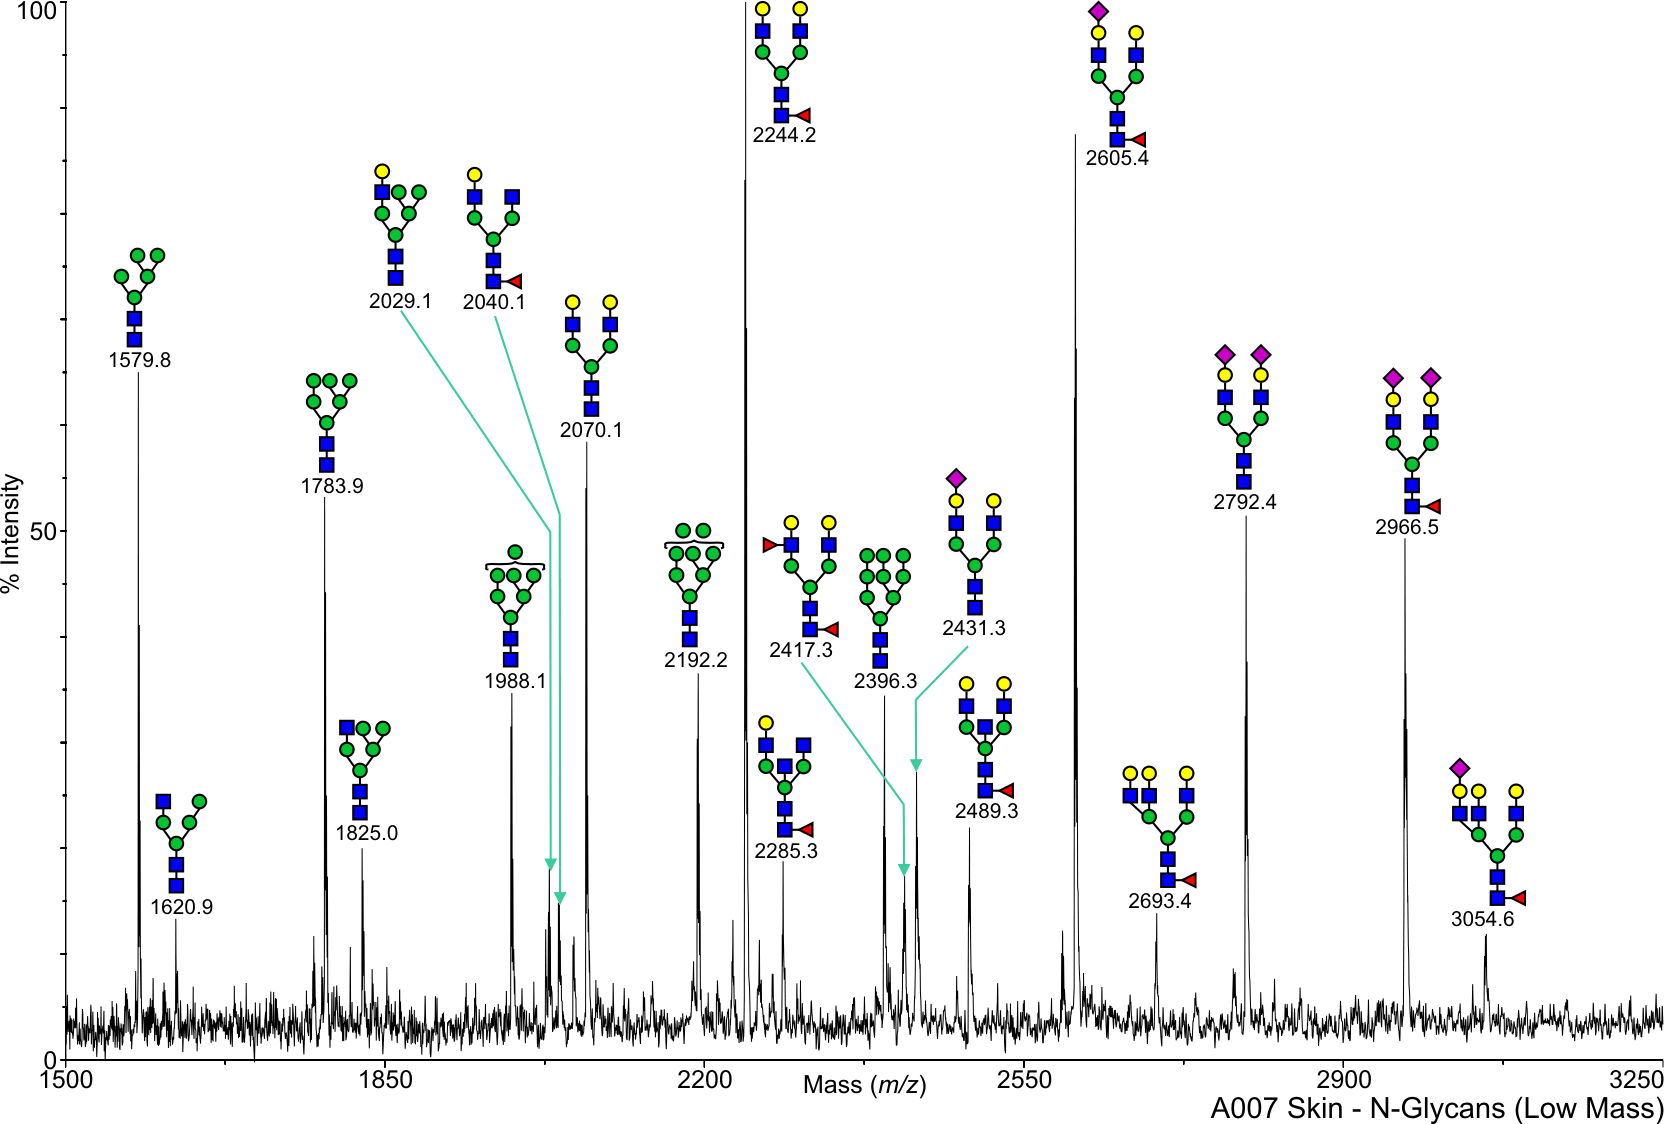
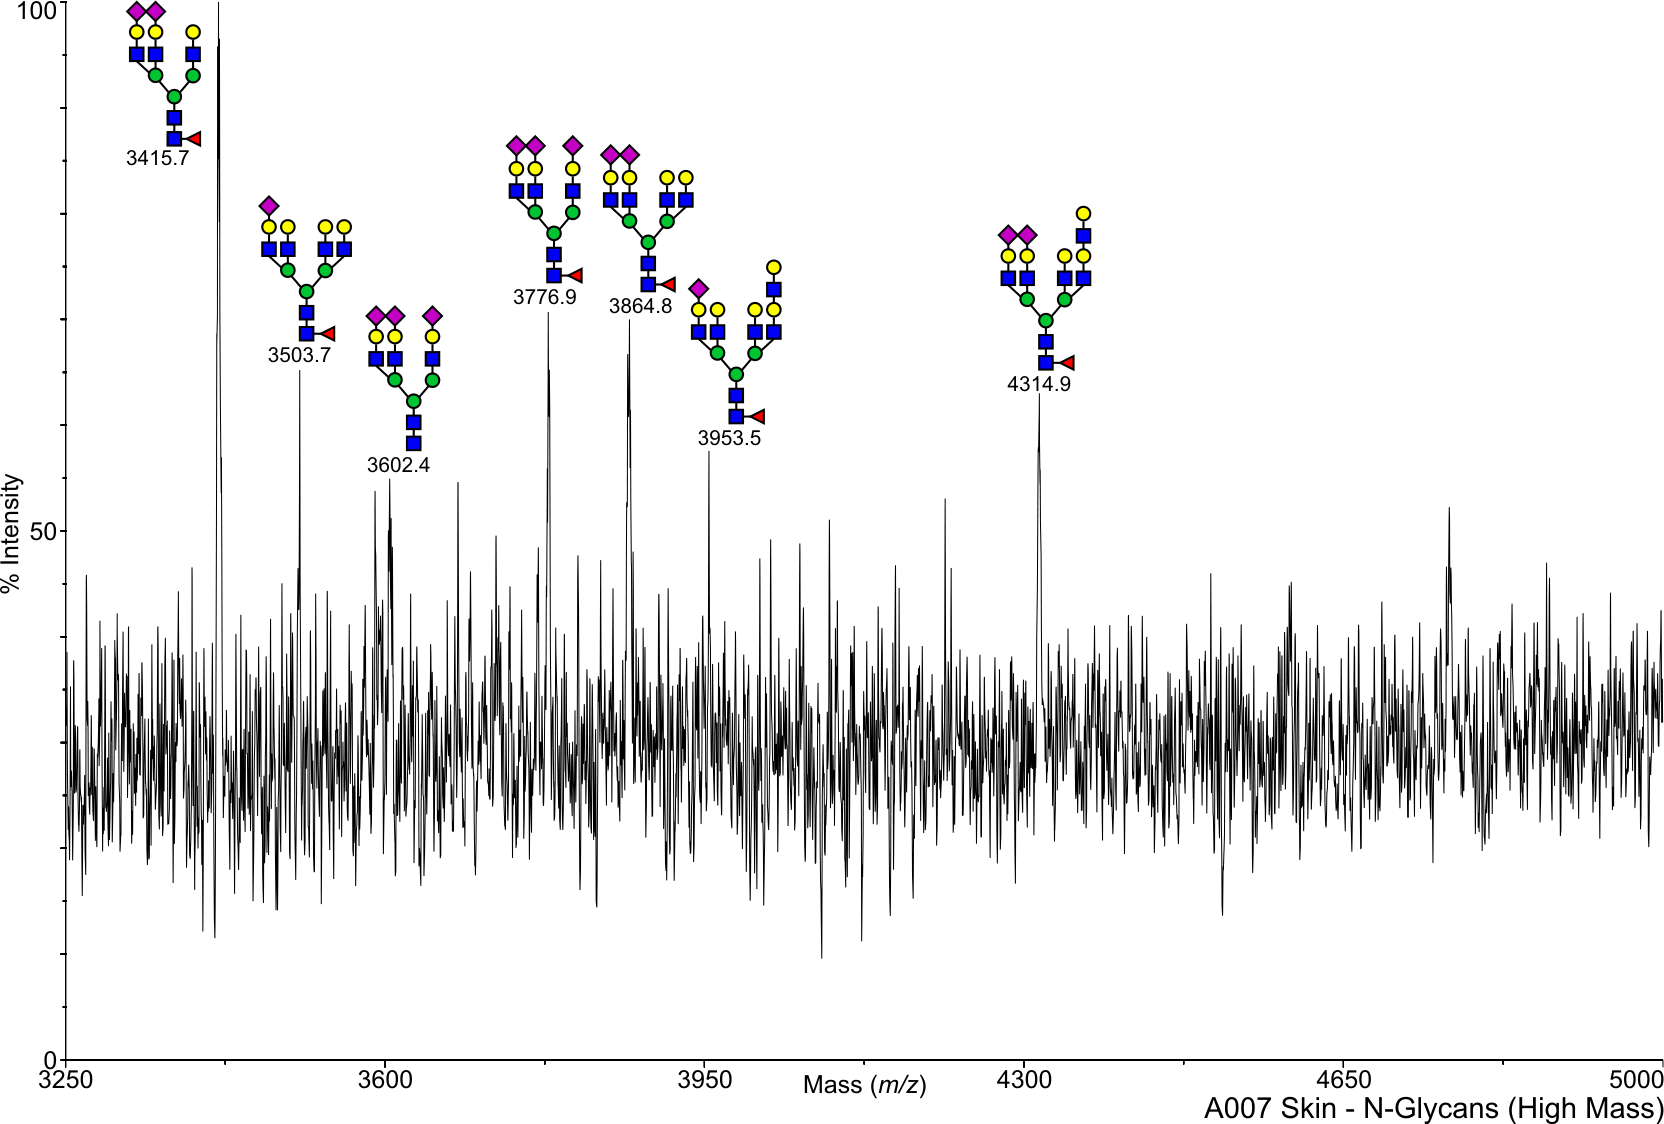
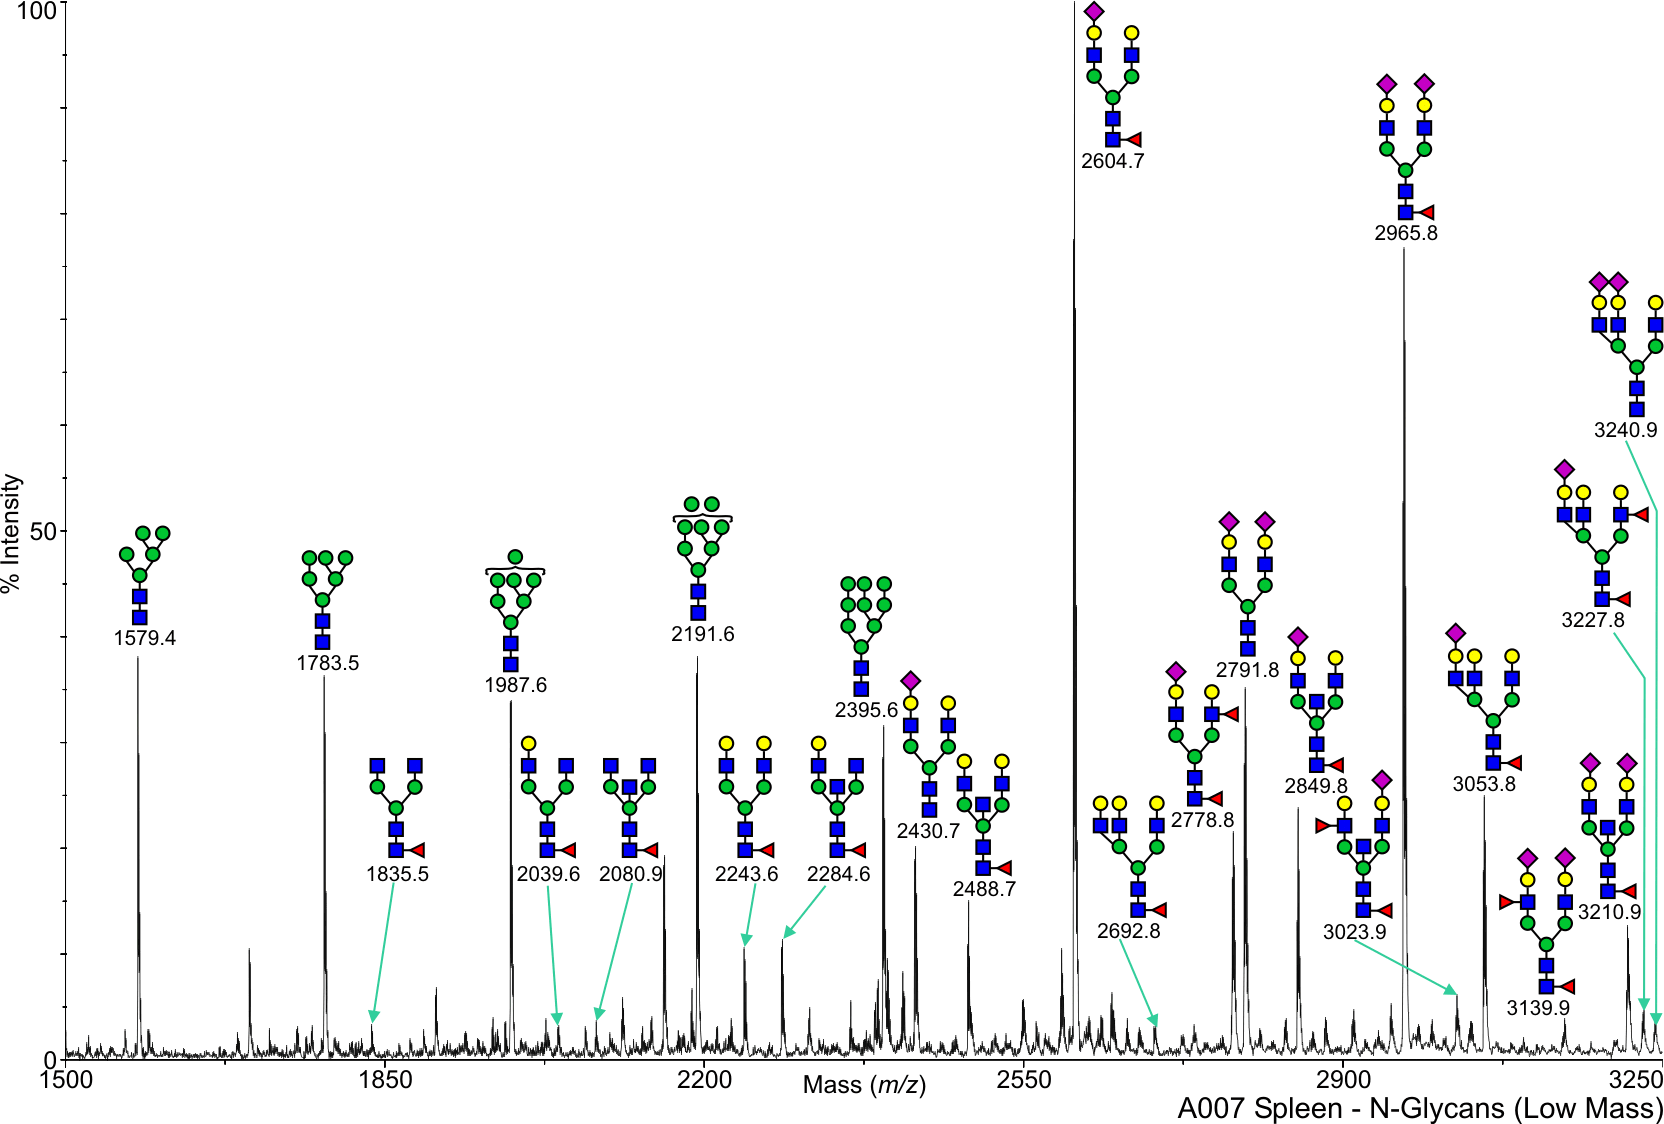
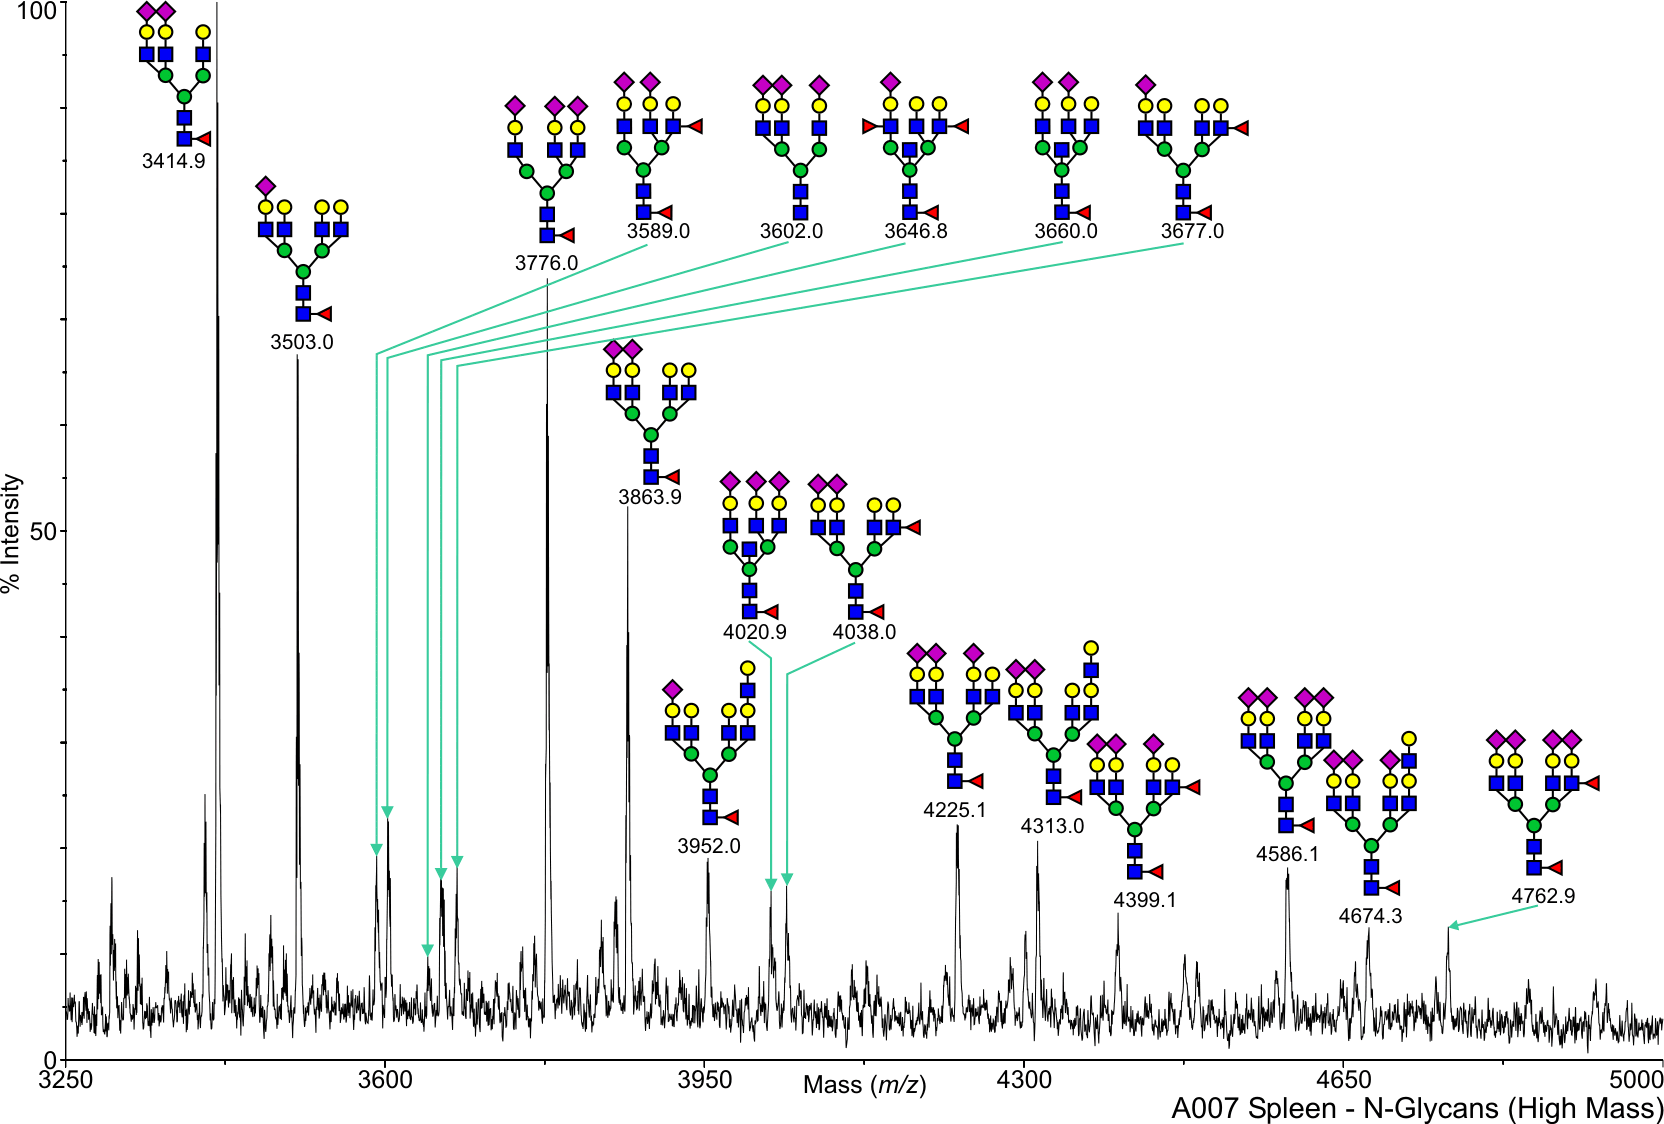
Human Heart N-Linked A007 Salomon,Daniel View experimental details      
Annotated file in JPG format Annotated file in PDF format
View Mass Spectrum data as text View Mass Peak file   Interactive Mass Spectrum Viewer
cfg_rRequest_1691
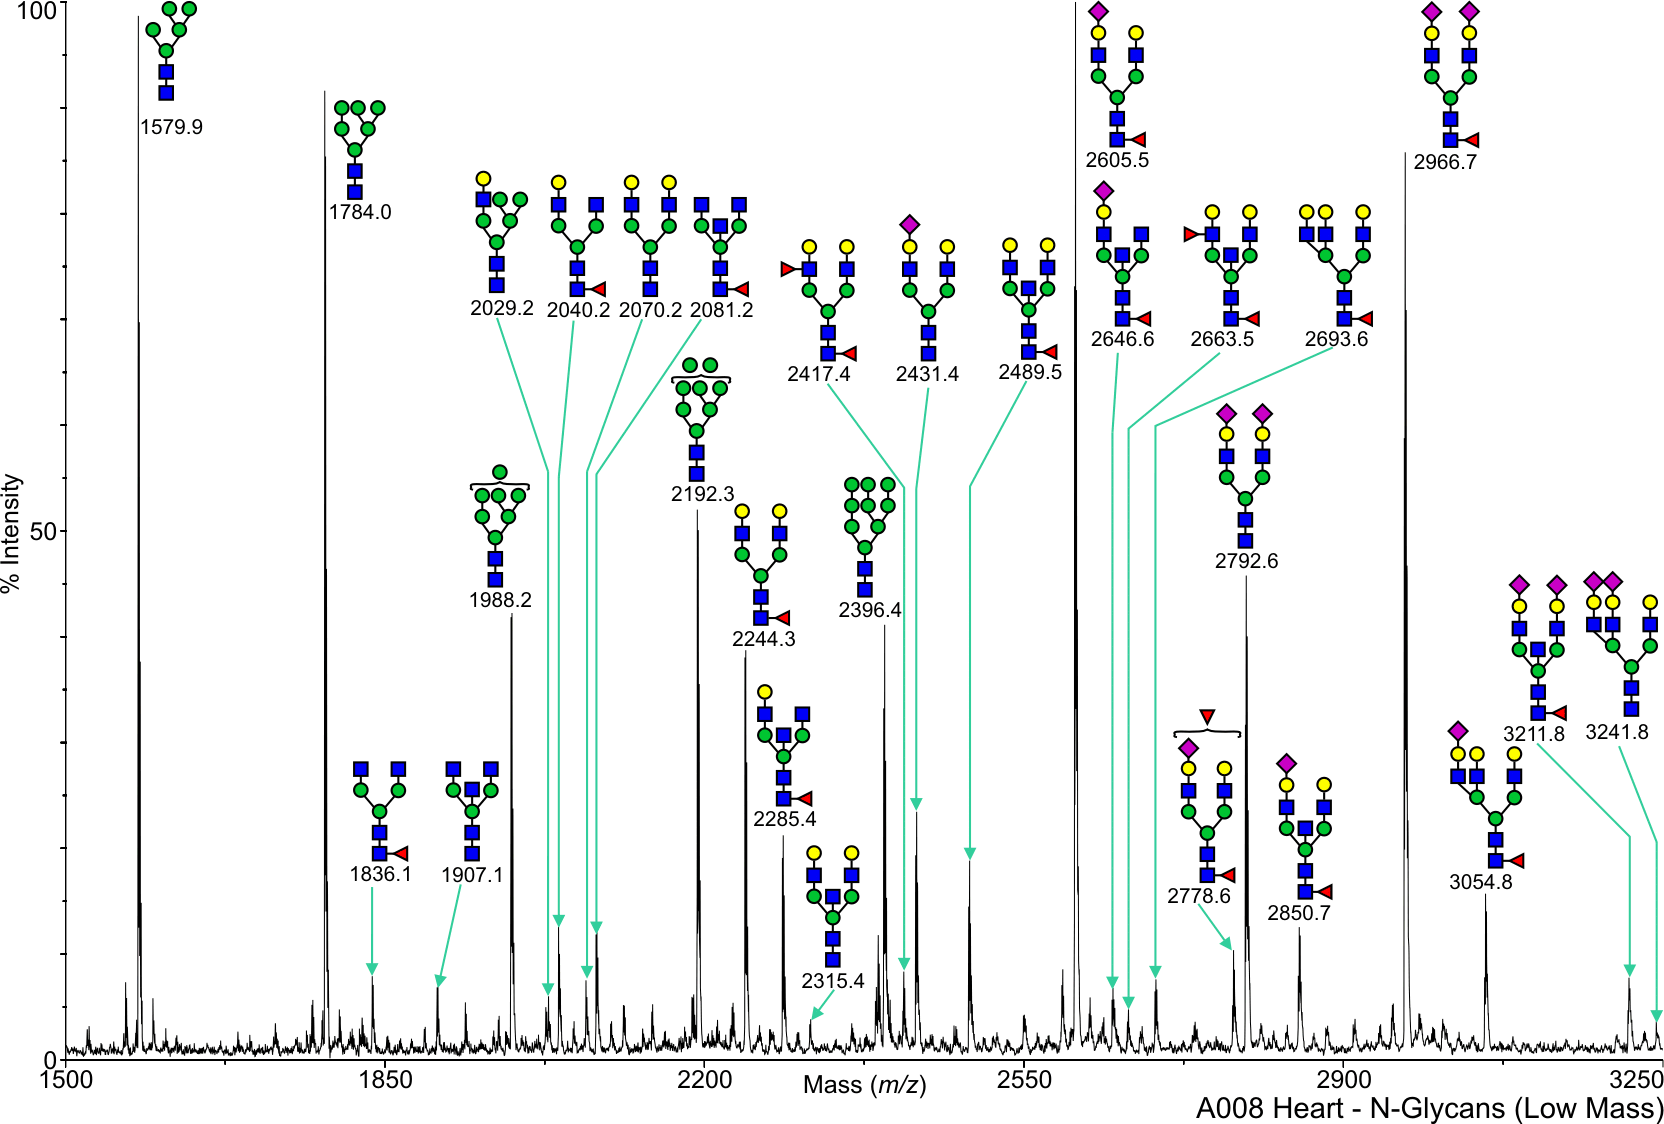
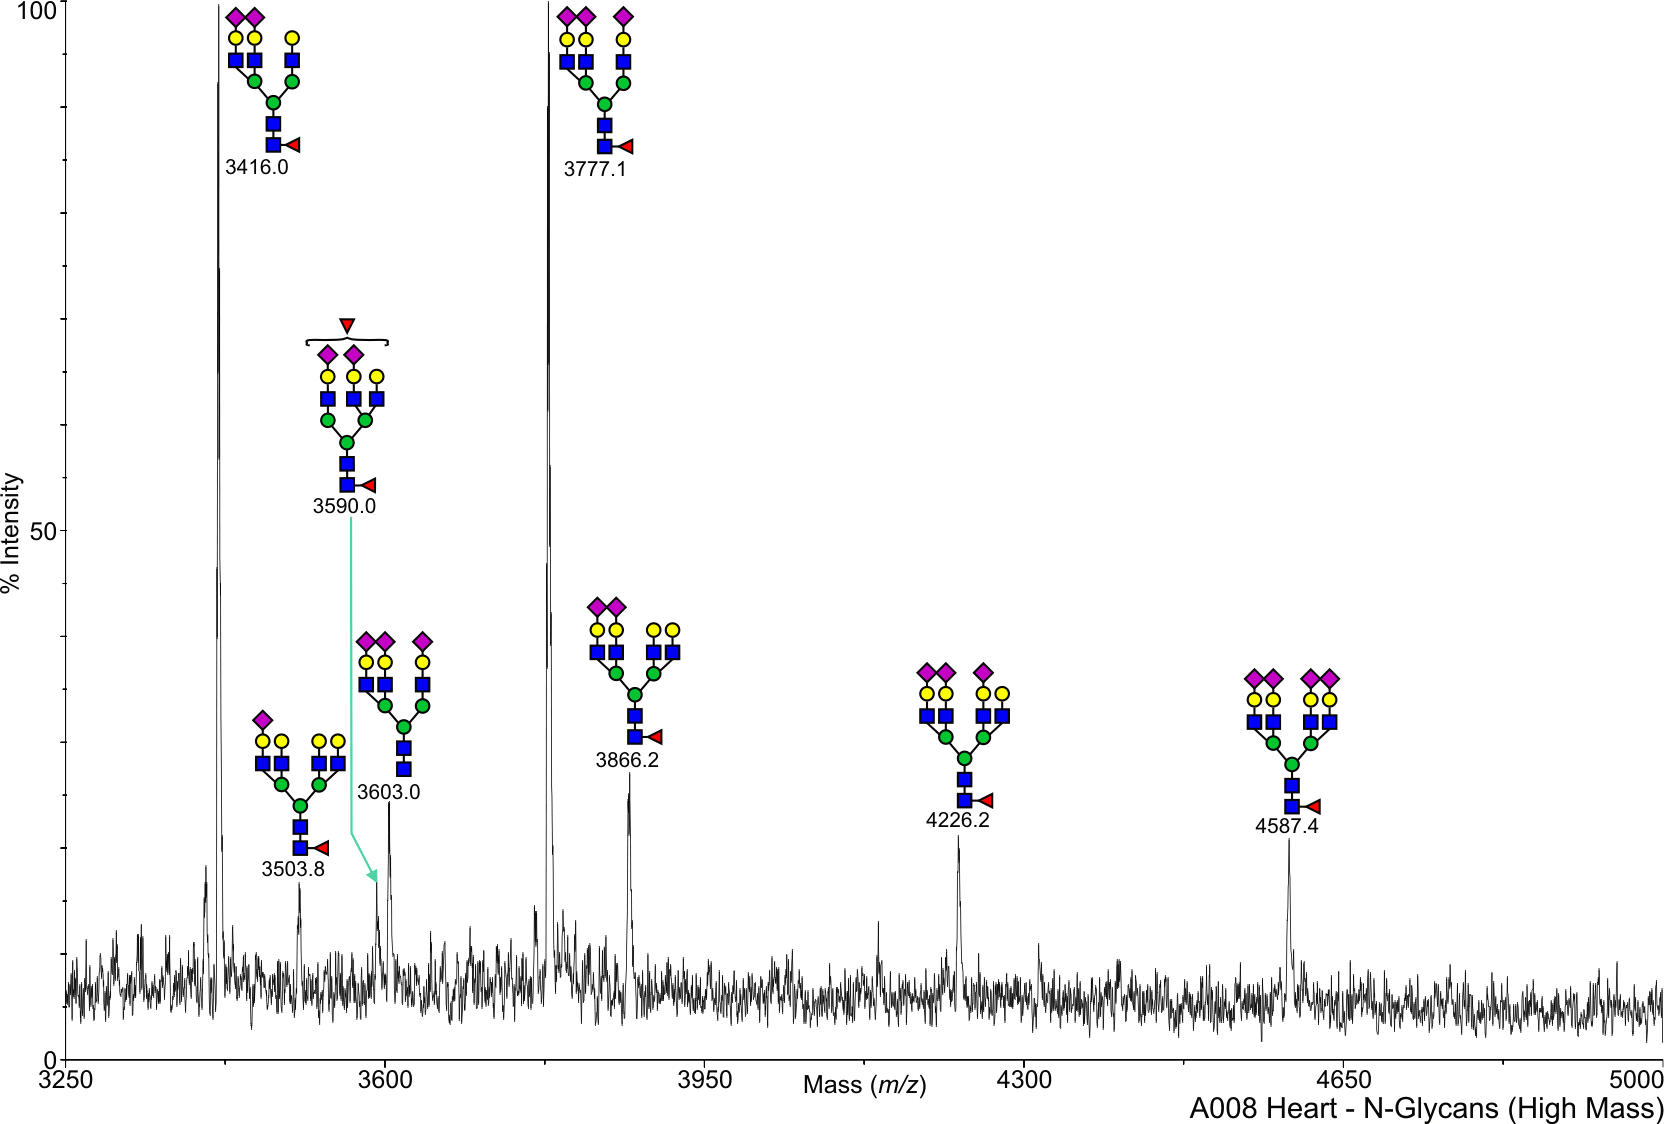
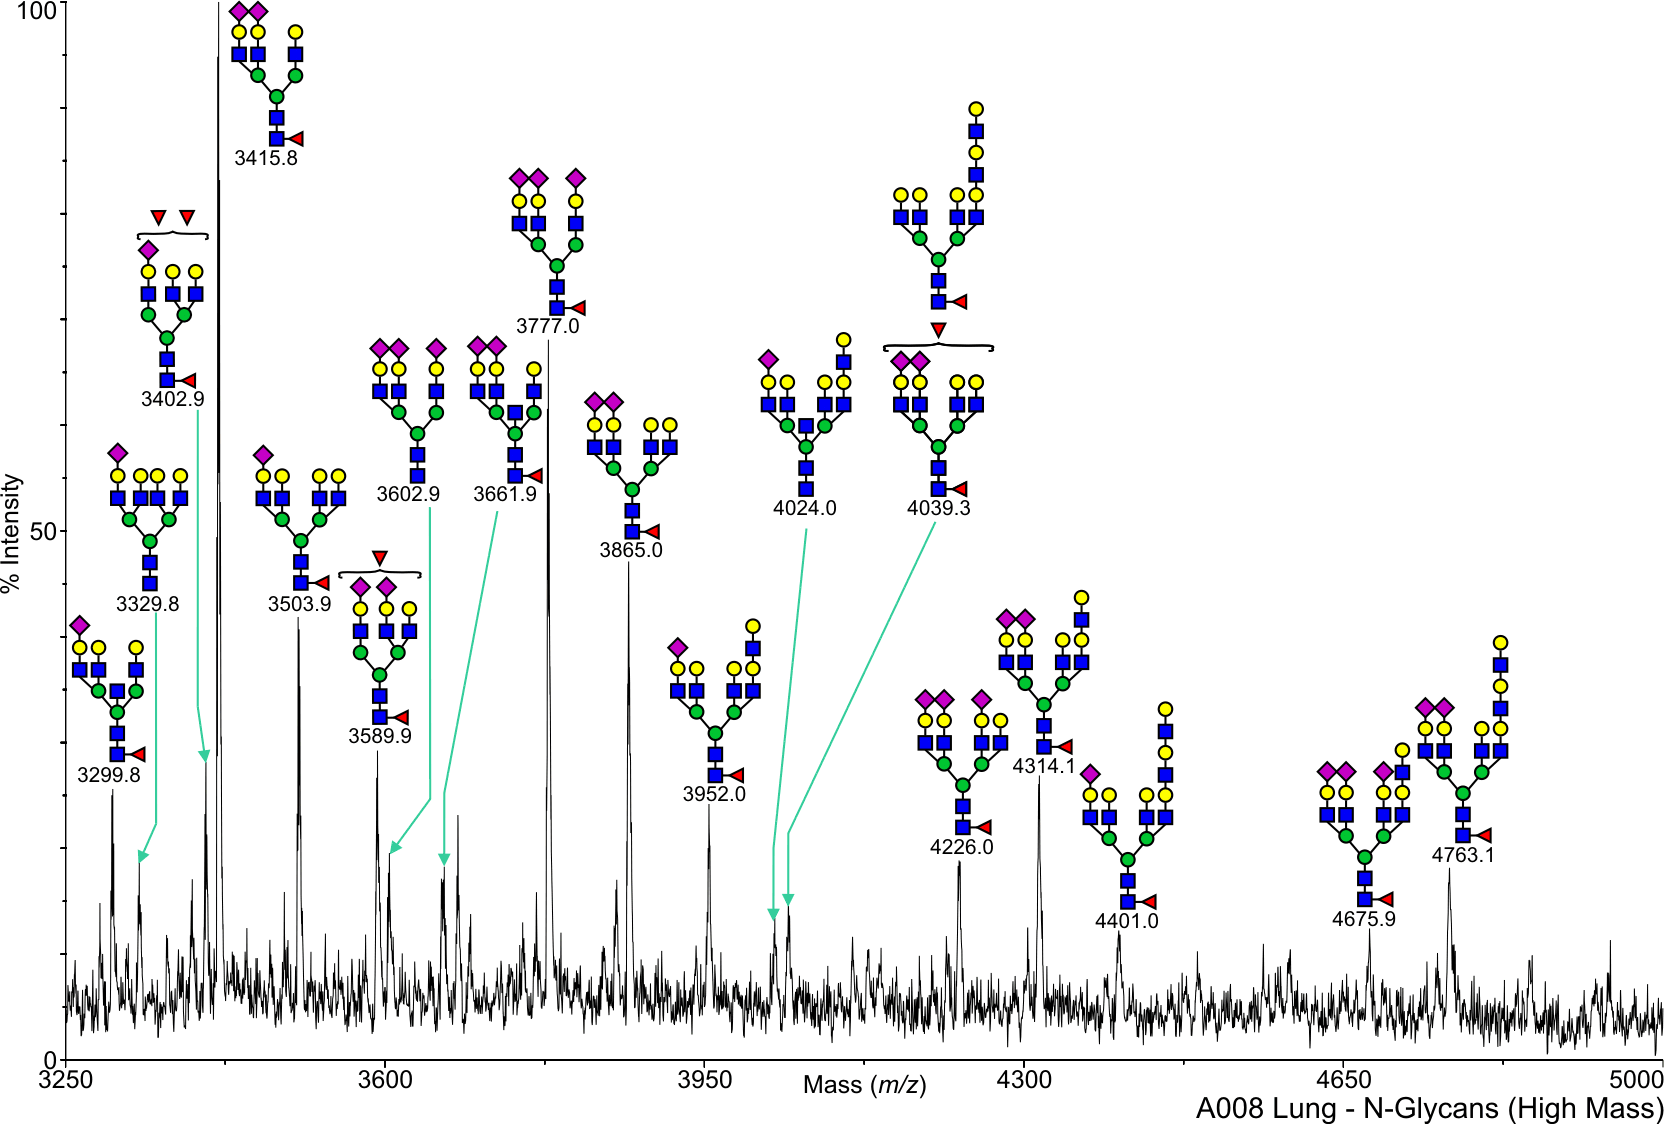
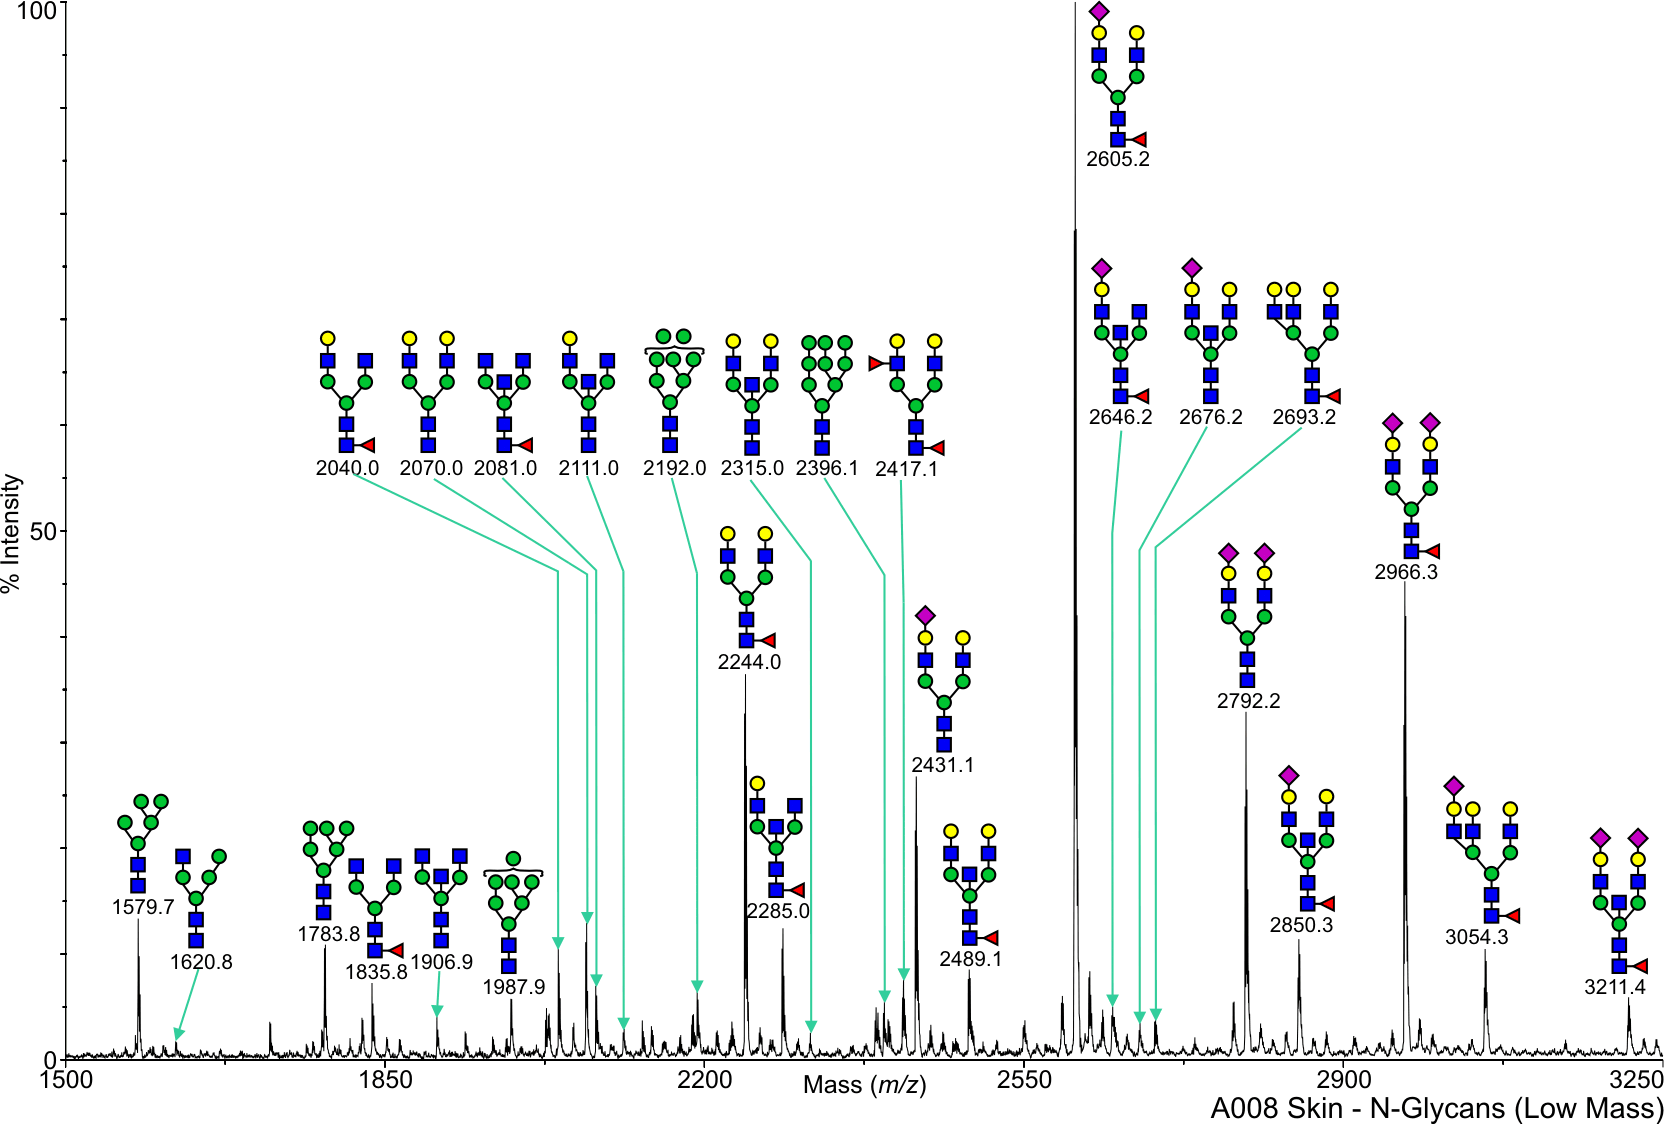
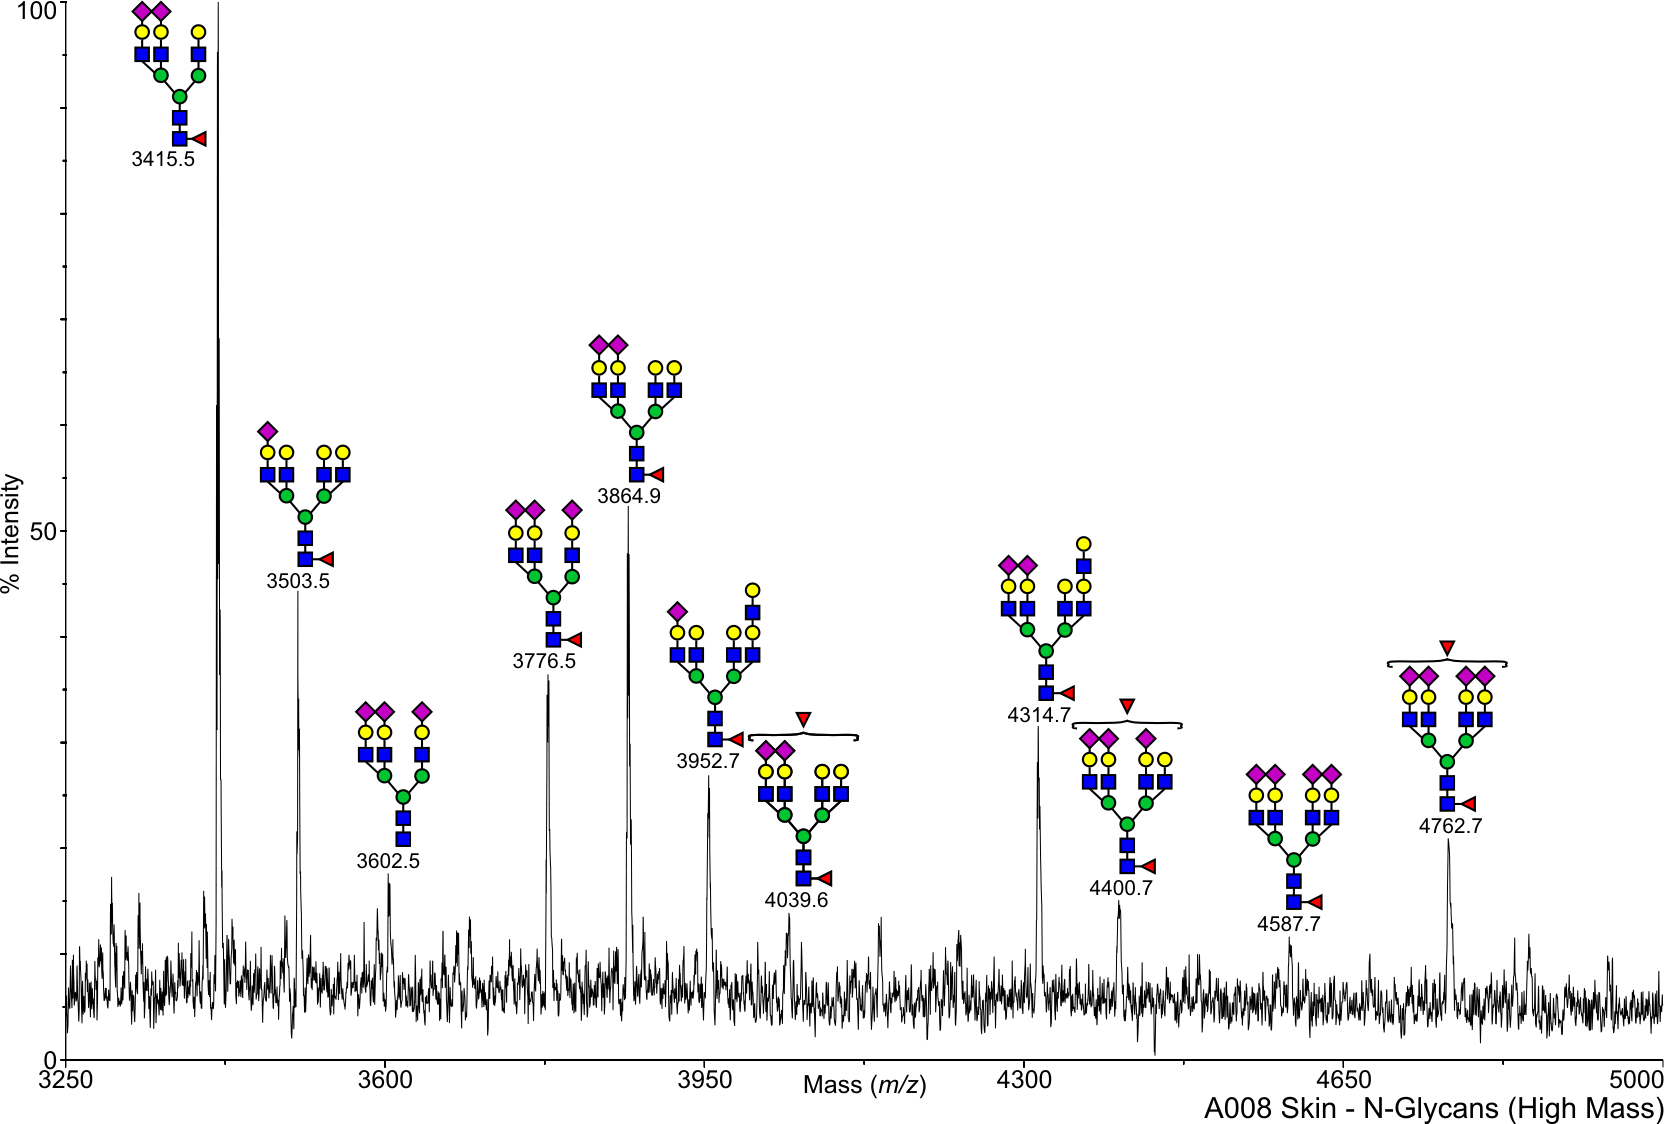
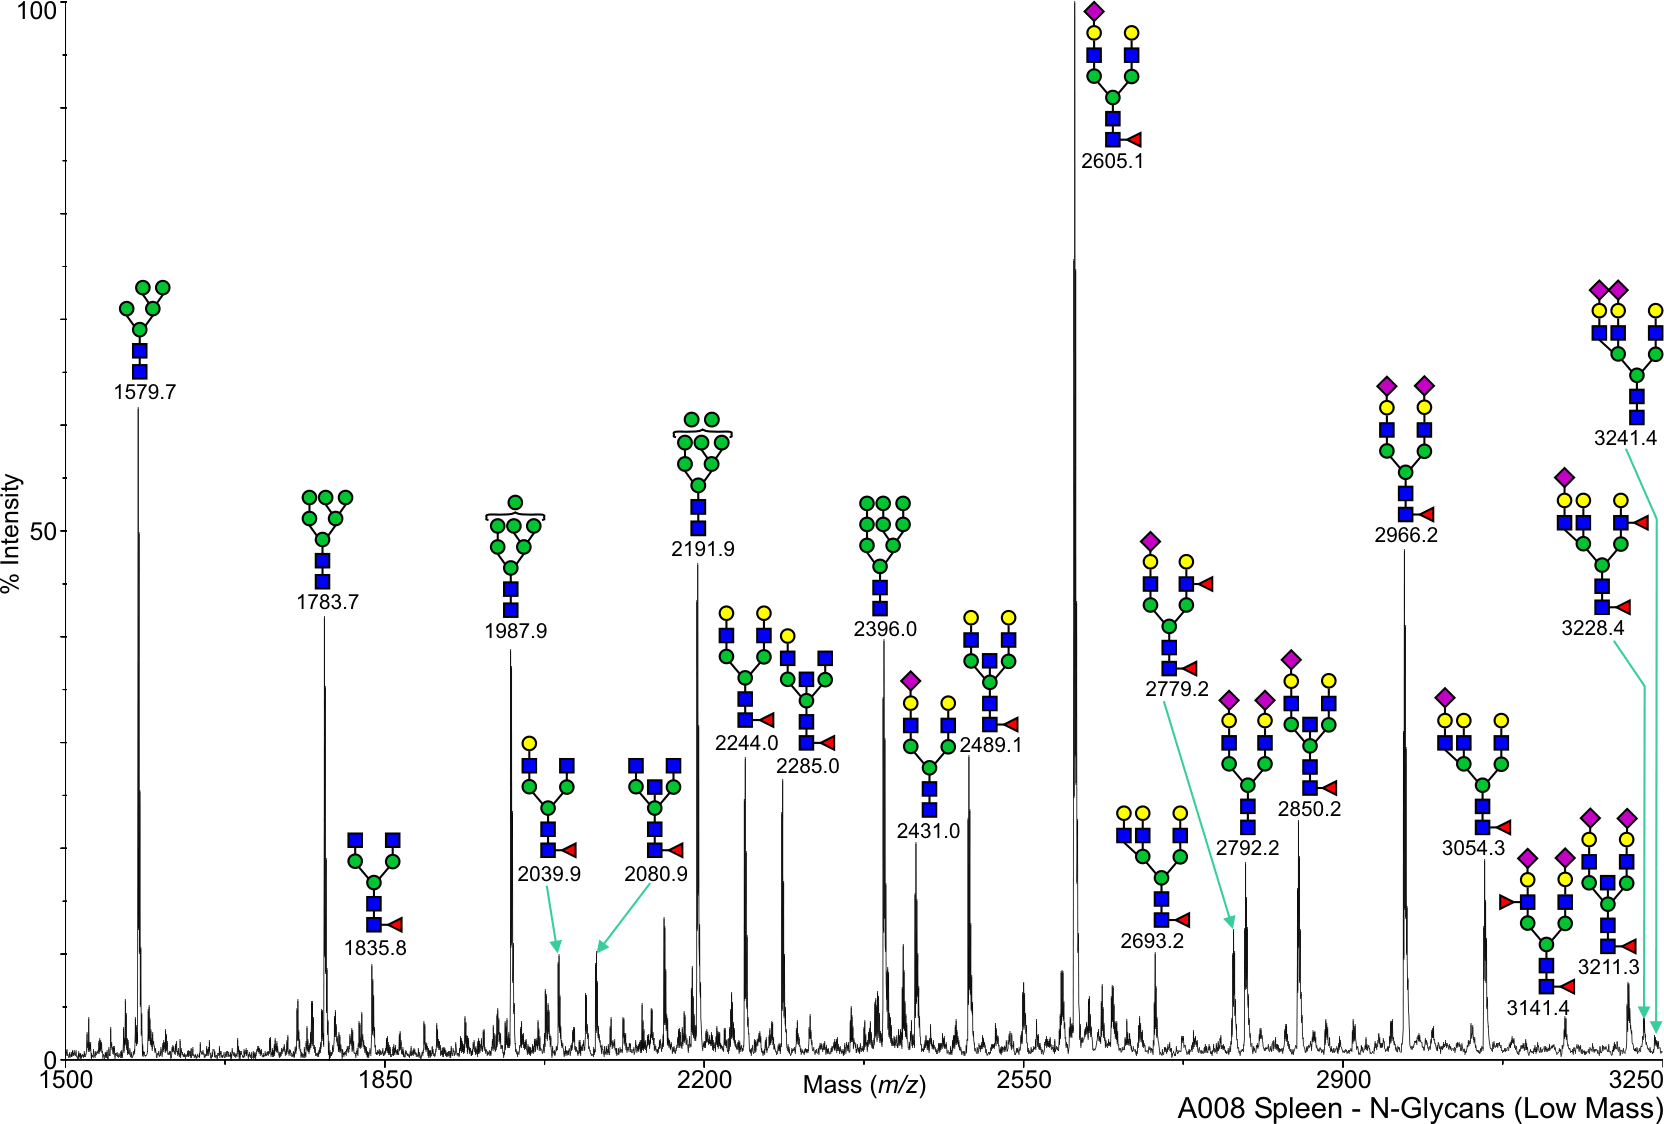
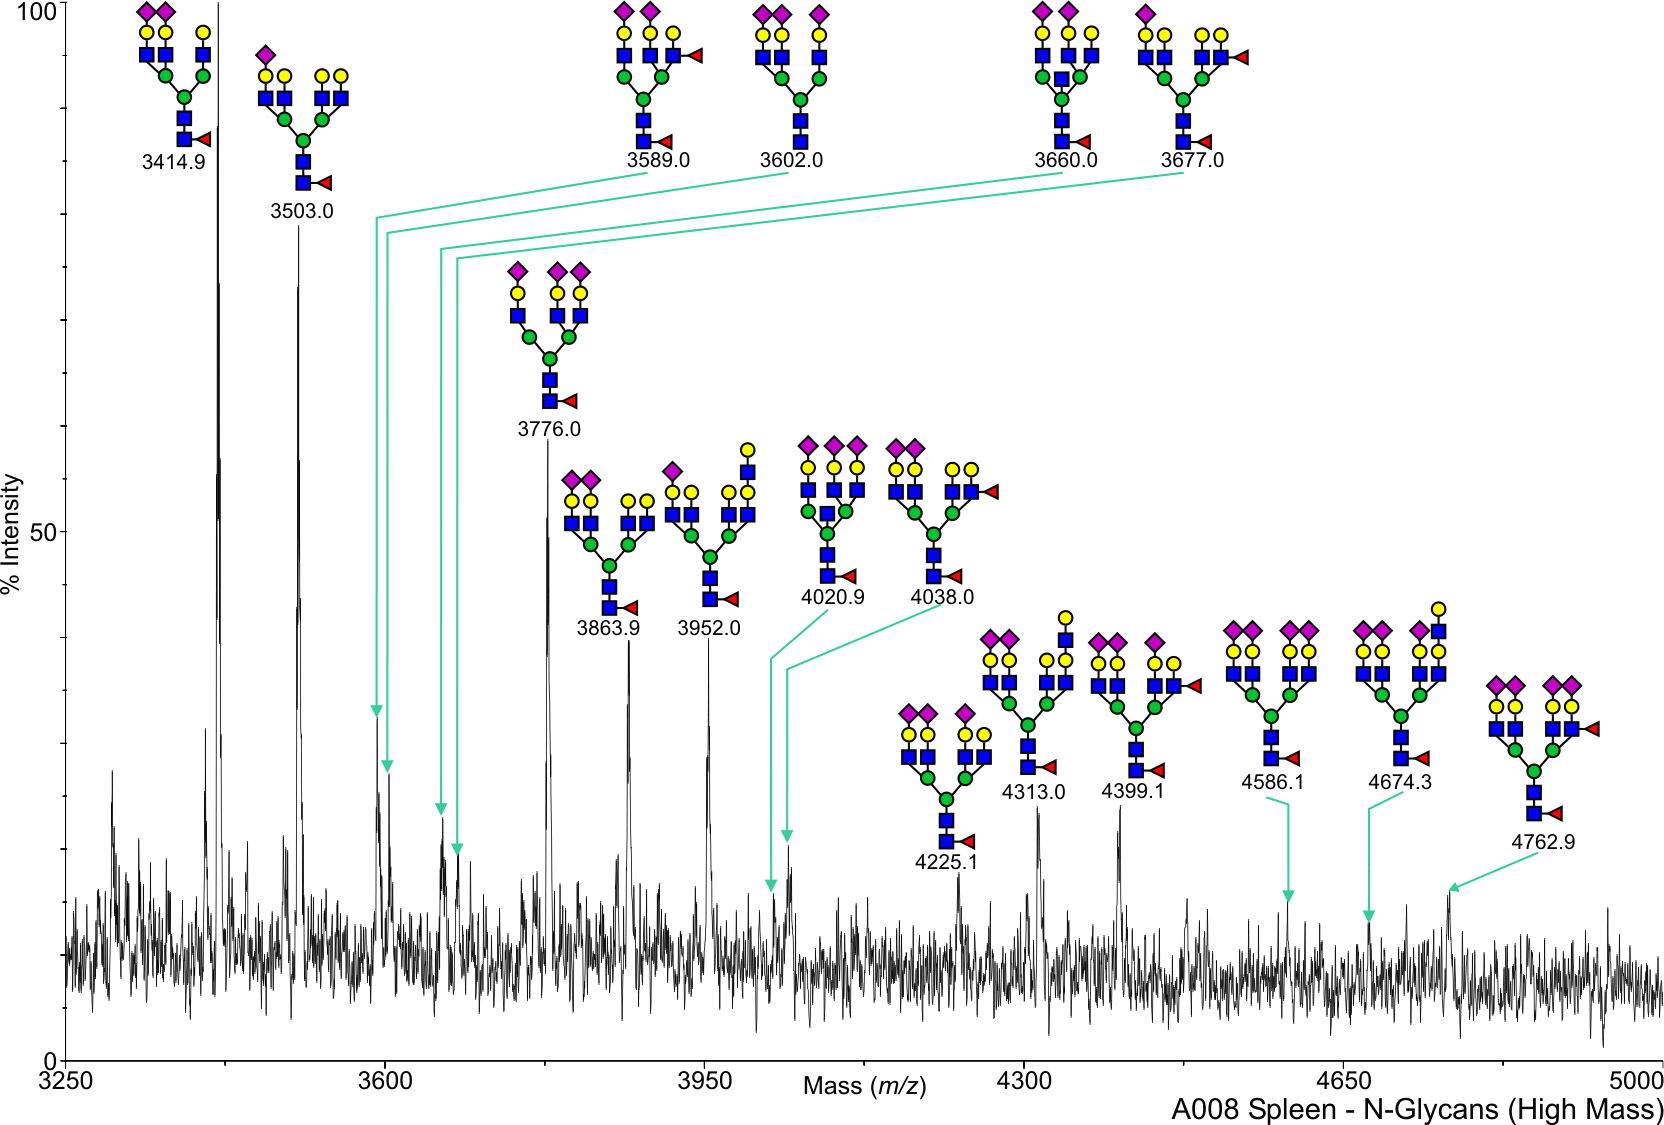
Human Heart N-Linked A008 Salomon,Daniel View experimental details      
Annotated file for lower mass range in JPG formatAnnotated file for higher mass range in JPG format Annotated file for lower mass range in PDF formatAnnotated file for higher mass range in PDF format
View Mass Spectrum data as text View Mass Peak file   Interactive Mass Spectrum Viewer
cfg_rRequest_1691
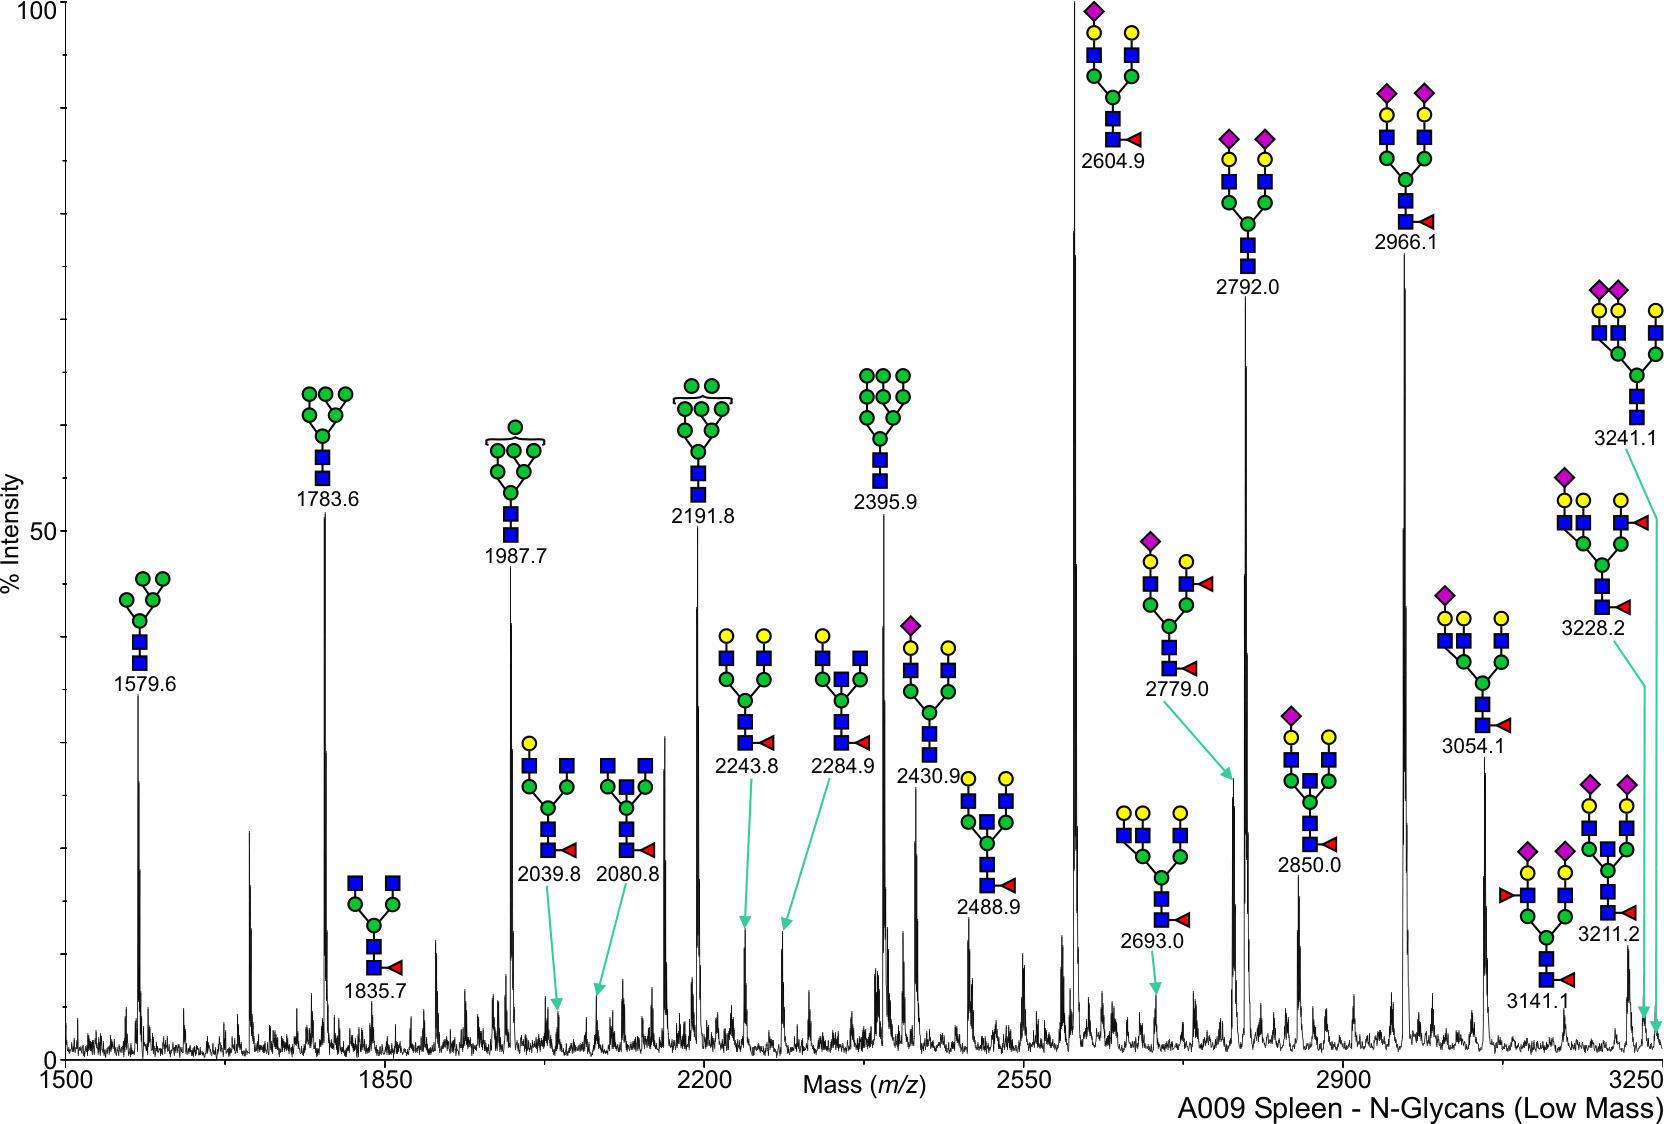
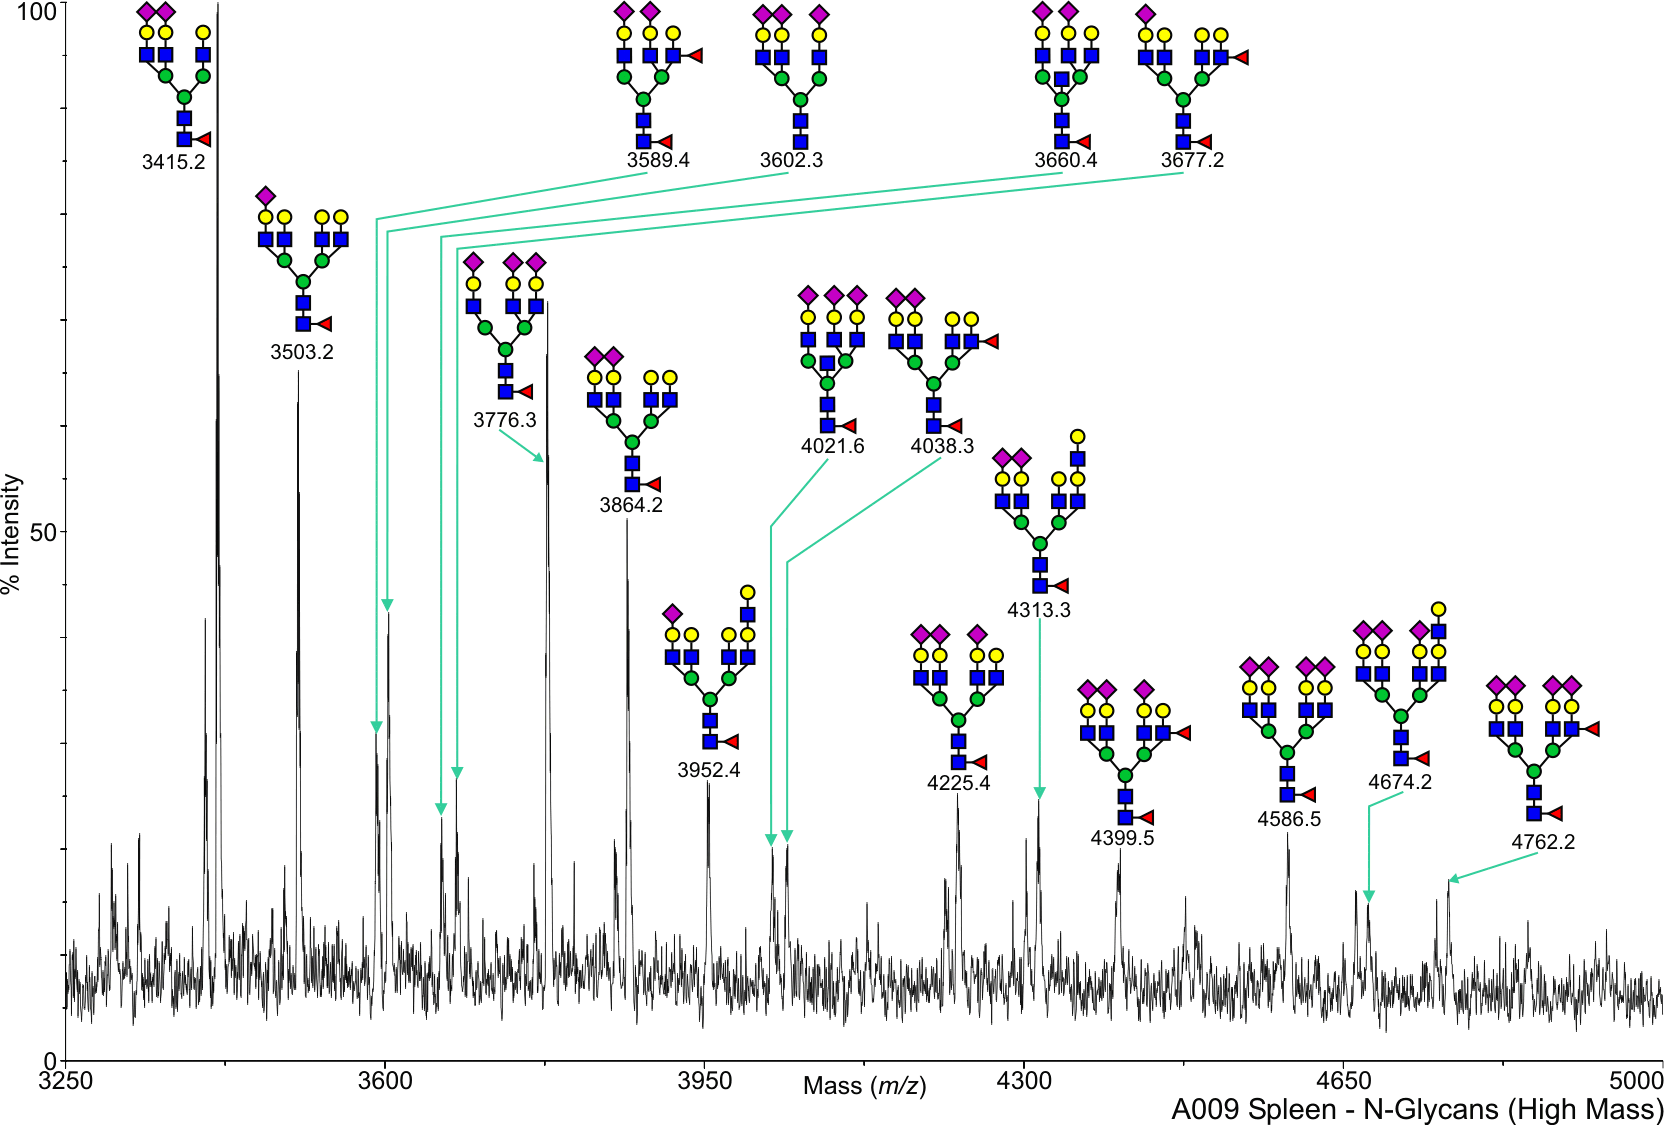
Human Heart N-Linked A009 Salomon,Daniel View experimental details      
   
View Mass Spectrum data as text      
cfg_rRequest_1691
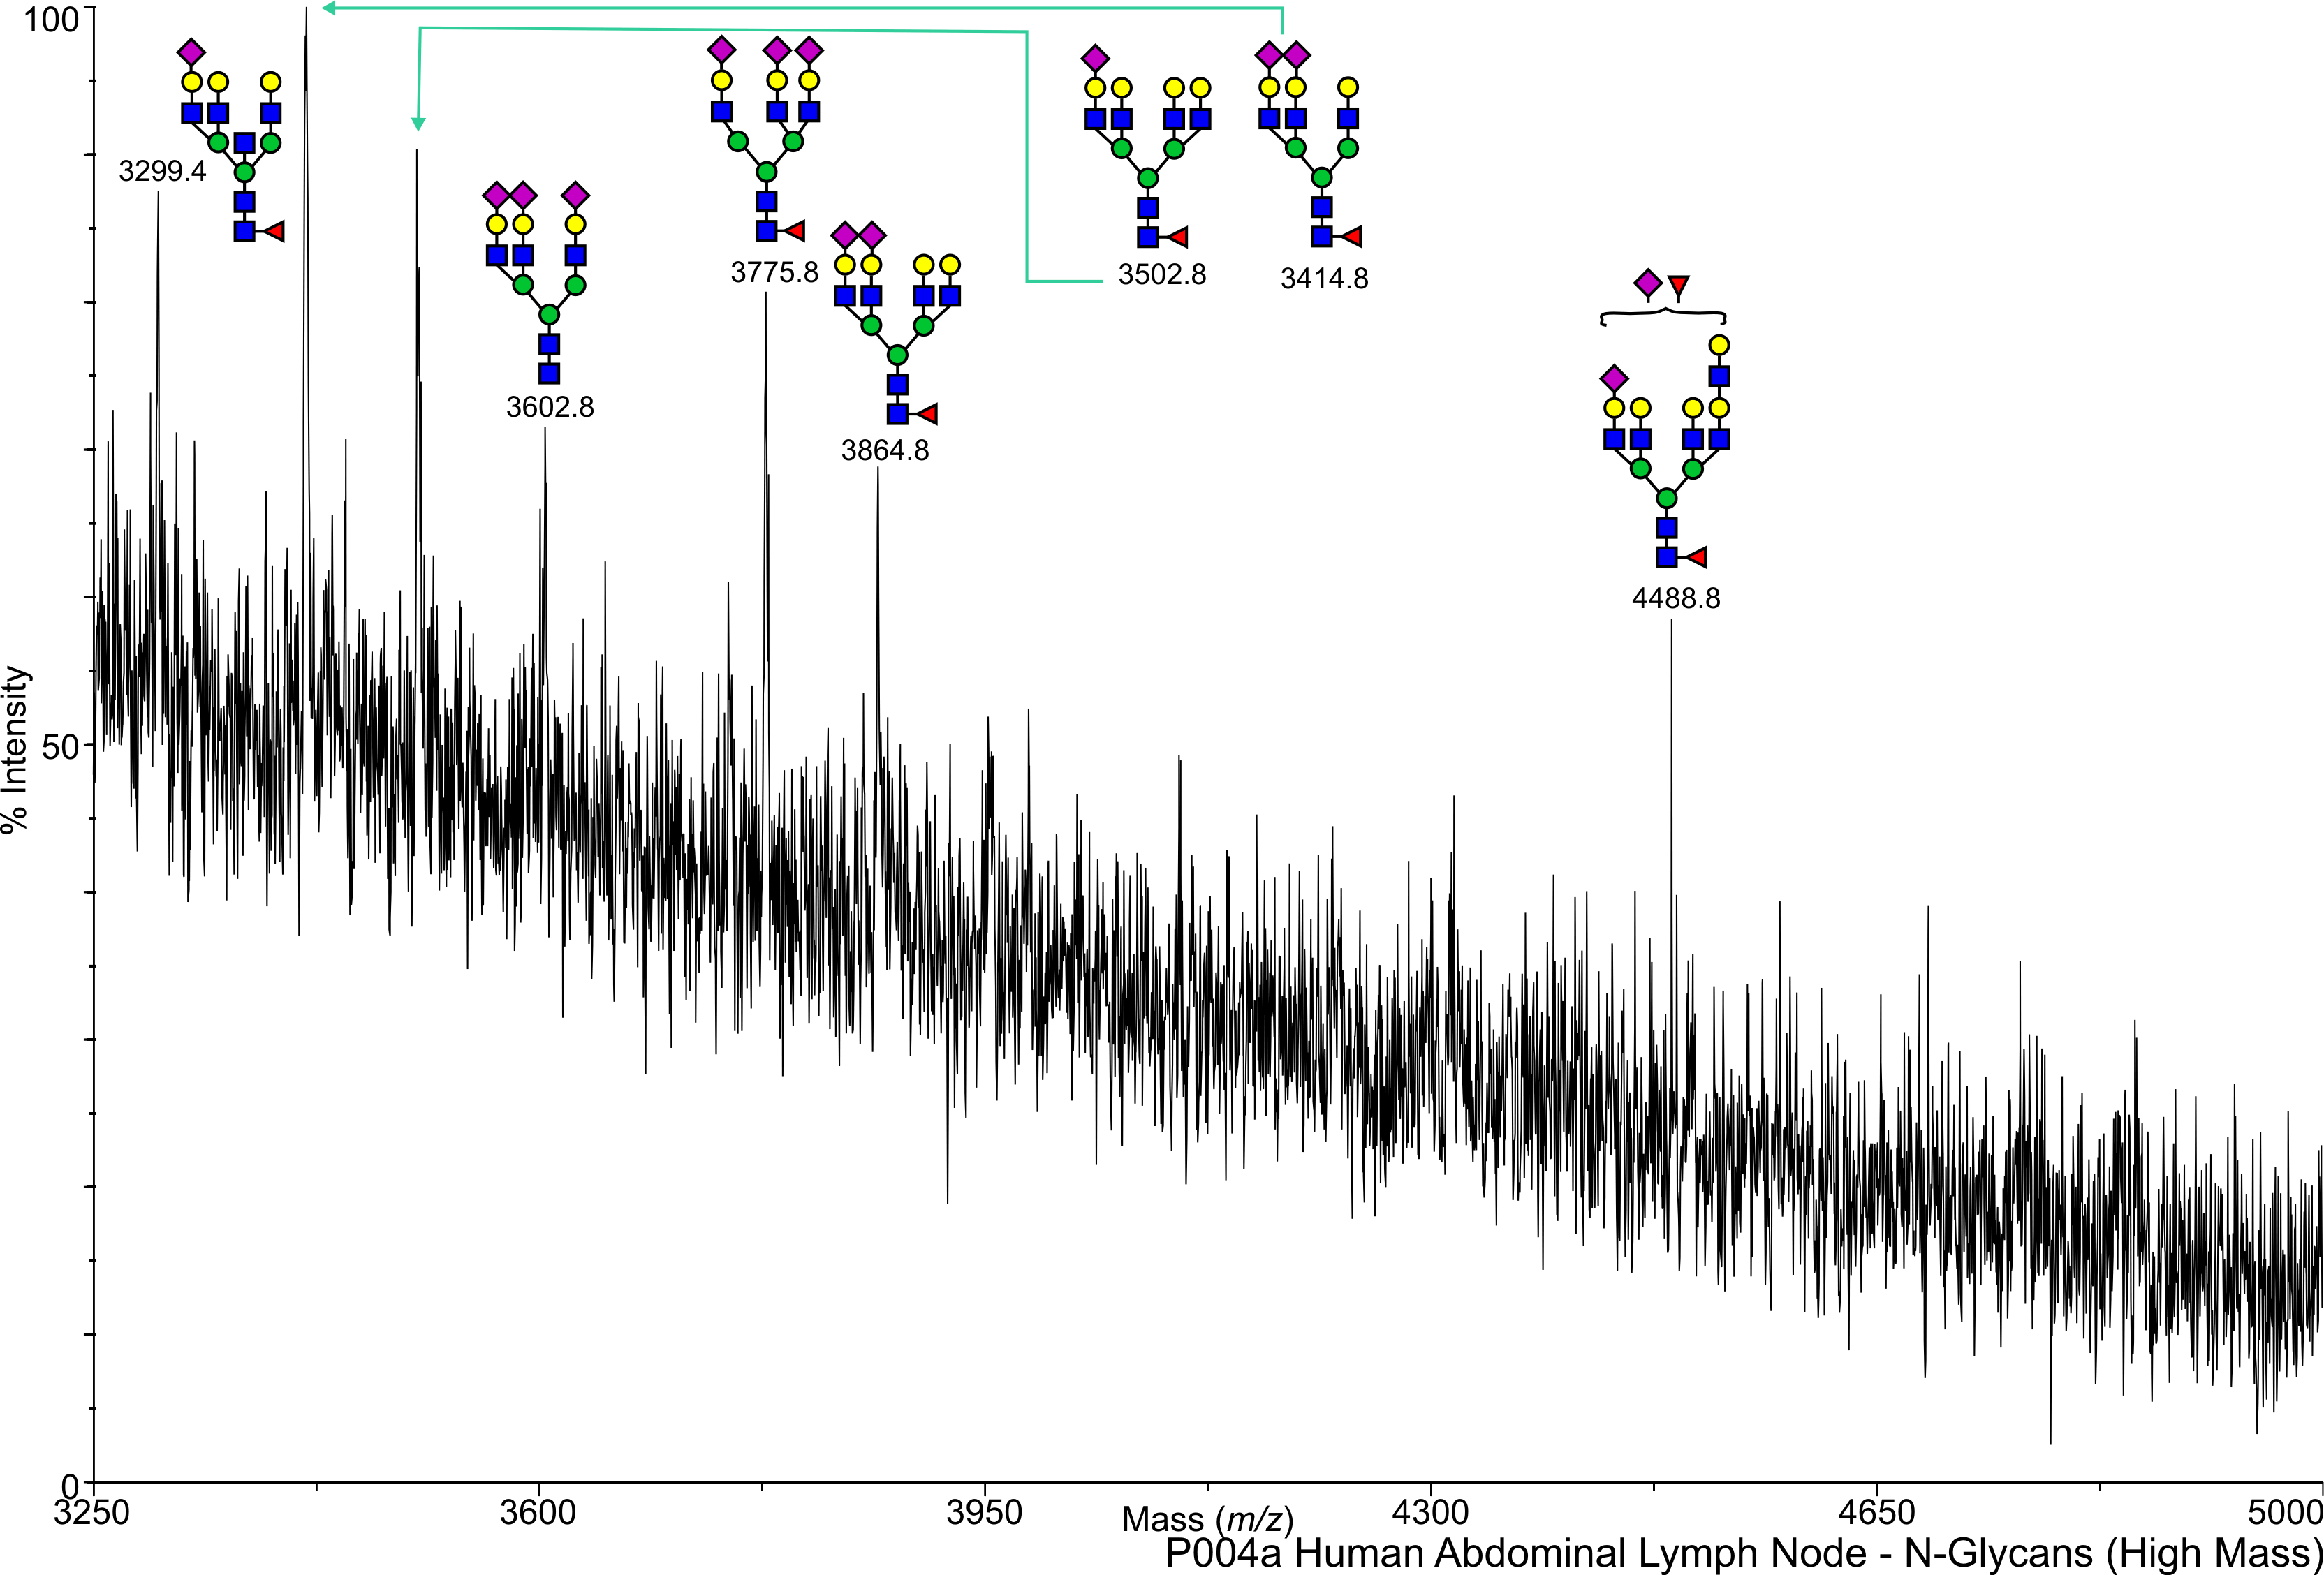
Human Heart N-Linked P004a Salomon,Daniel View experimental details      
   
       
cfg_rRequest_1691
Human Heart O-Linked 204120 Salomon,Daniel View experimental details      
   
         
cfg_rRequest_1691
Human Heart O-Linked 204151 Salomon,Daniel View experimental details      
   
       
cfg_rRequest_1691
Human Heart O-Linked A002 Salomon,Daniel View experimental details      
   
       
cfg_rRequest_1691
Human Heart O-Linked A004 Salomon,Daniel View experimental details      
   
       
cfg_rRequest_1691
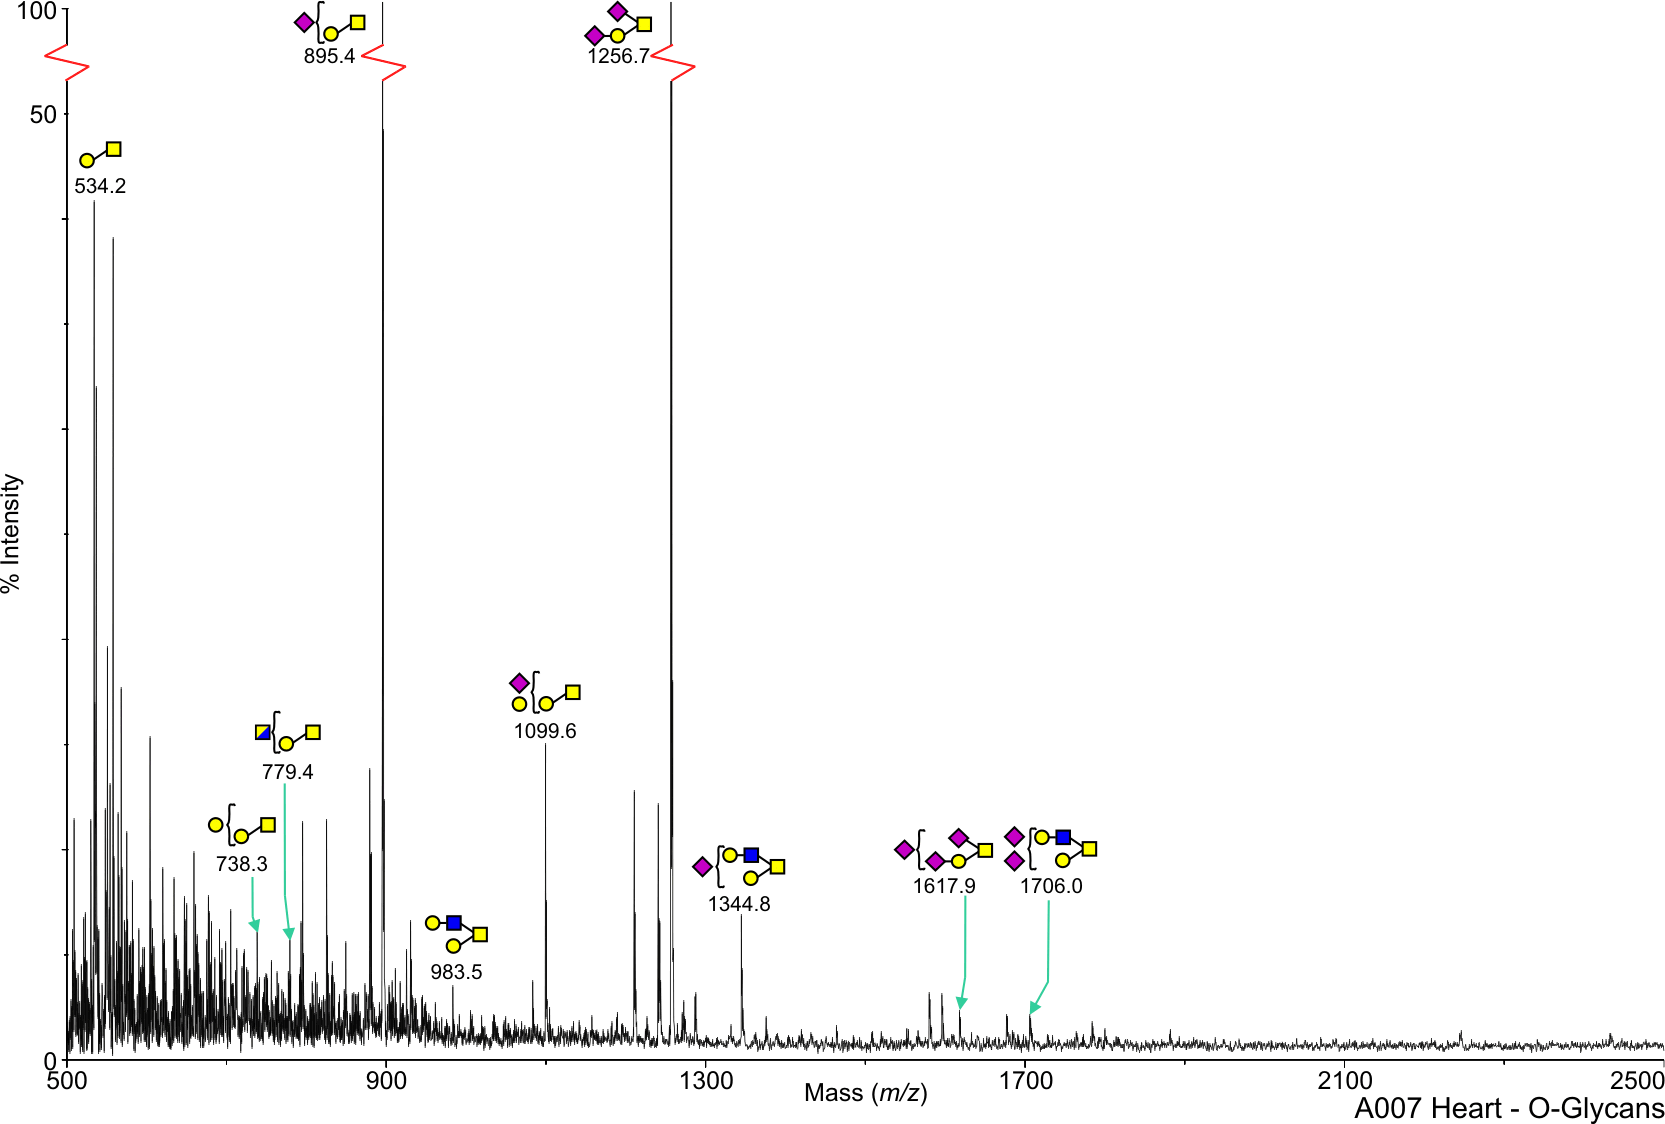
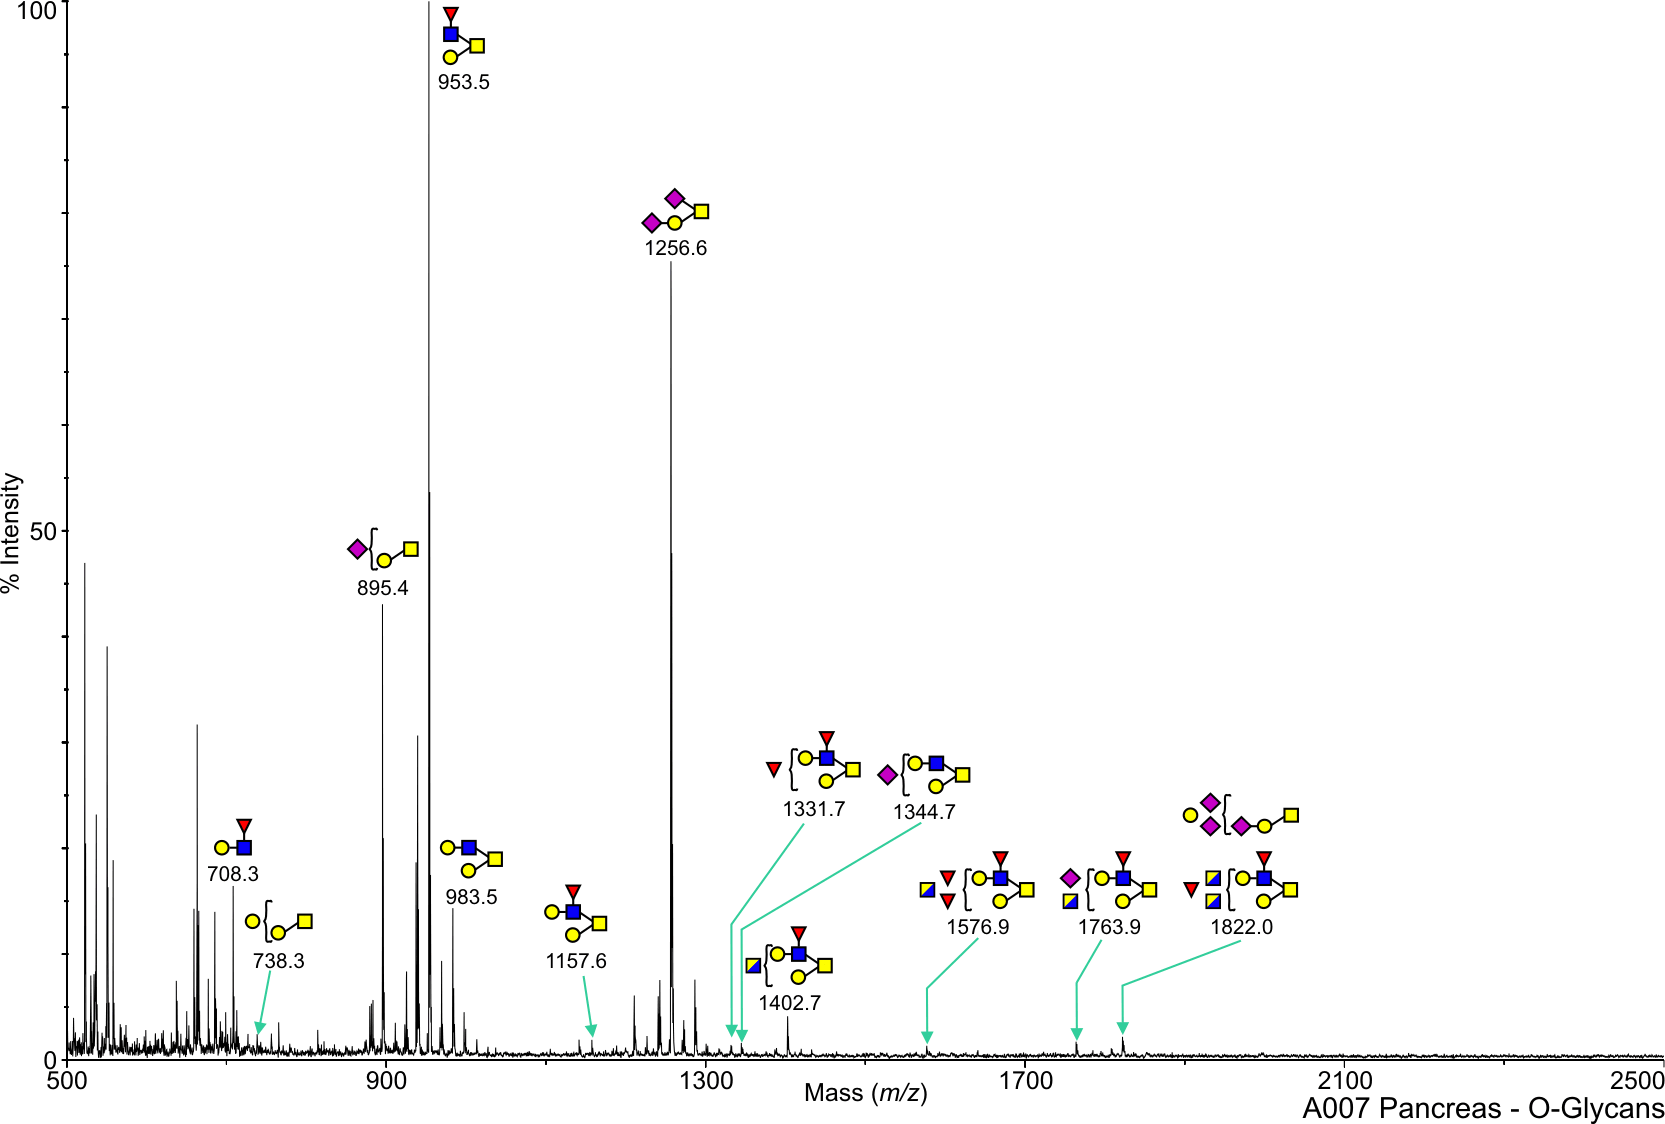
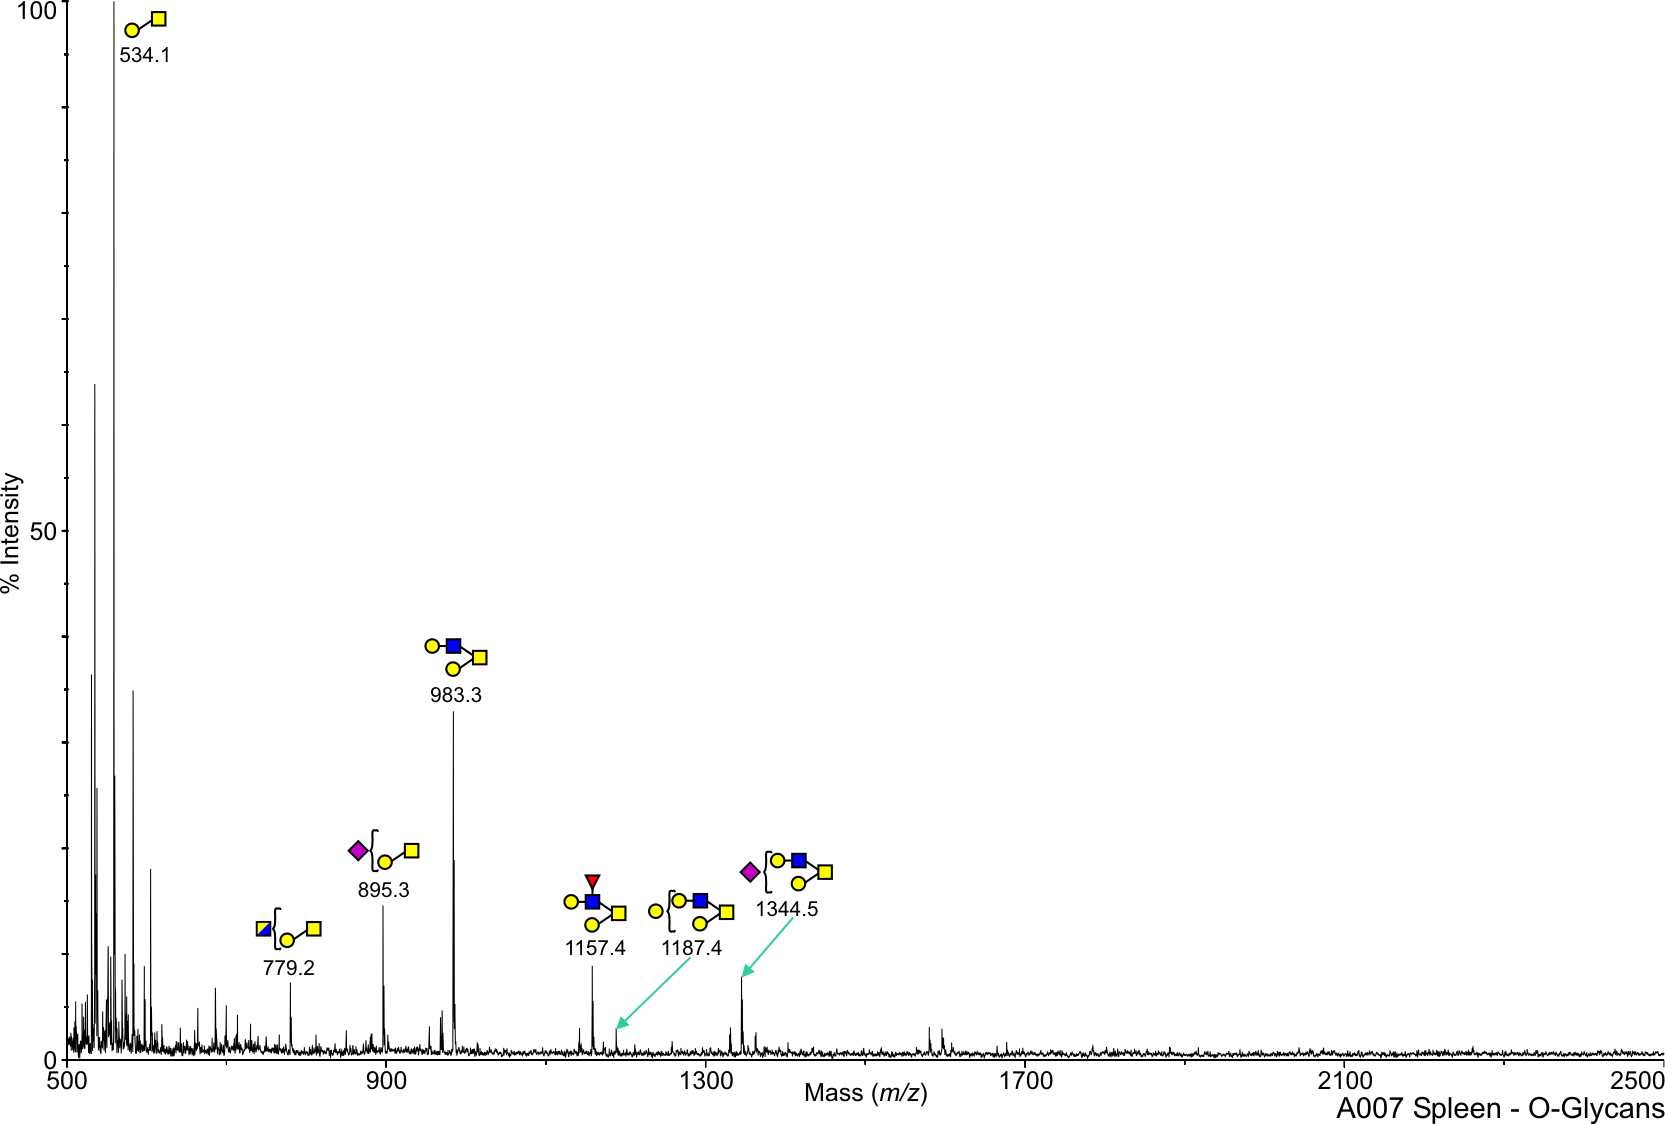
Human Heart O-Linked A007 Salomon,Daniel View experimental details      
Annotated file in JPG format Annotated file in PDF format
View Mass Spectrum data as text View Mass Peak file   Interactive Mass Spectrum Viewer
cfg_rRequest_1691
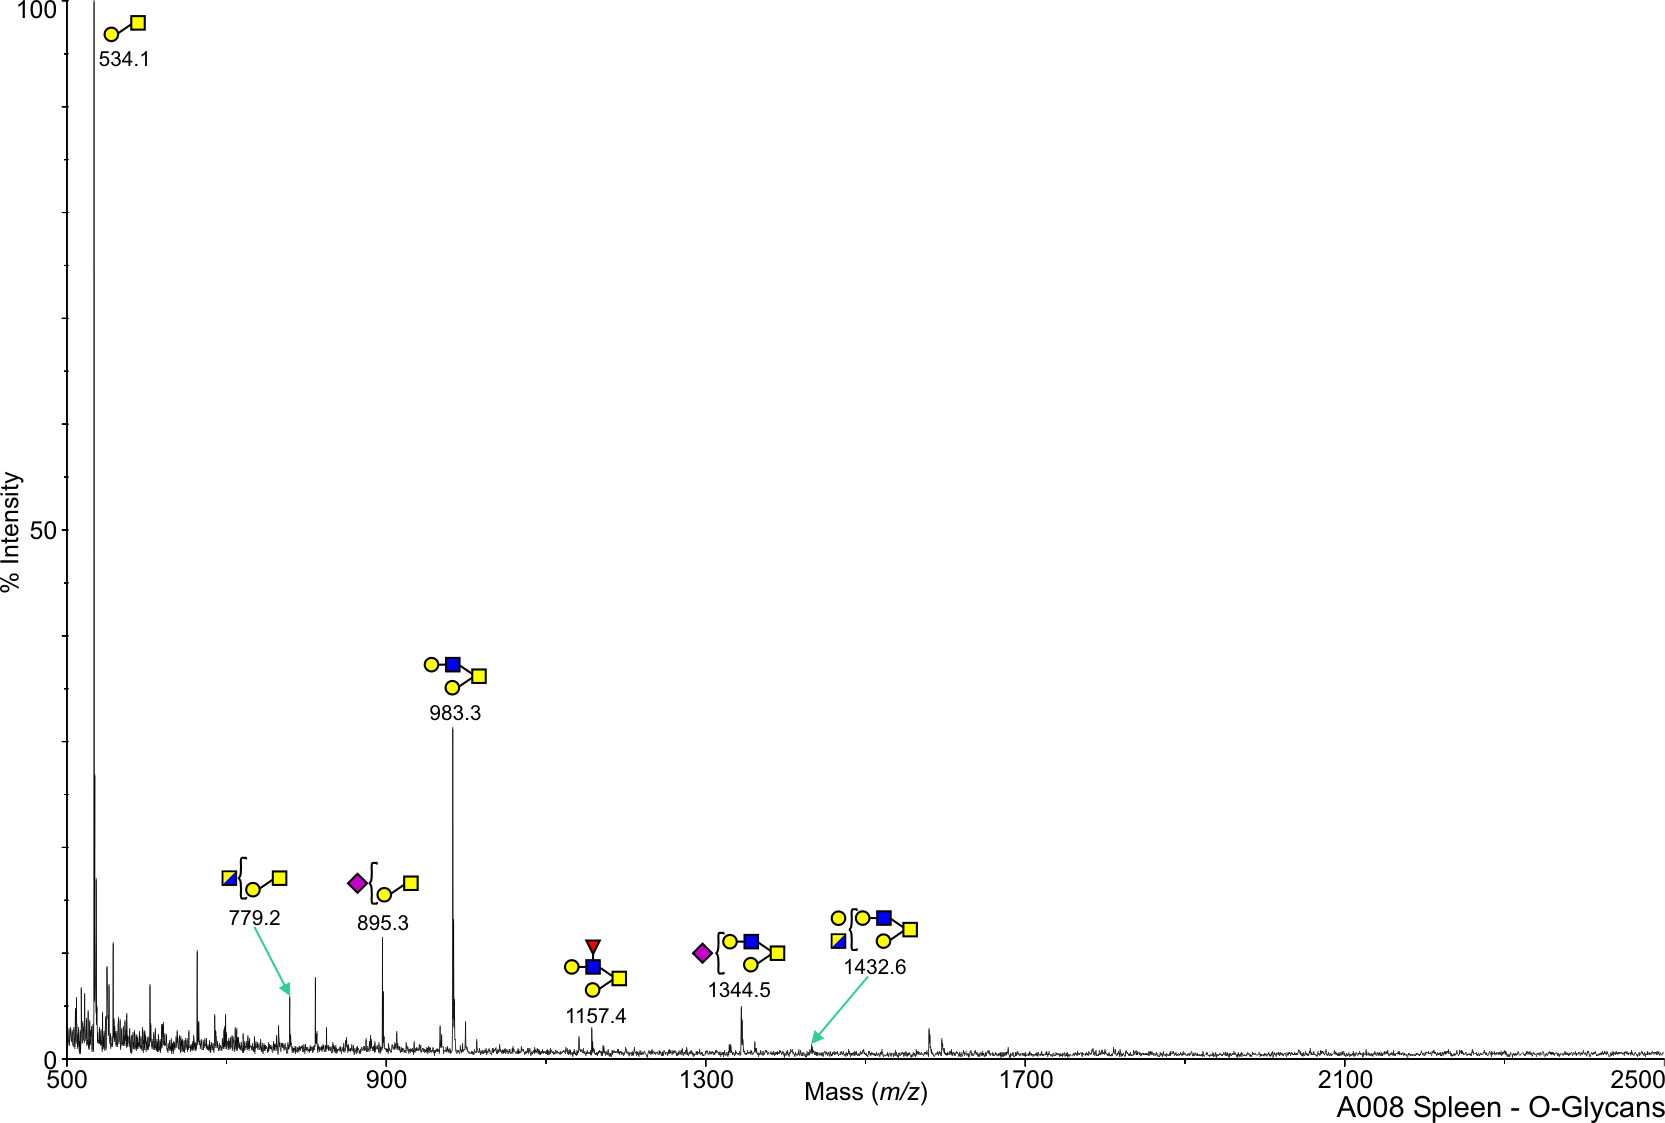
Human Heart O-Linked A008 Salomon,Daniel View experimental details      
   
View Mass Spectrum data as text      
cfg_rRequest_1691
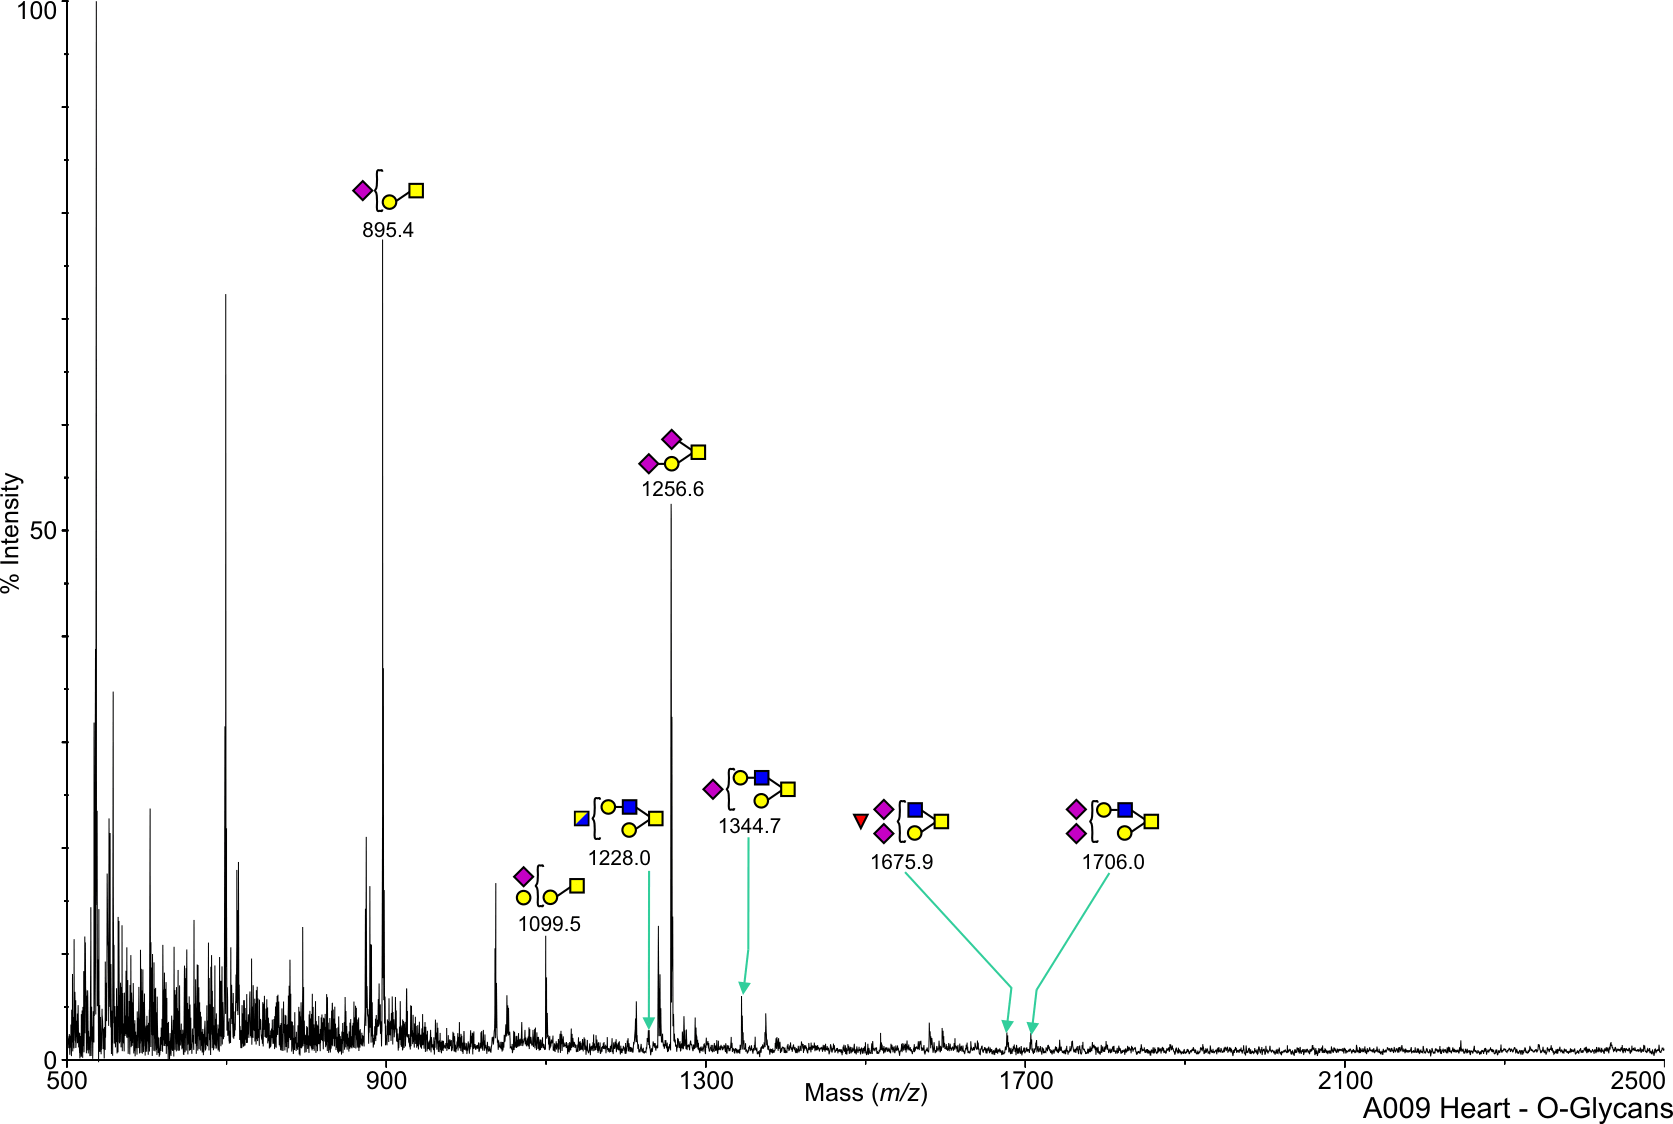
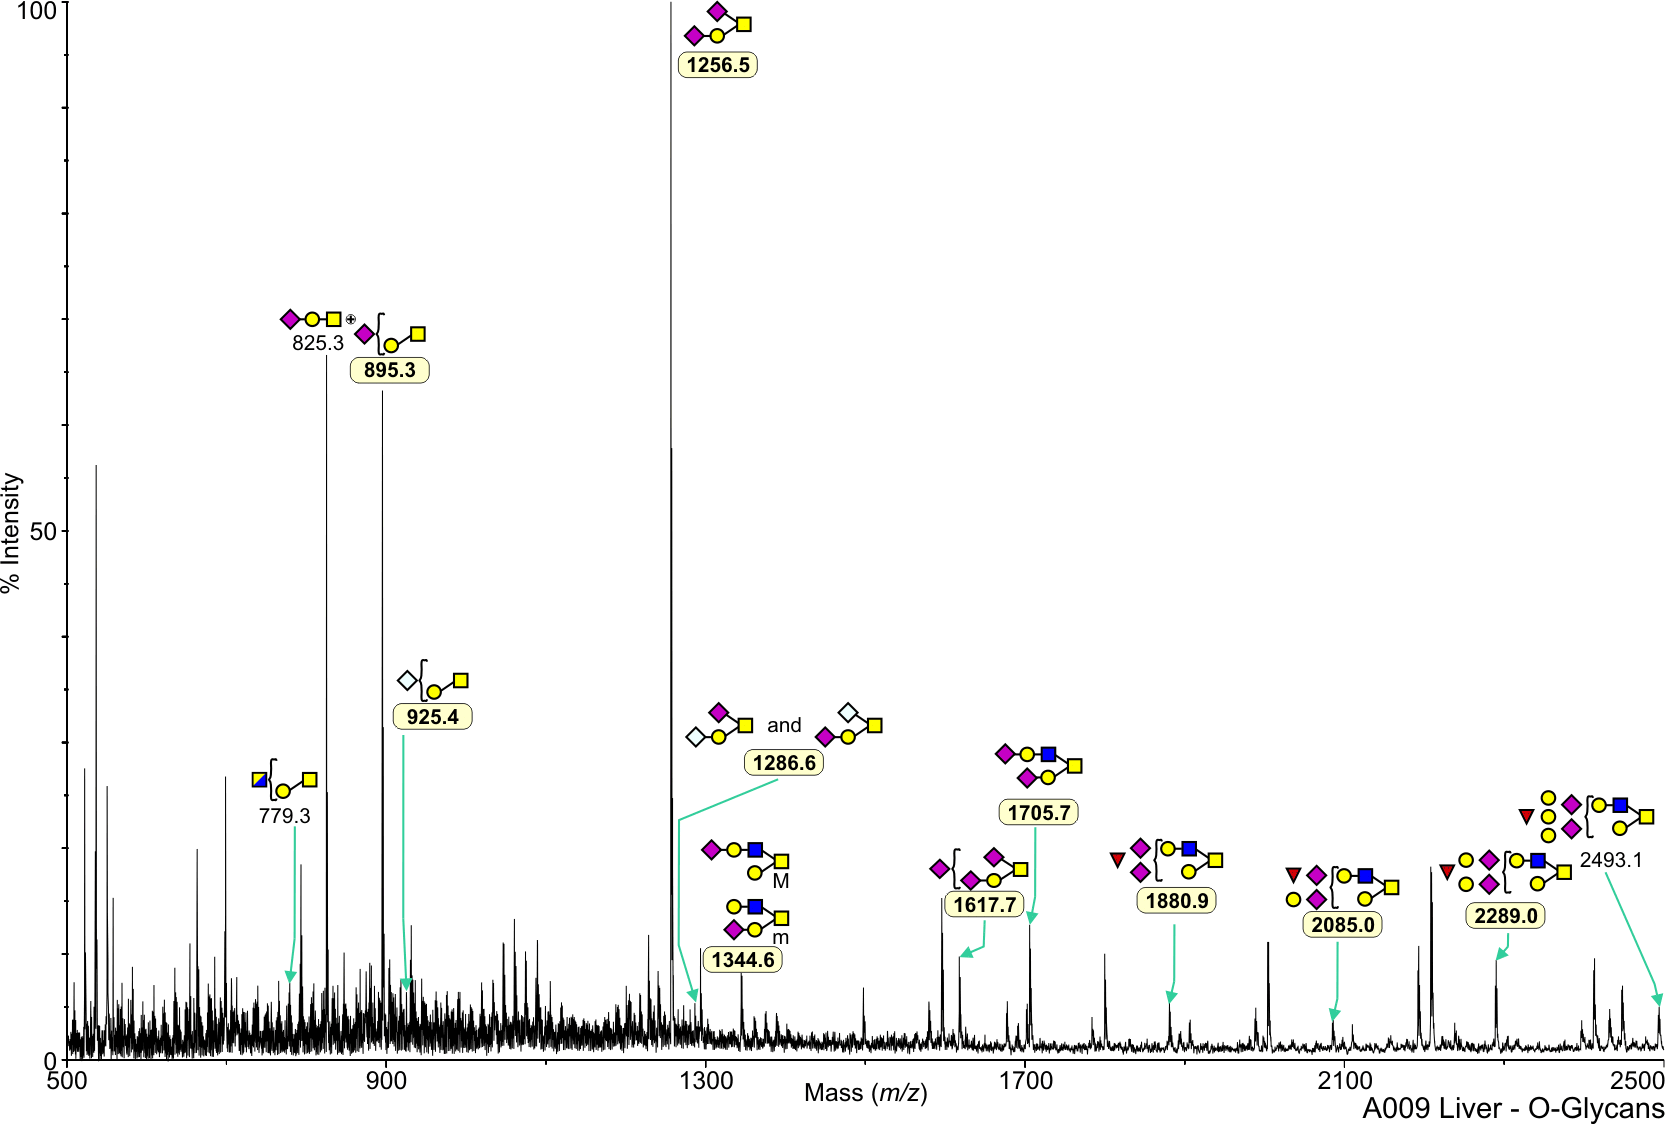
Human Heart O-Linked A009 Salomon,Daniel View experimental details      
Annotated file in JPG format Annotated file in PDF format
View Mass Spectrum data as text View Mass Peak file   Interactive Mass Spectrum Viewer
cfg_rRequest_1691
Human Heart O-Linked P004a Salomon,Daniel View experimental details      
   
       
cfg_rRequest_1691
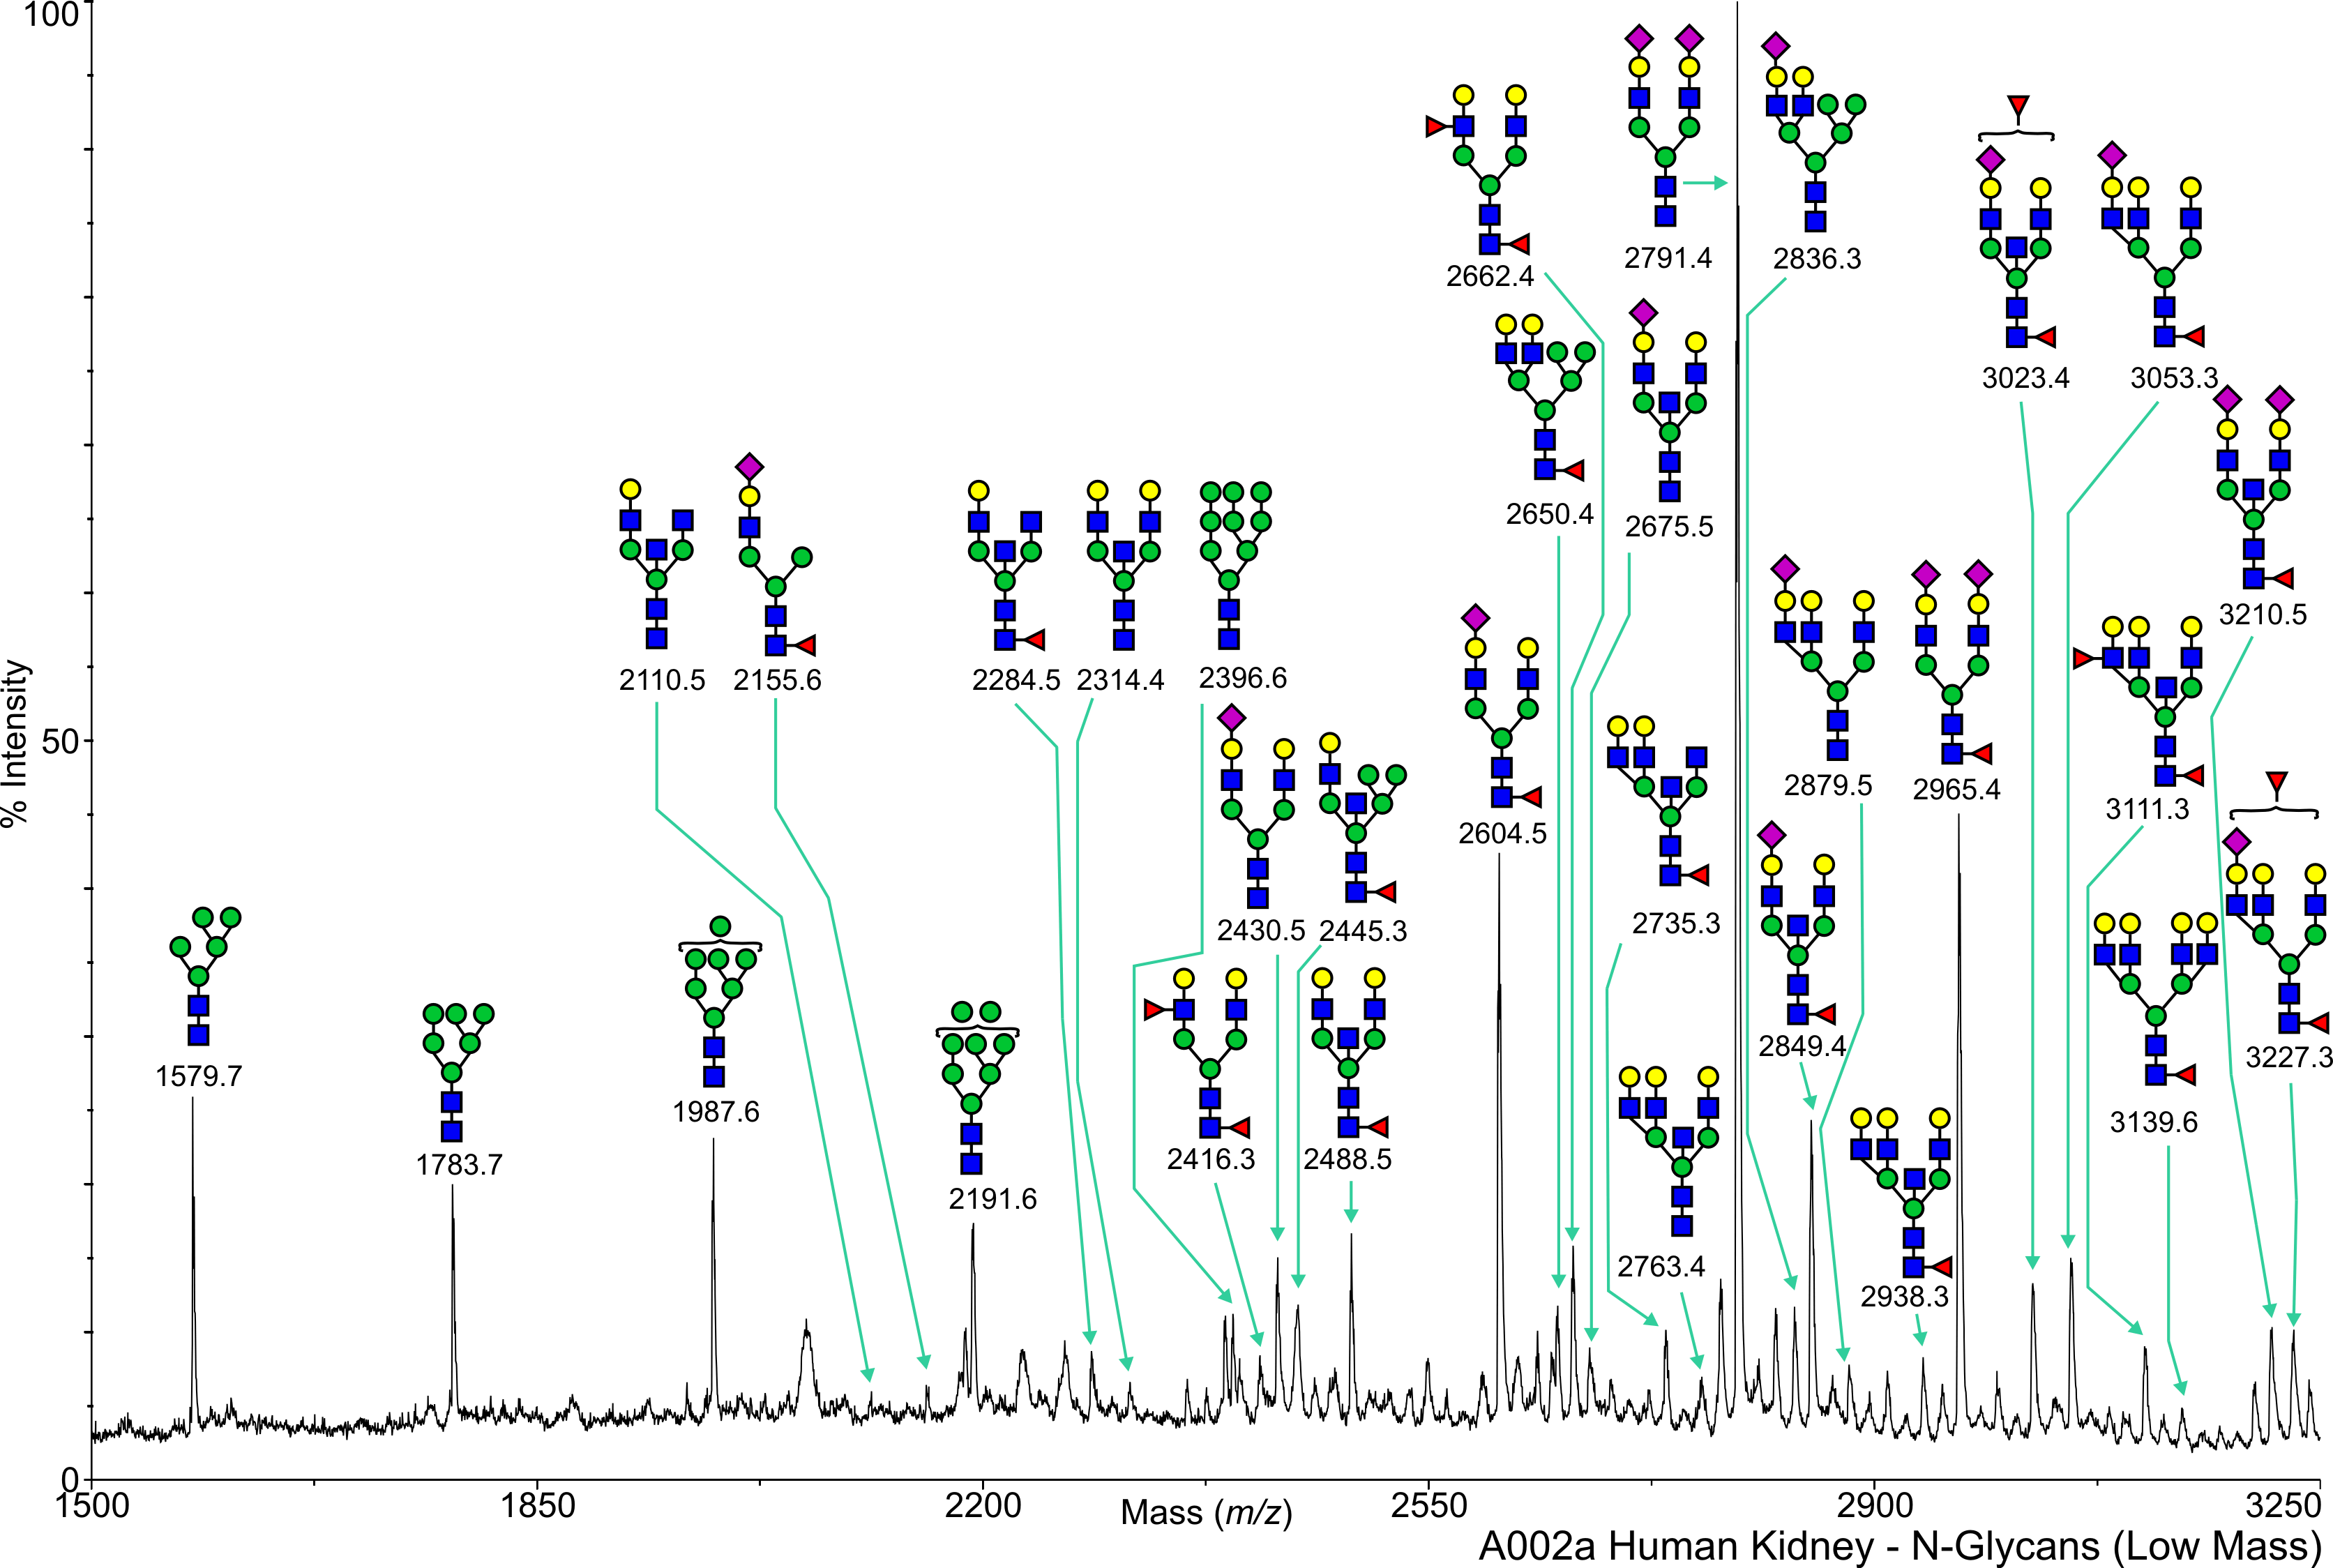
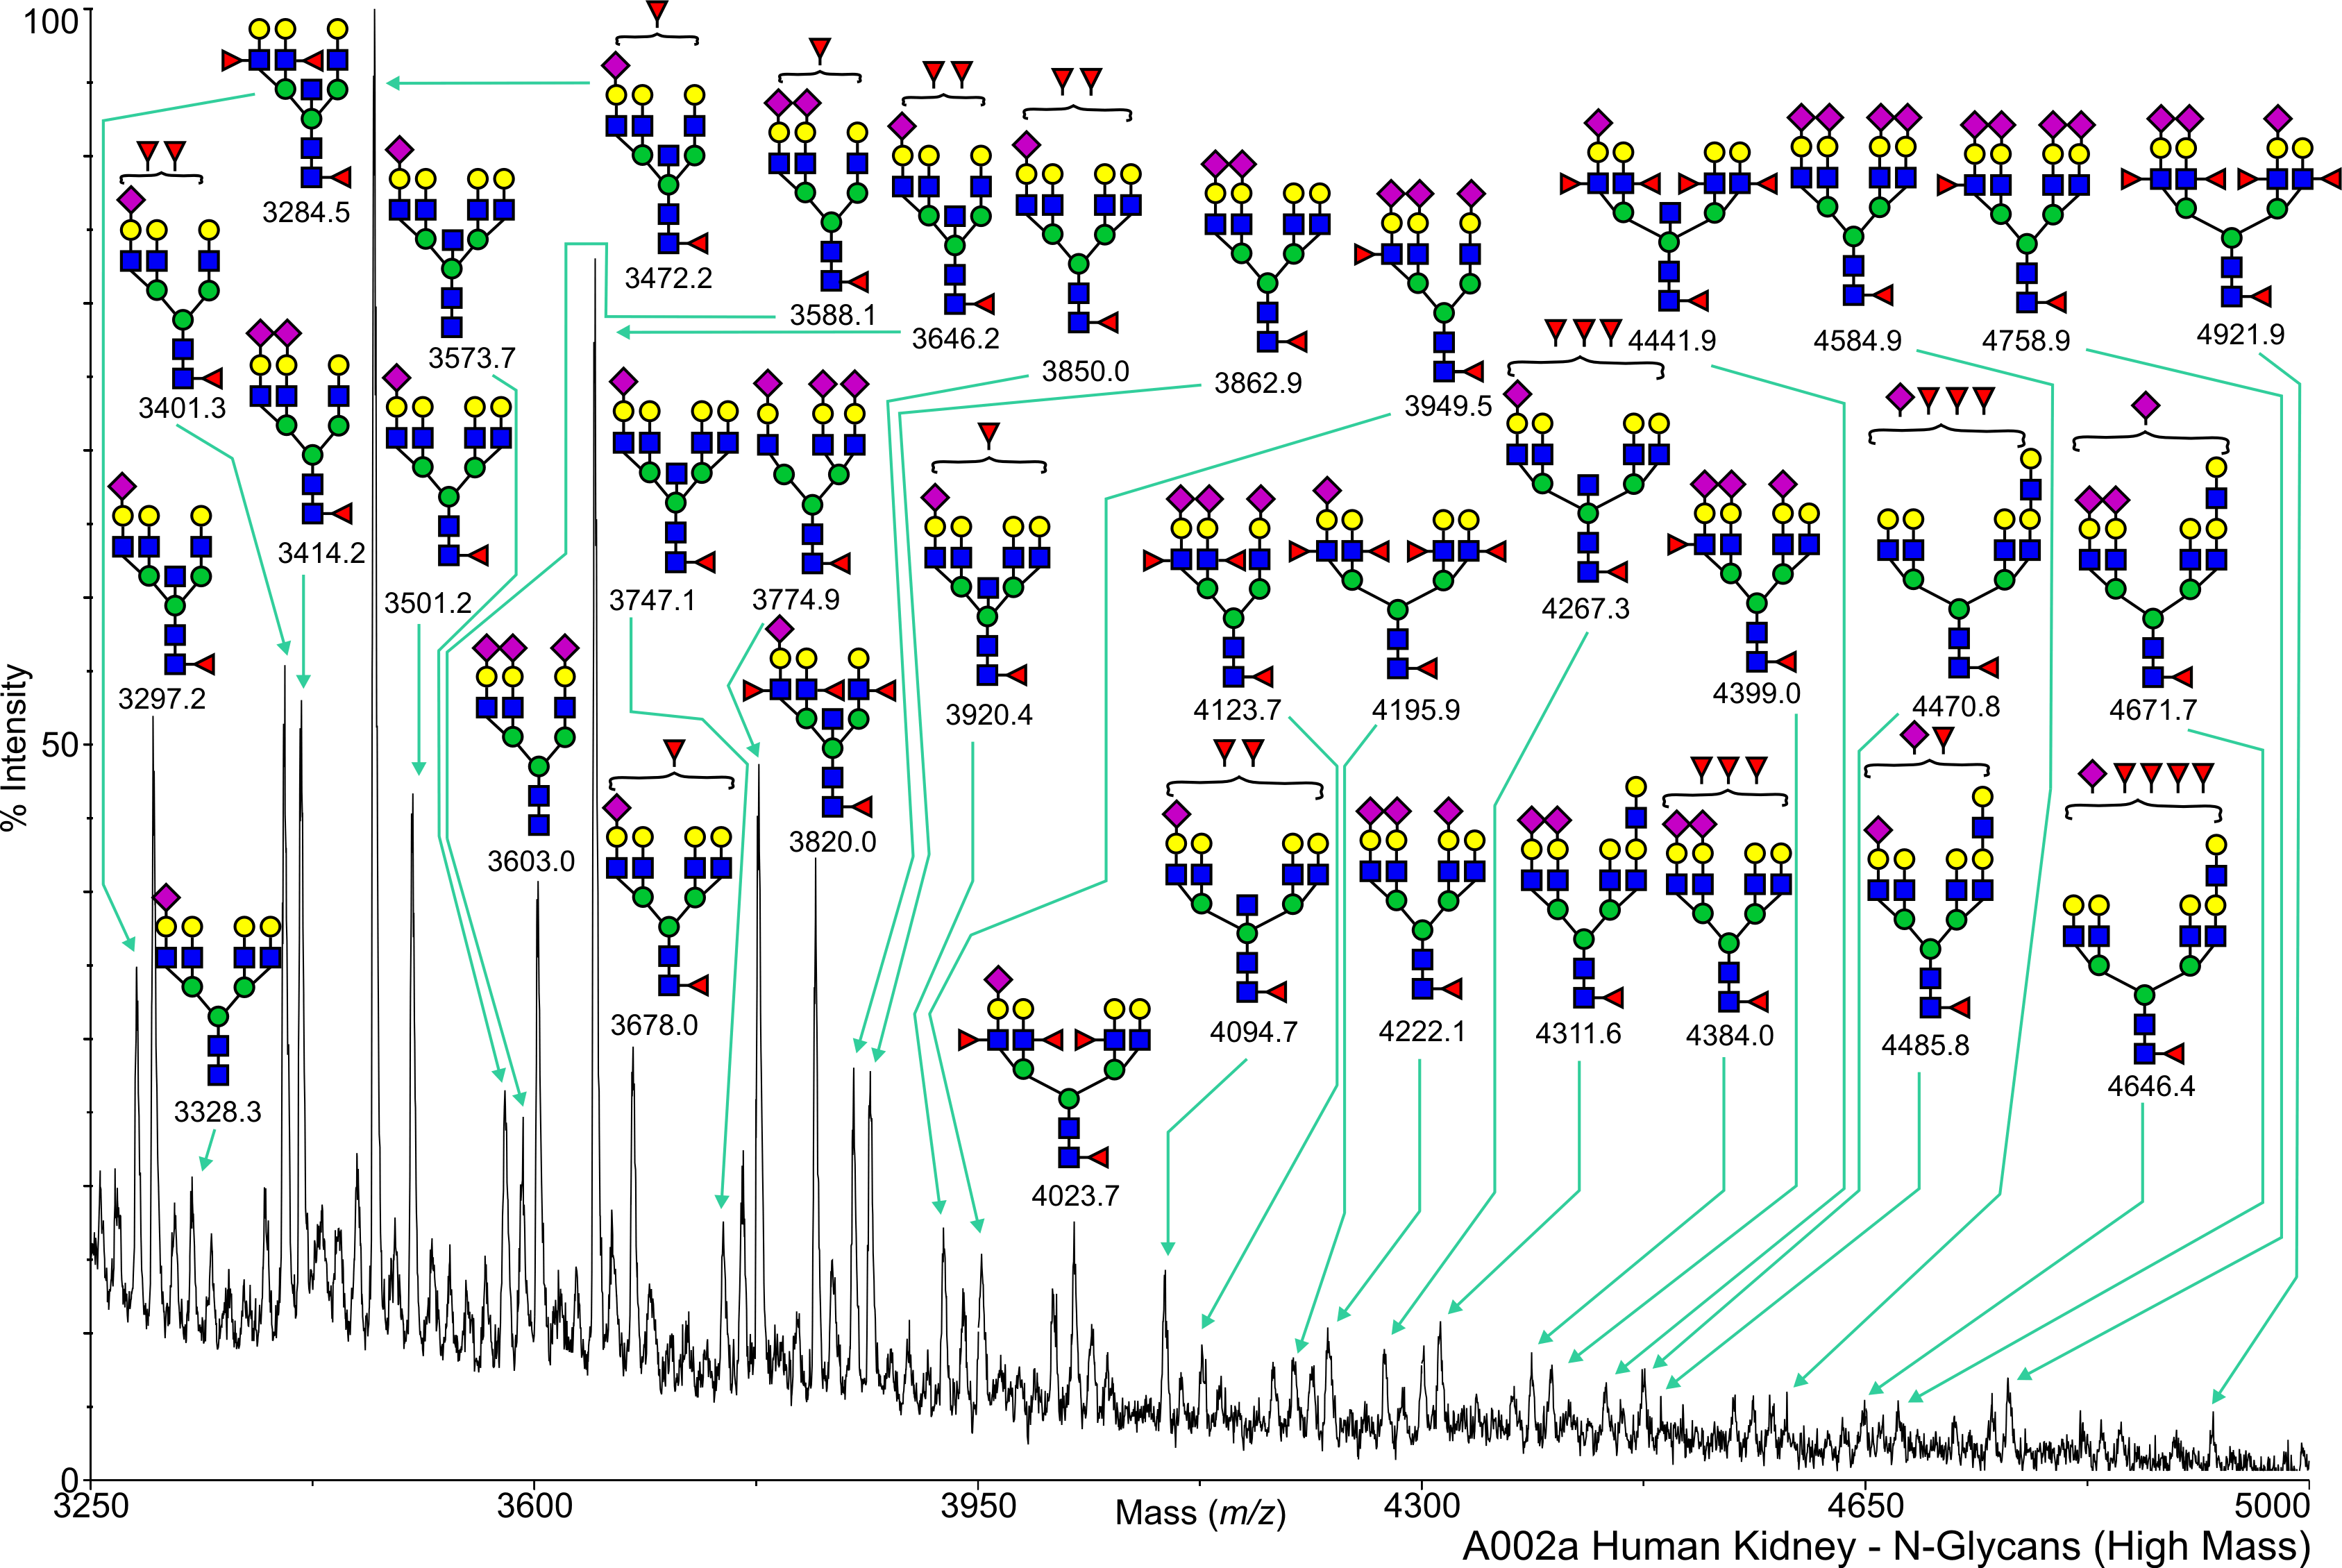
Human Kidney N-Linked A002a Salomon,Daniel View experimental details      
Annotated file for lower mass range in JPG formatAnnotated file for higher mass range in JPG format Annotated file for lower mass range in PDF formatAnnotated file for higher mass range in PDF format
       
cfg_rRequest_1691
Human Kidney N-Linked A004a Salomon,Daniel View experimental details      
   
       
cfg_rRequest_1691
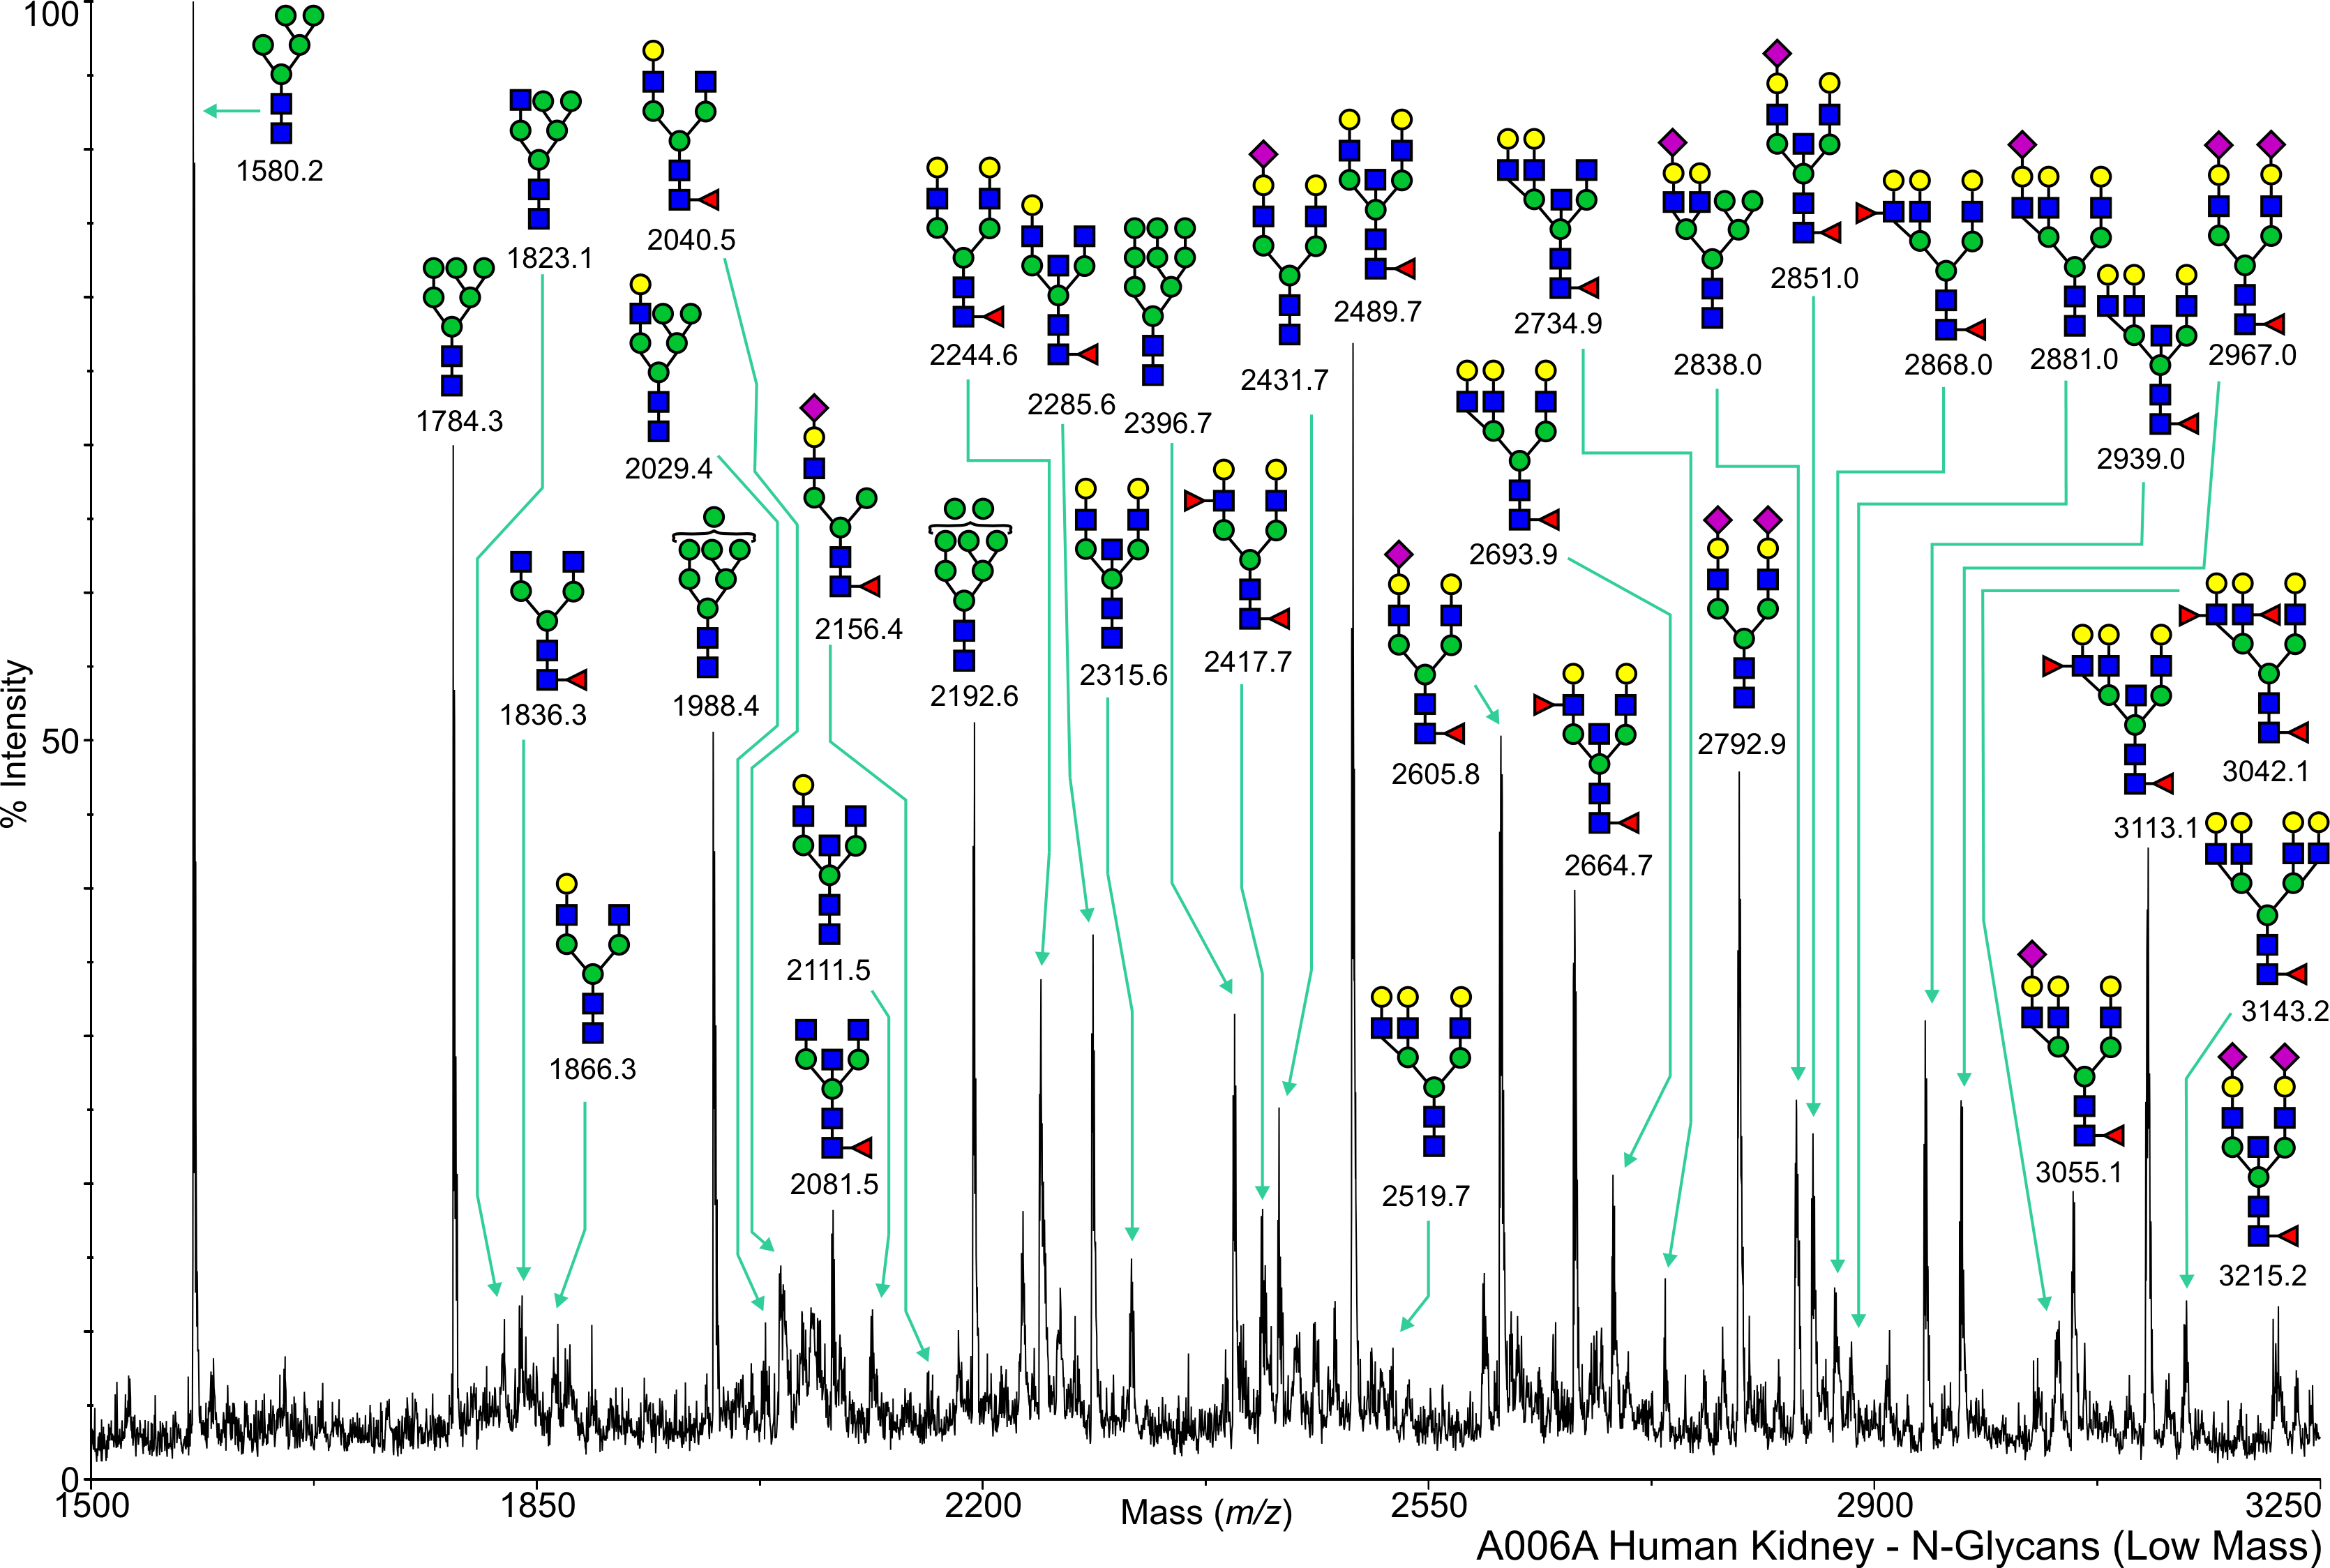
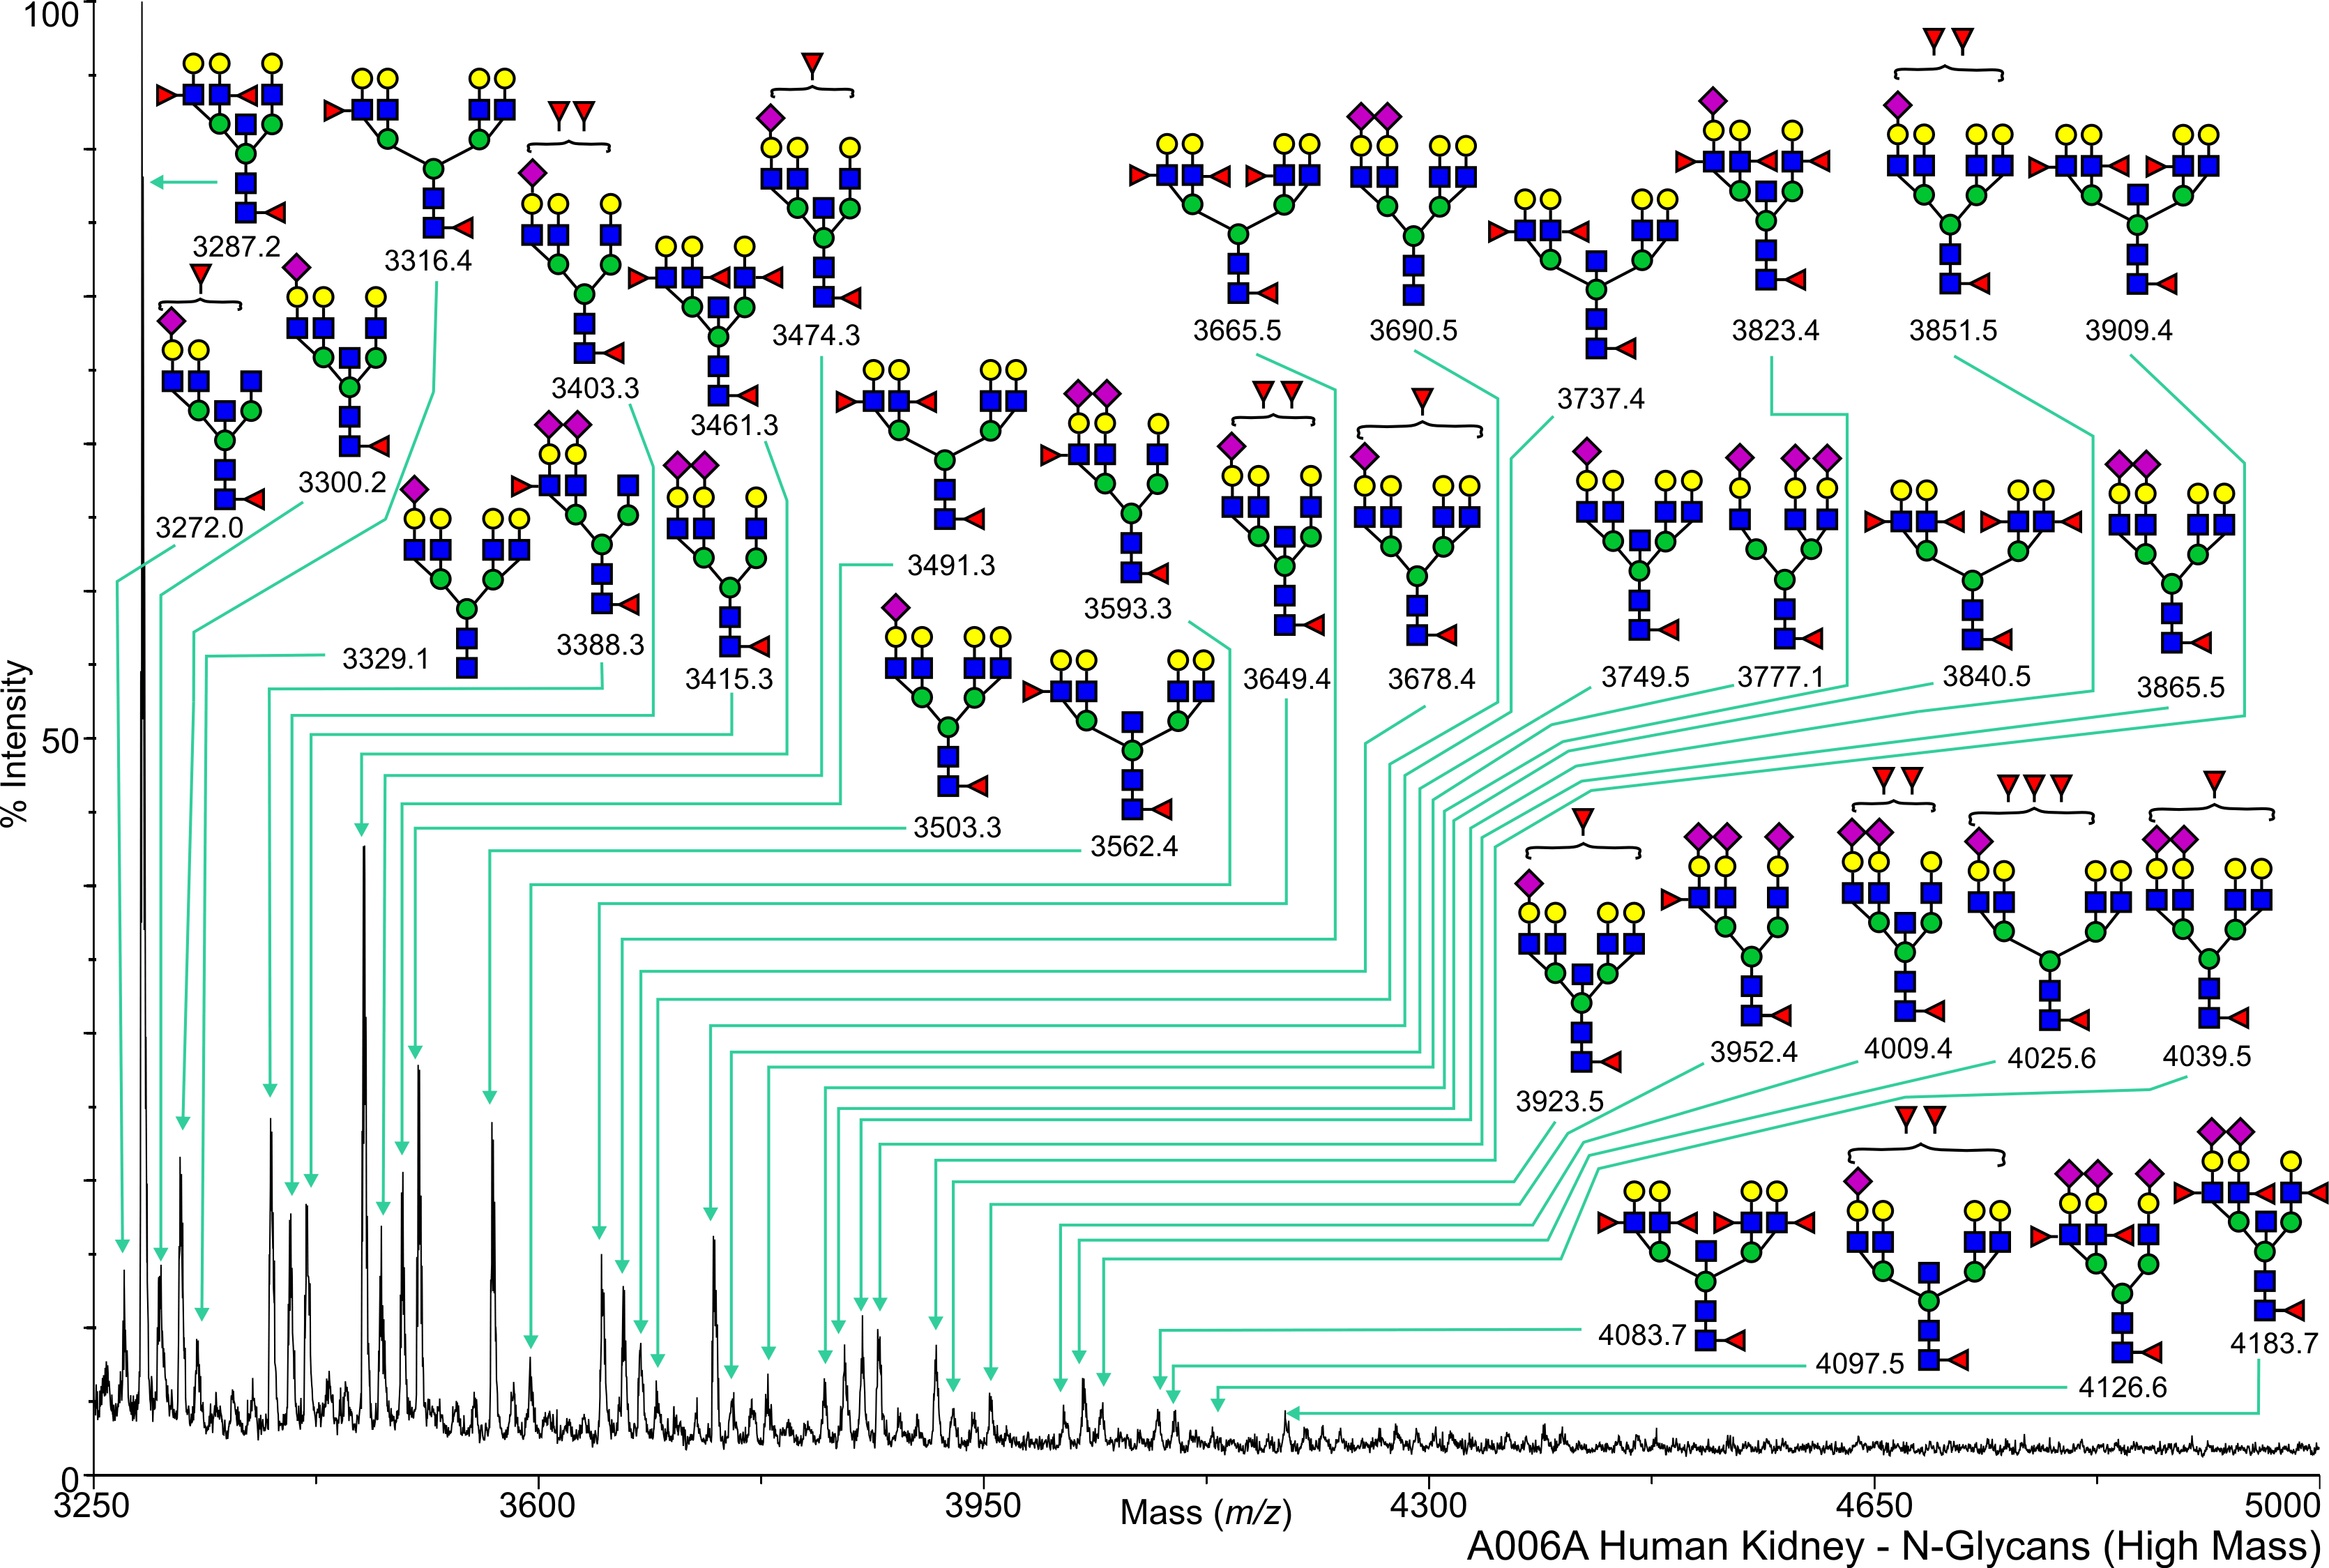
Human Kidney N-Linked A006a Salomon,Daniel View experimental details      
Annotated file for lower mass range in JPG formatAnnotated file for higher mass range in JPG format Annotated file for lower mass range in PDF formatAnnotated file for higher mass range in PDF format
       
cfg_rRequest_1691
Human Kidney N-Linked P004a Salomon,Daniel View experimental details      
   
       
cfg_rRequest_1691
Human Kidney O-Linked A002a Salomon,Daniel View experimental details      
   
       
cfg_rRequest_1691
Human Kidney O-Linked A004a Salomon,Daniel View experimental details      
   
       
cfg_rRequest_1691
Human Kidney O-Linked A006a Salomon,Daniel View experimental details      
   
       
cfg_rRequest_1691
Human Kidney O-Linked P004a Salomon,Daniel View experimental details      
   
       
cfg_rRequest_1691
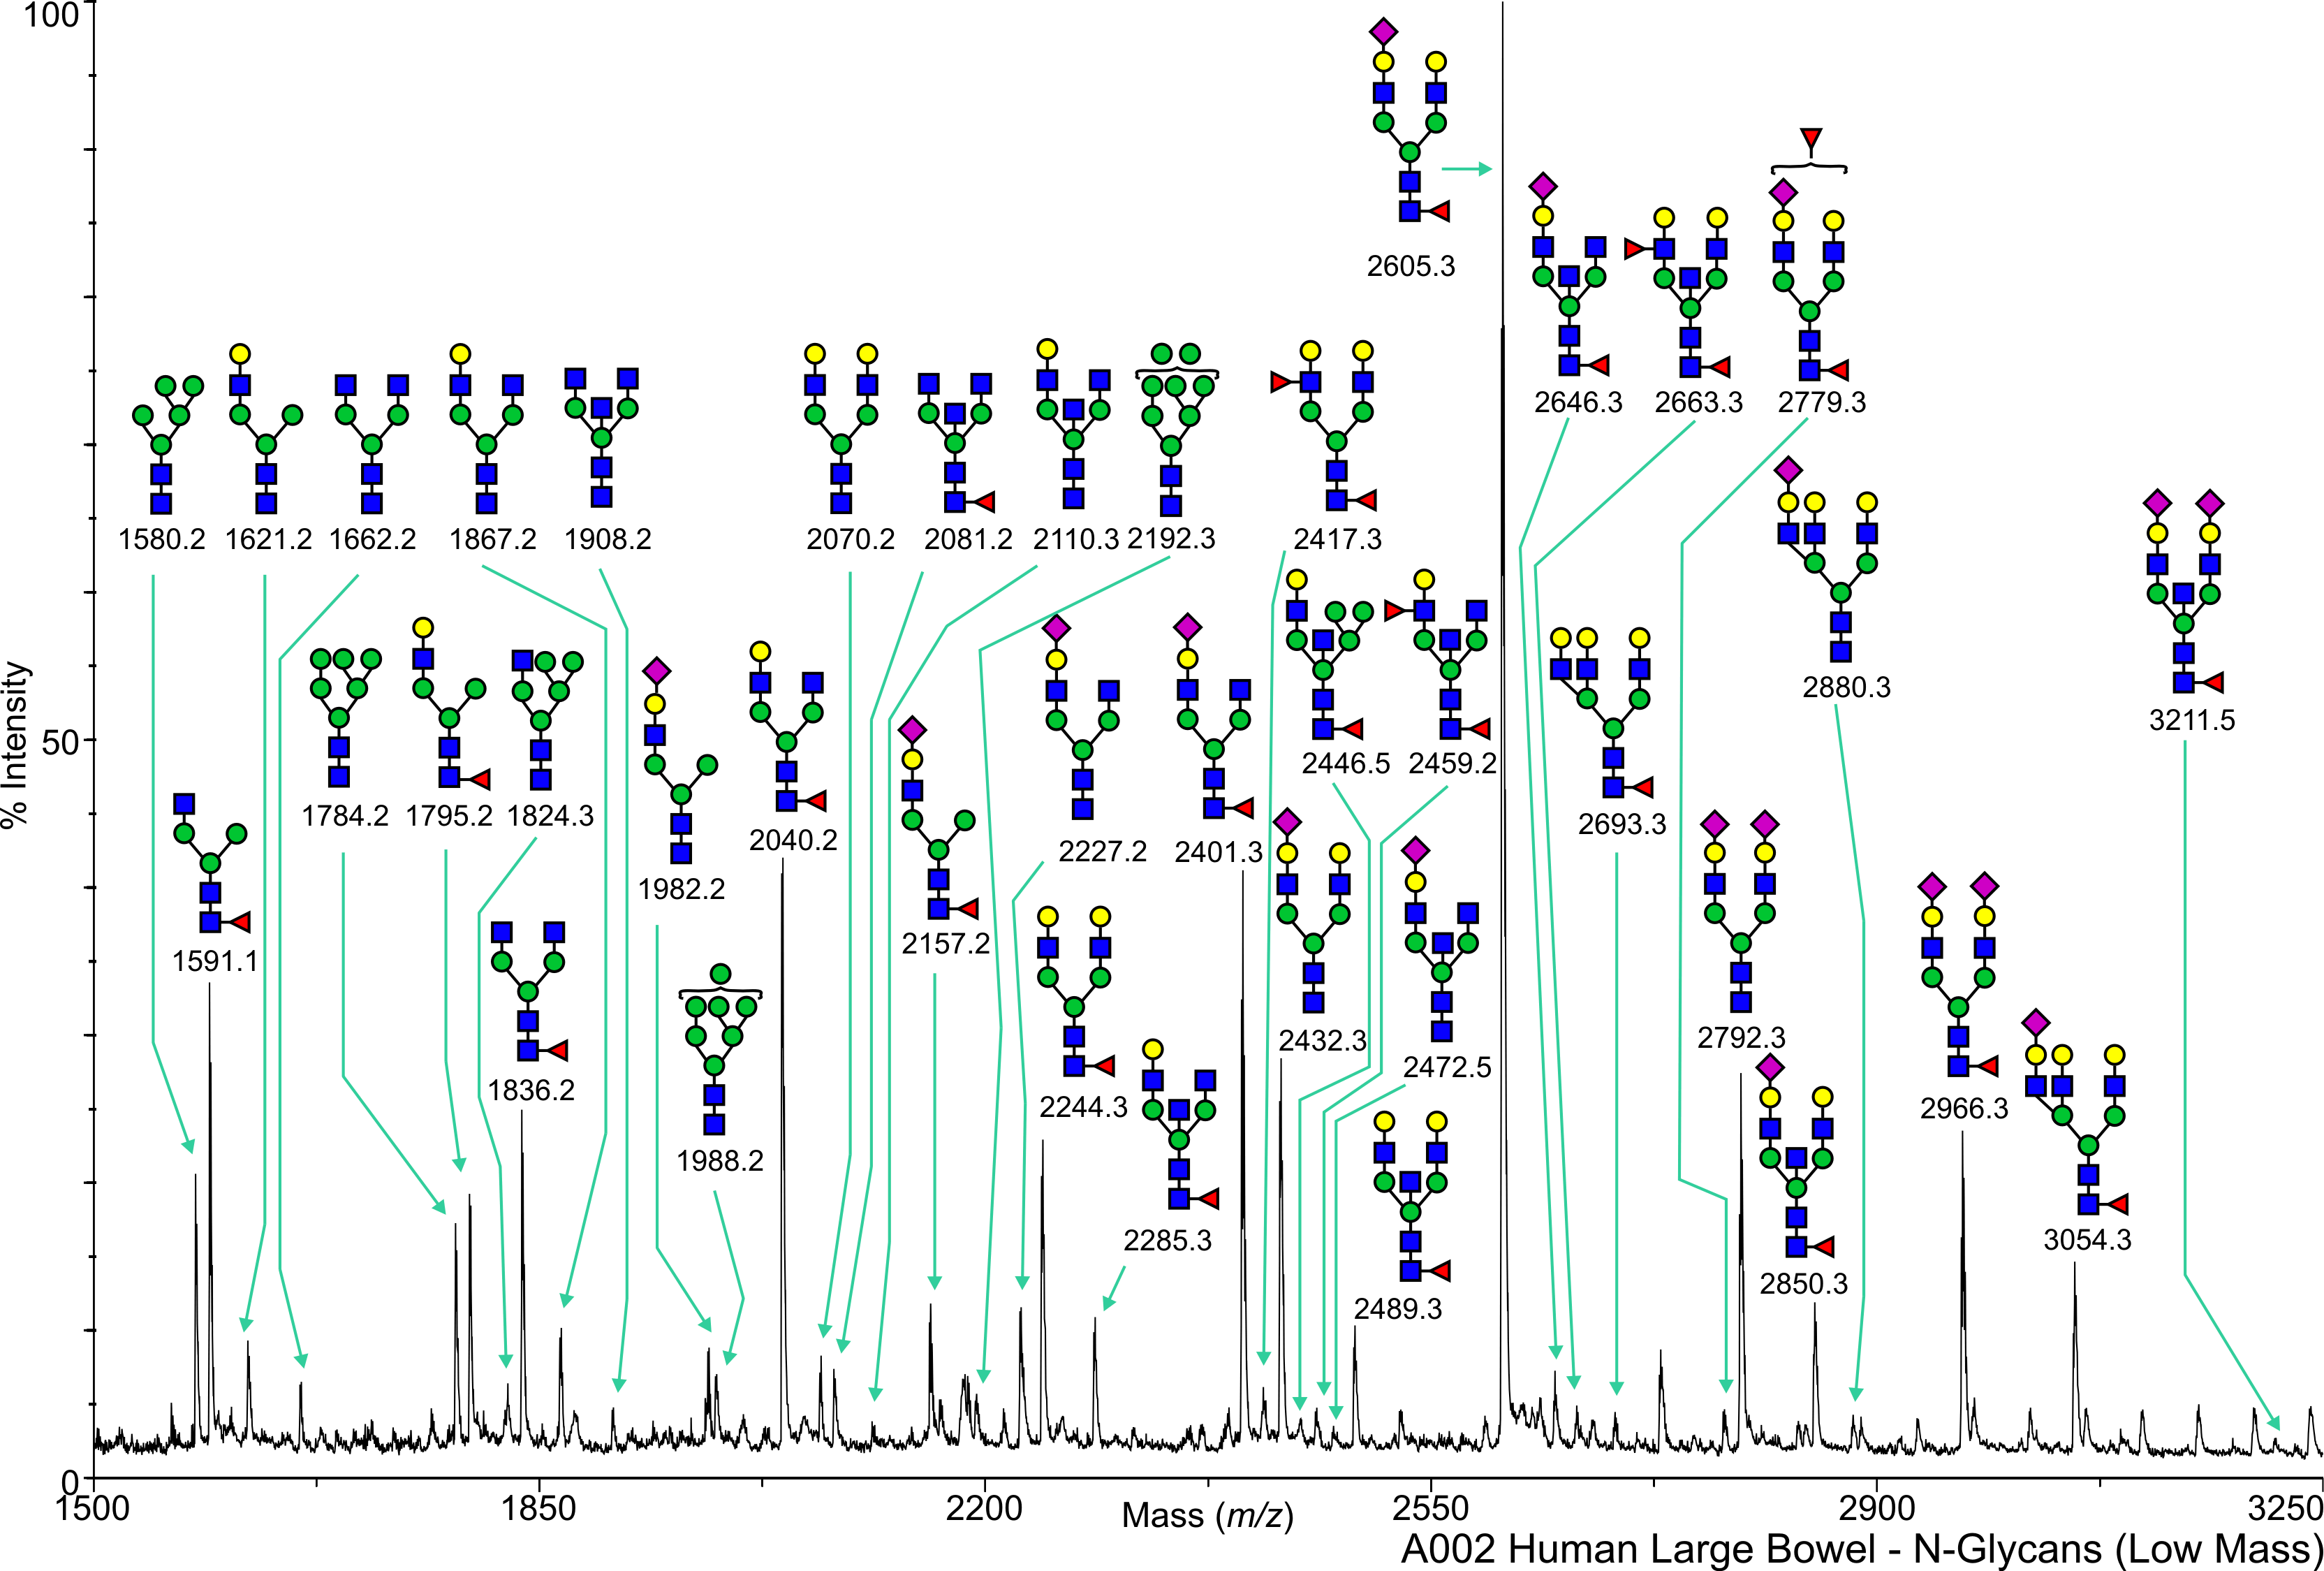
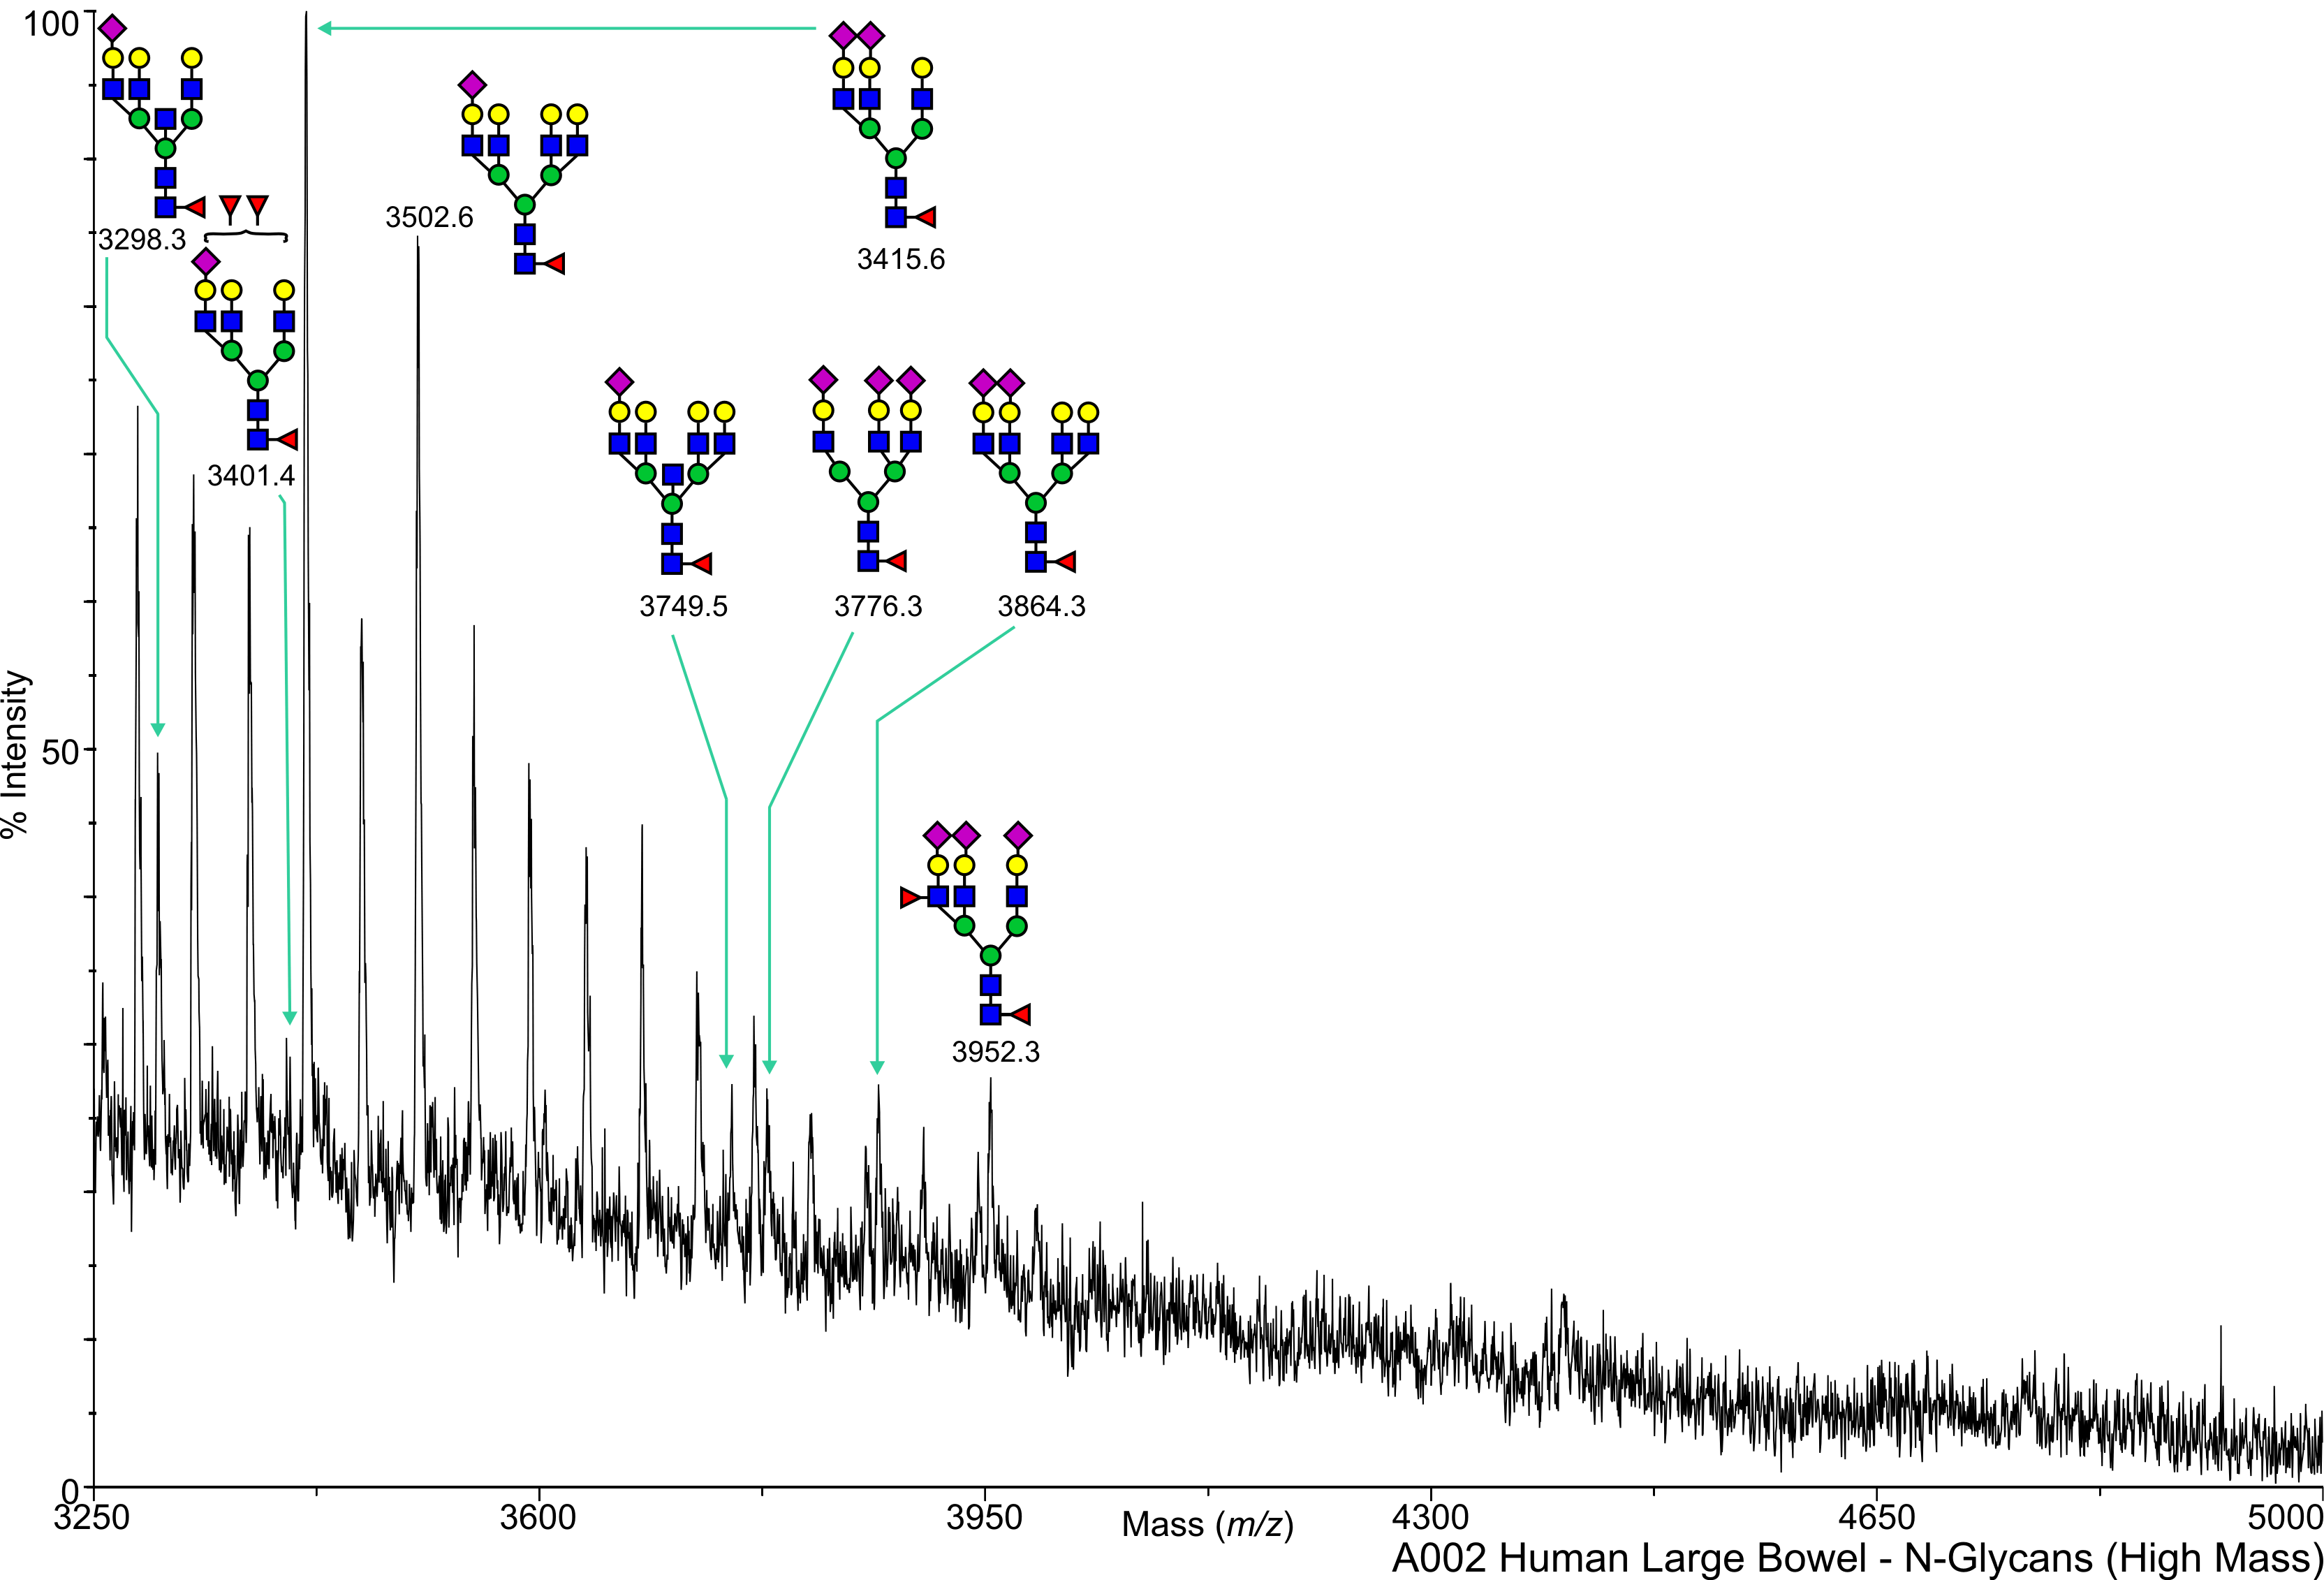
Human Large Bowel N-Linked A002 Salomon,Daniel View experimental details      
Annotated file for lower mass range in JPG formatAnnotated file for higher mass range in JPG format Annotated file for lower mass range in PDF formatAnnotated file for higher mass range in PDF format
       
cfg_rRequest_1691
Human Large Bowel N-Linked A004 Salomon,Daniel View experimental details      
   
       
cfg_rRequest_1691
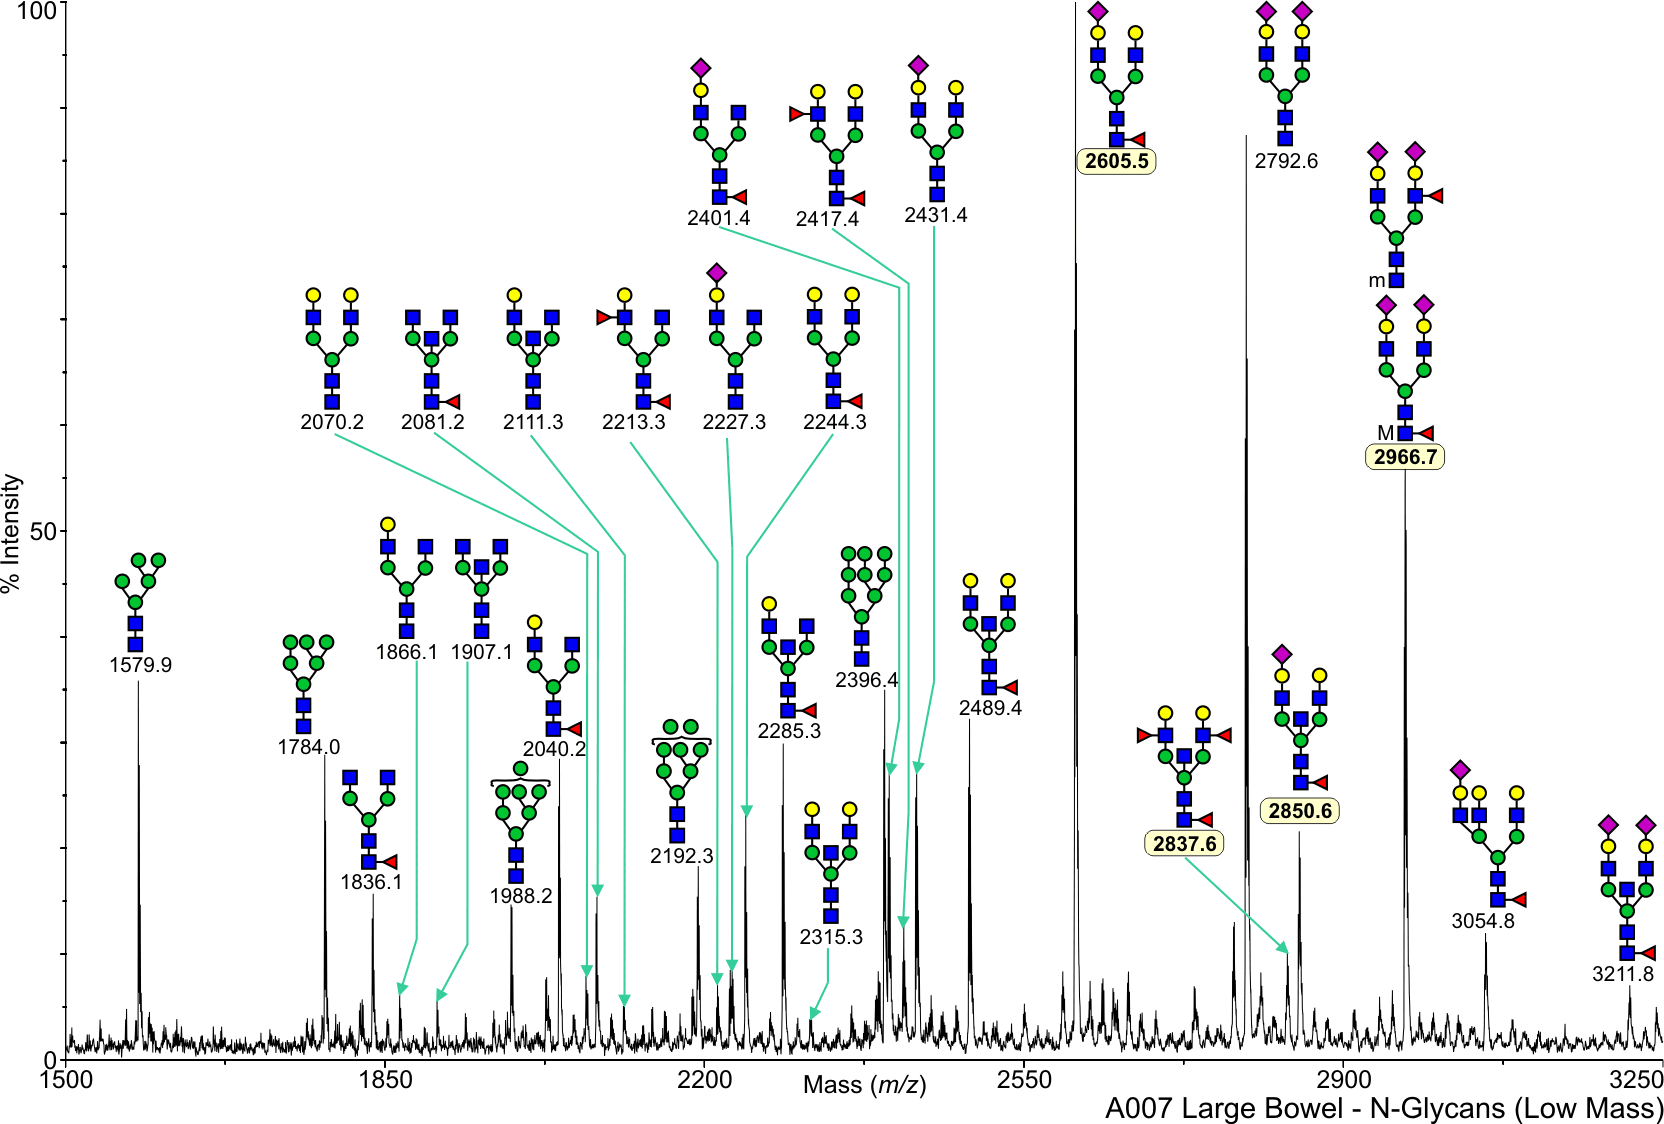
Human Large Bowel N-Linked A007 Salomon,Daniel View experimental details      
Annotated file for lower mass range in JPG formatAnnotated file for higher mass range in JPG format Annotated file for lower mass range in PDF formatAnnotated file for higher mass range in PDF format
View Mass Spectrum data as text View Mass Peak file   Interactive Mass Spectrum Viewer
cfg_rRequest_1691
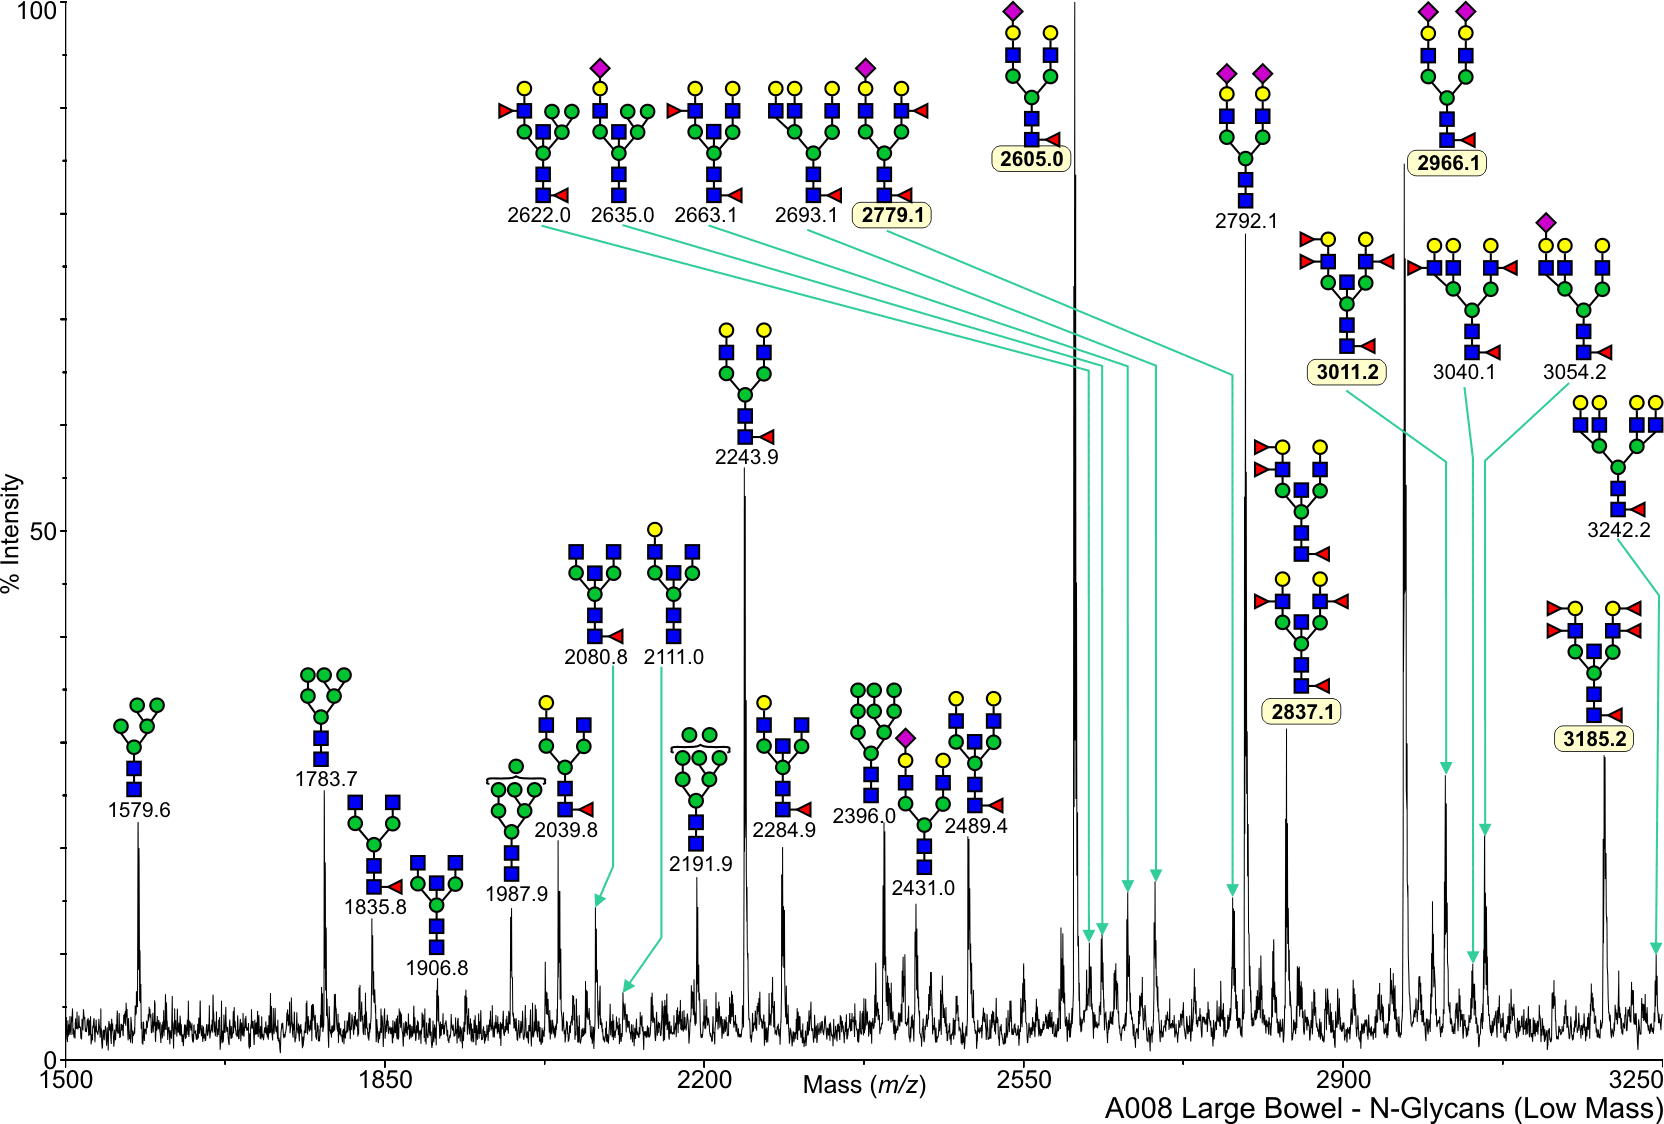
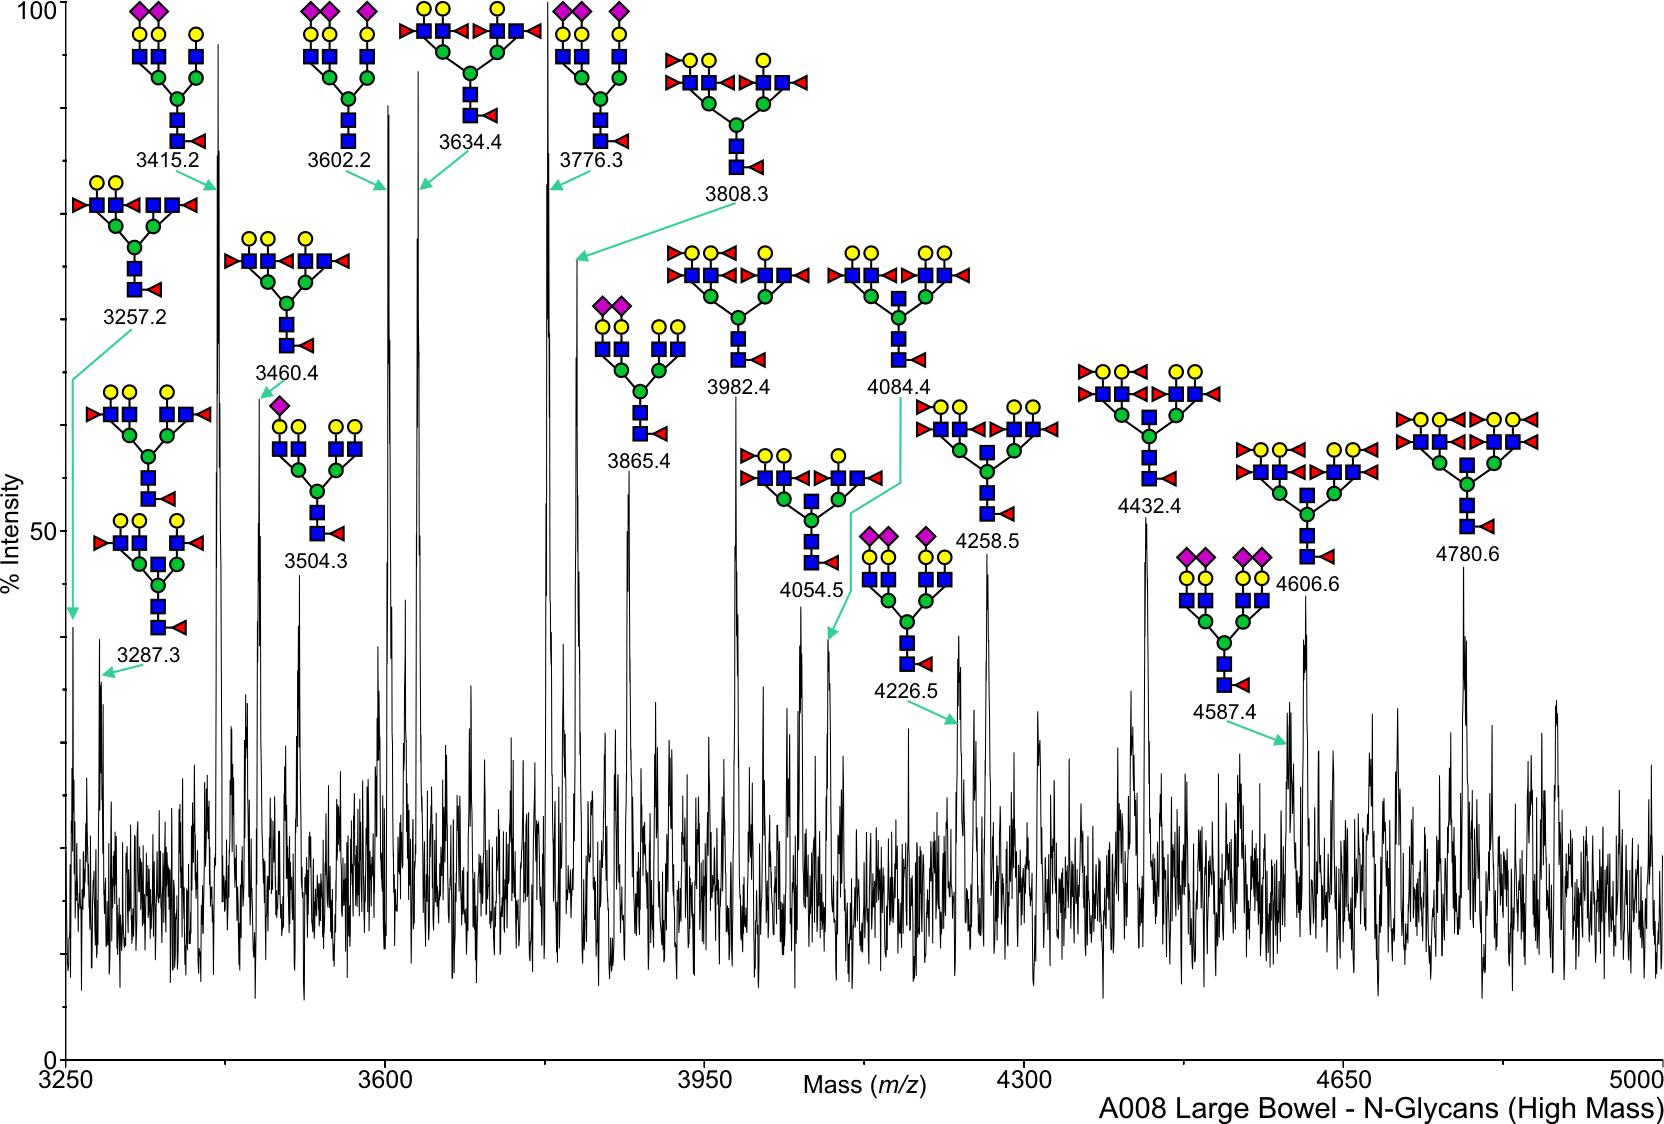
Human Large Bowel N-Linked A008 Salomon,Daniel View experimental details      
Annotated file for lower mass range in JPG formatAnnotated file for higher mass range in JPG format Annotated file for lower mass range in PDF formatAnnotated file for higher mass range in PDF format
View Mass Spectrum data as text View Mass Peak file   Interactive Mass Spectrum Viewer
cfg_rRequest_1691
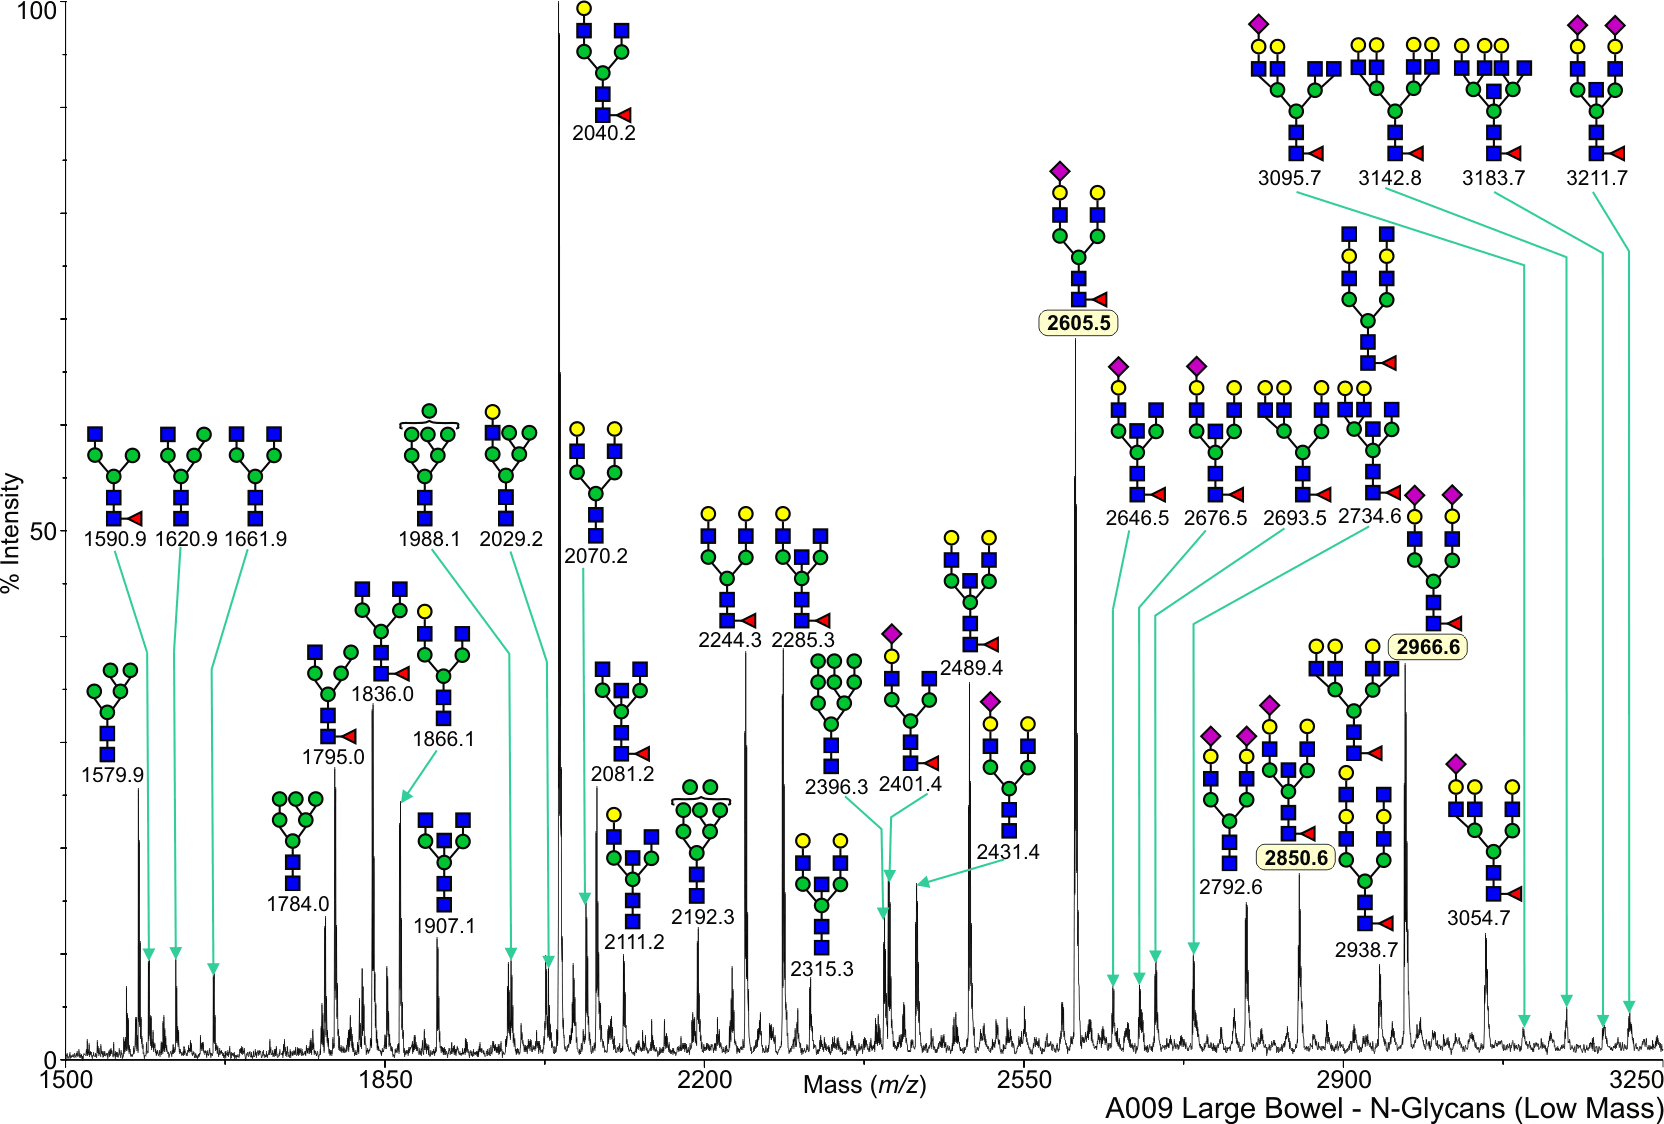
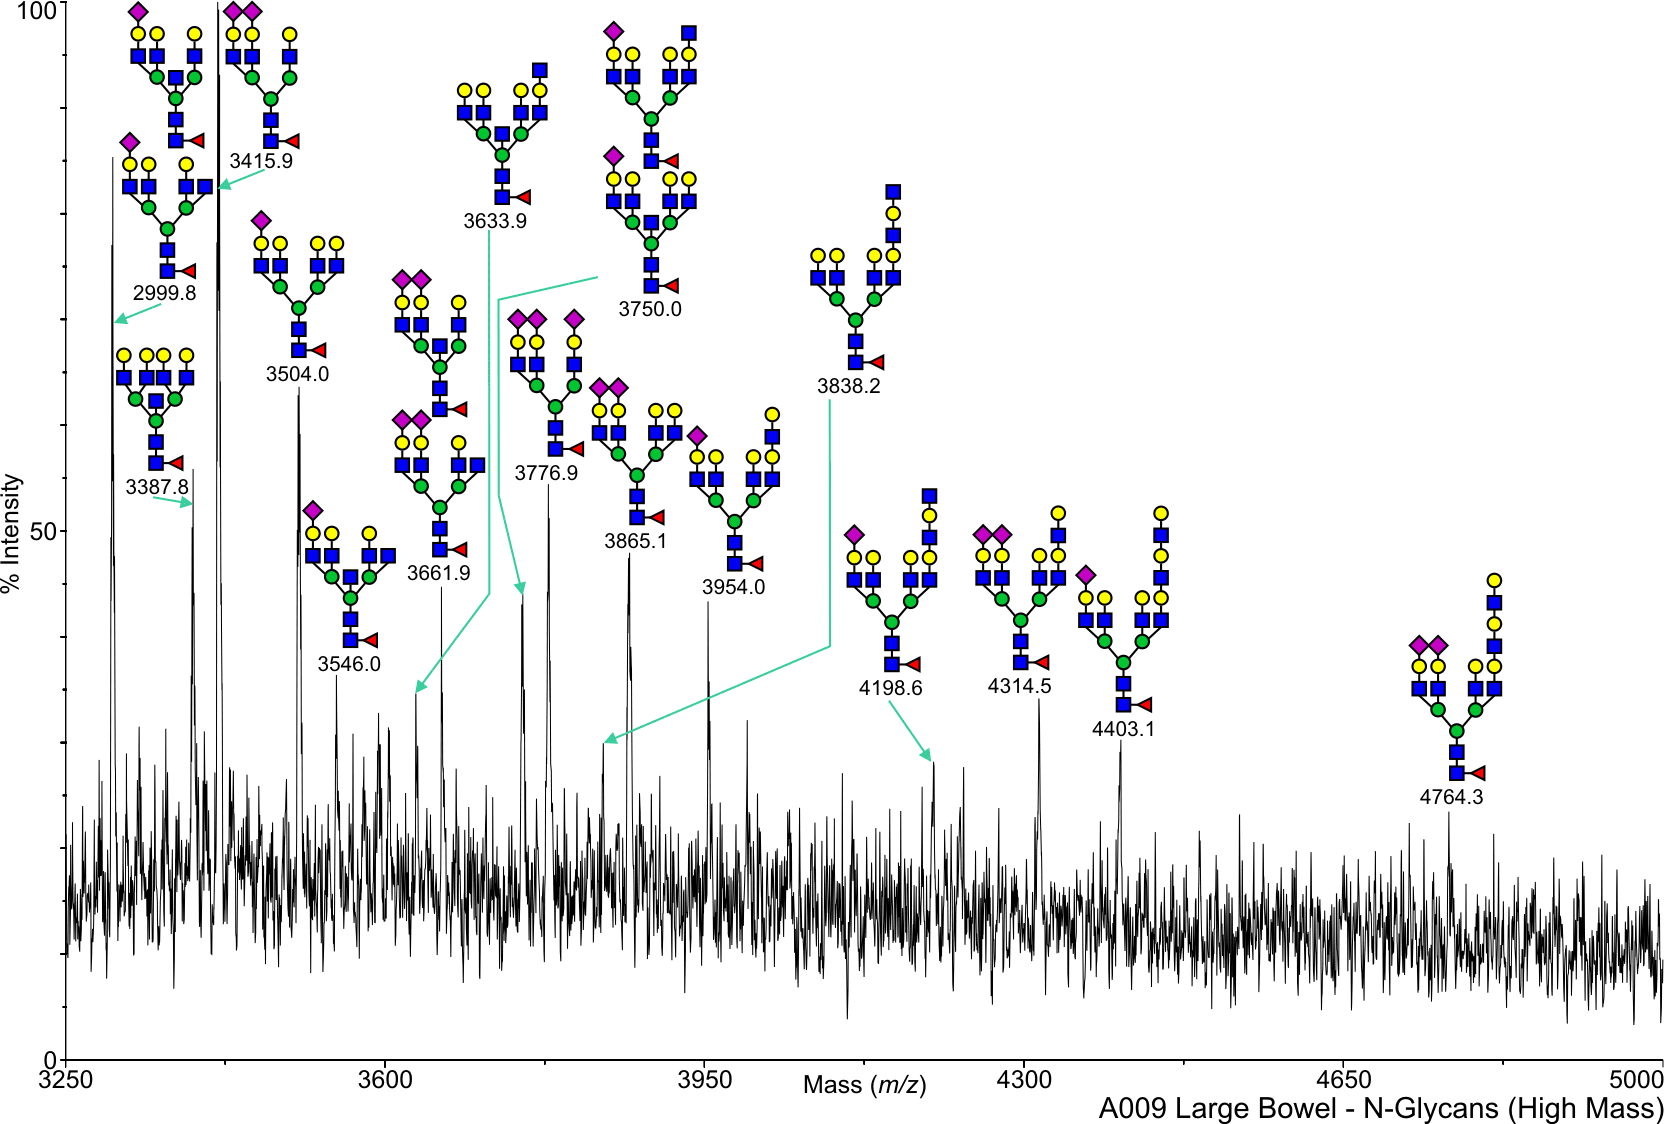
Human Large Bowel N-Linked A009 Salomon,Daniel View experimental details      
Annotated file for lower mass range in JPG formatAnnotated file for higher mass range in JPG format Annotated file for lower mass range in PDF formatAnnotated file for higher mass range in PDF format
View Mass Spectrum data as text View Mass Peak file   Interactive Mass Spectrum Viewer
cfg_rRequest_1691
Human Large Bowel O-Linked A002 Salomon,Daniel View experimental details      
   
       
cfg_rRequest_1691
Human Large Bowel O-Linked A004 Salomon,Daniel View experimental details      
   
       
cfg_rRequest_1691
Human Large Bowel O-Linked A007 Salomon,Daniel View experimental details      
   
View Mass Spectrum data as text      
cfg_rRequest_1691
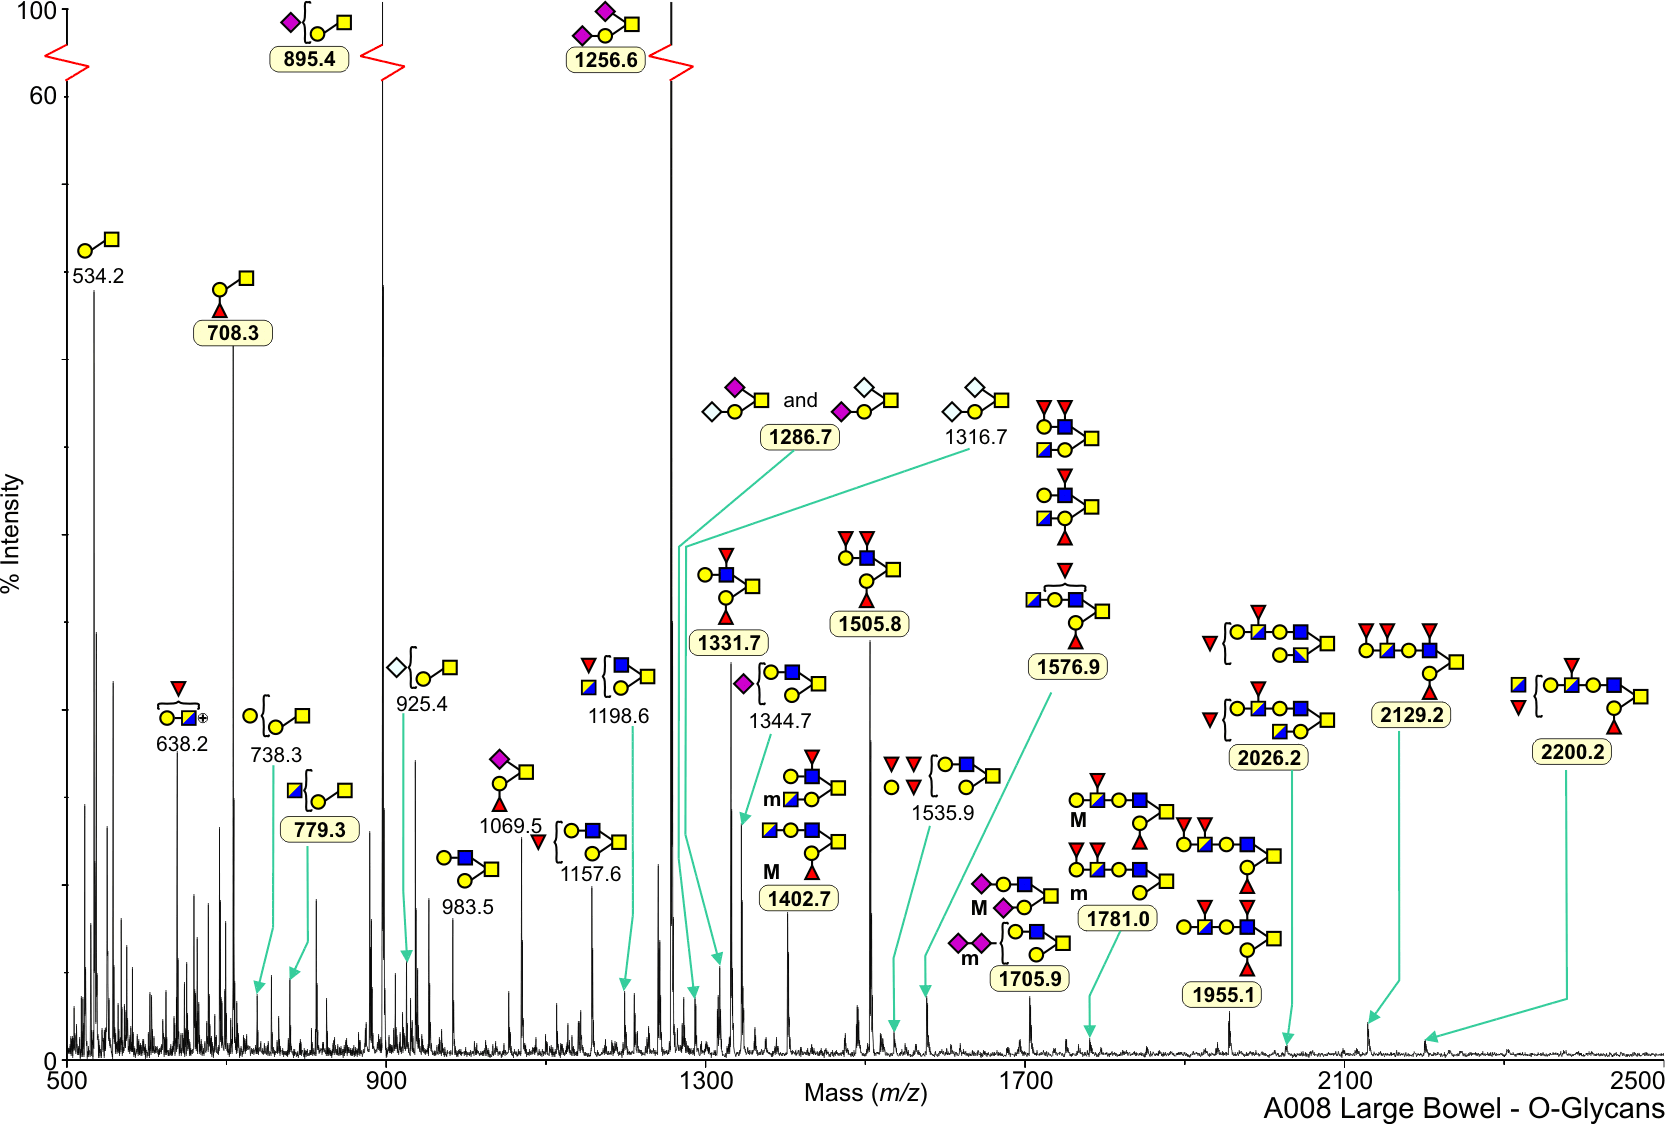
Human Large Bowel O-Linked A008 Salomon,Daniel View experimental details      
Annotated file in JPG format Annotated file in PDF format
View Mass Spectrum data as text View Mass Peak file   Interactive Mass Spectrum Viewer
cfg_rRequest_1691
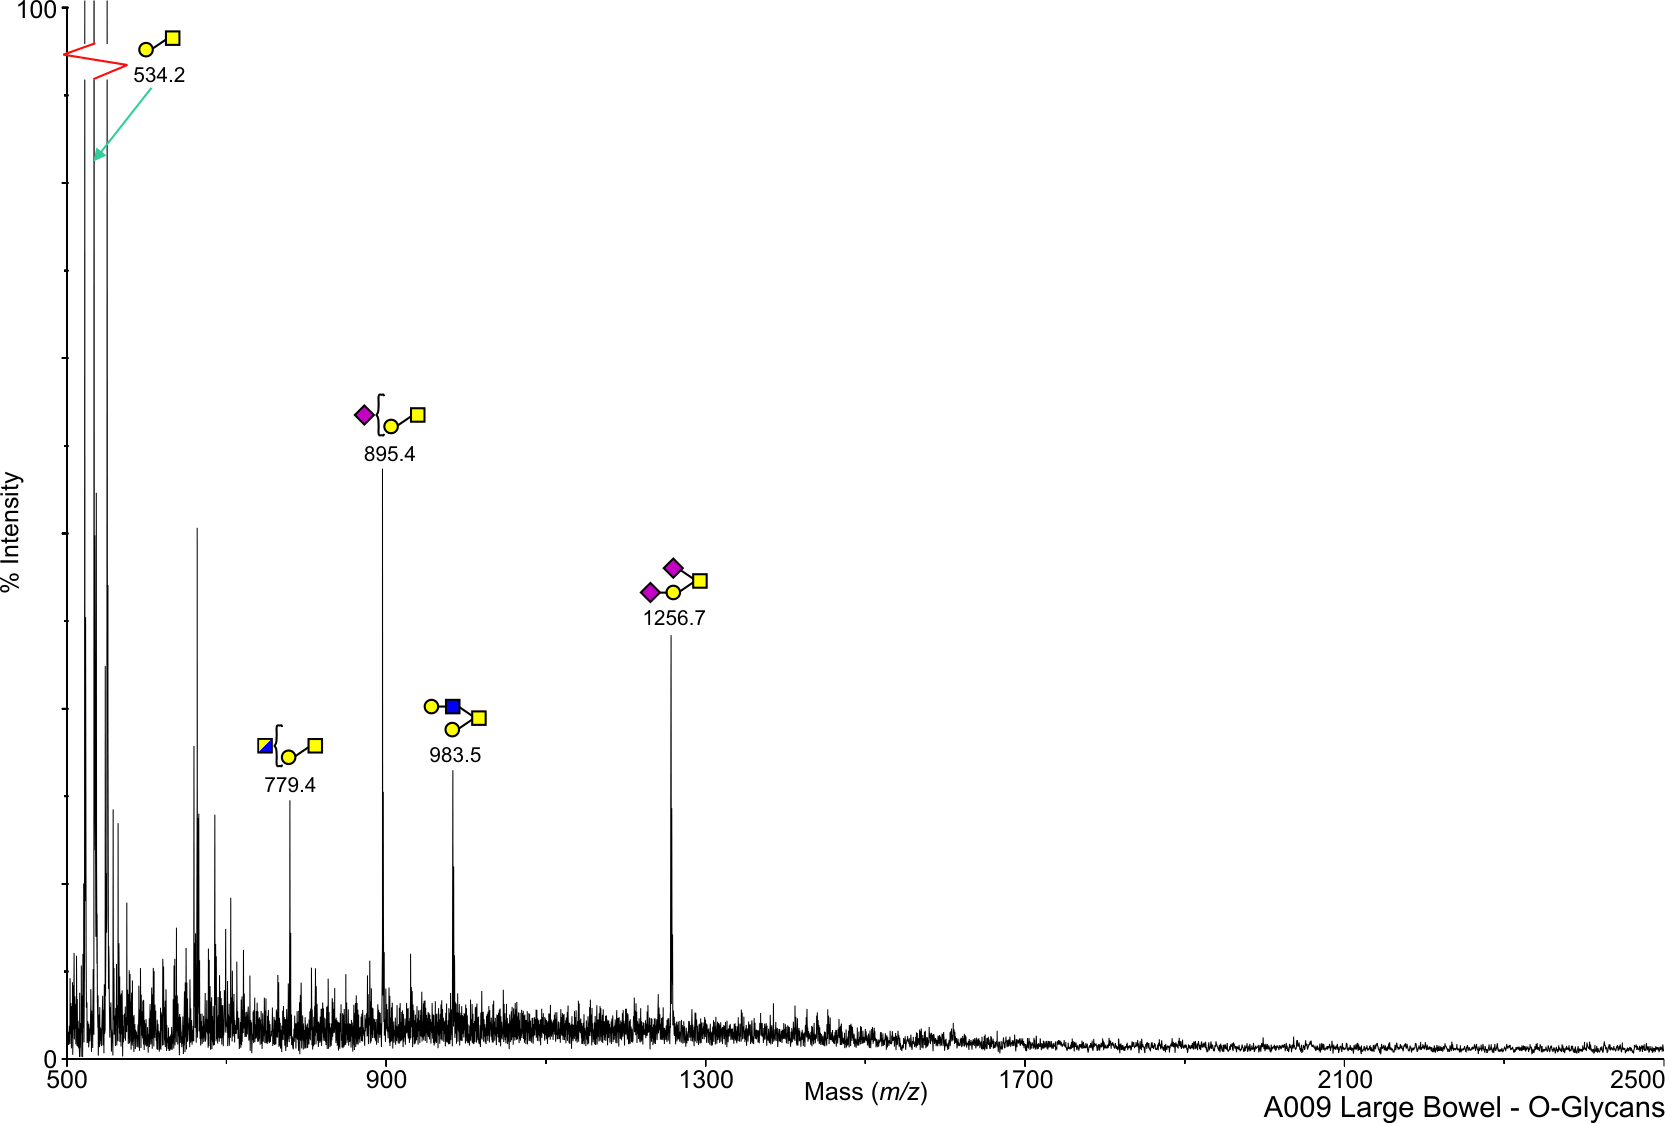
Human Large Bowel O-Linked A009 Salomon,Daniel View experimental details      
Annotated file in JPG format Annotated file in PDF format
View Mass Spectrum data as text View Mass Peak file   Interactive Mass Spectrum Viewer
cfg_rRequest_1691
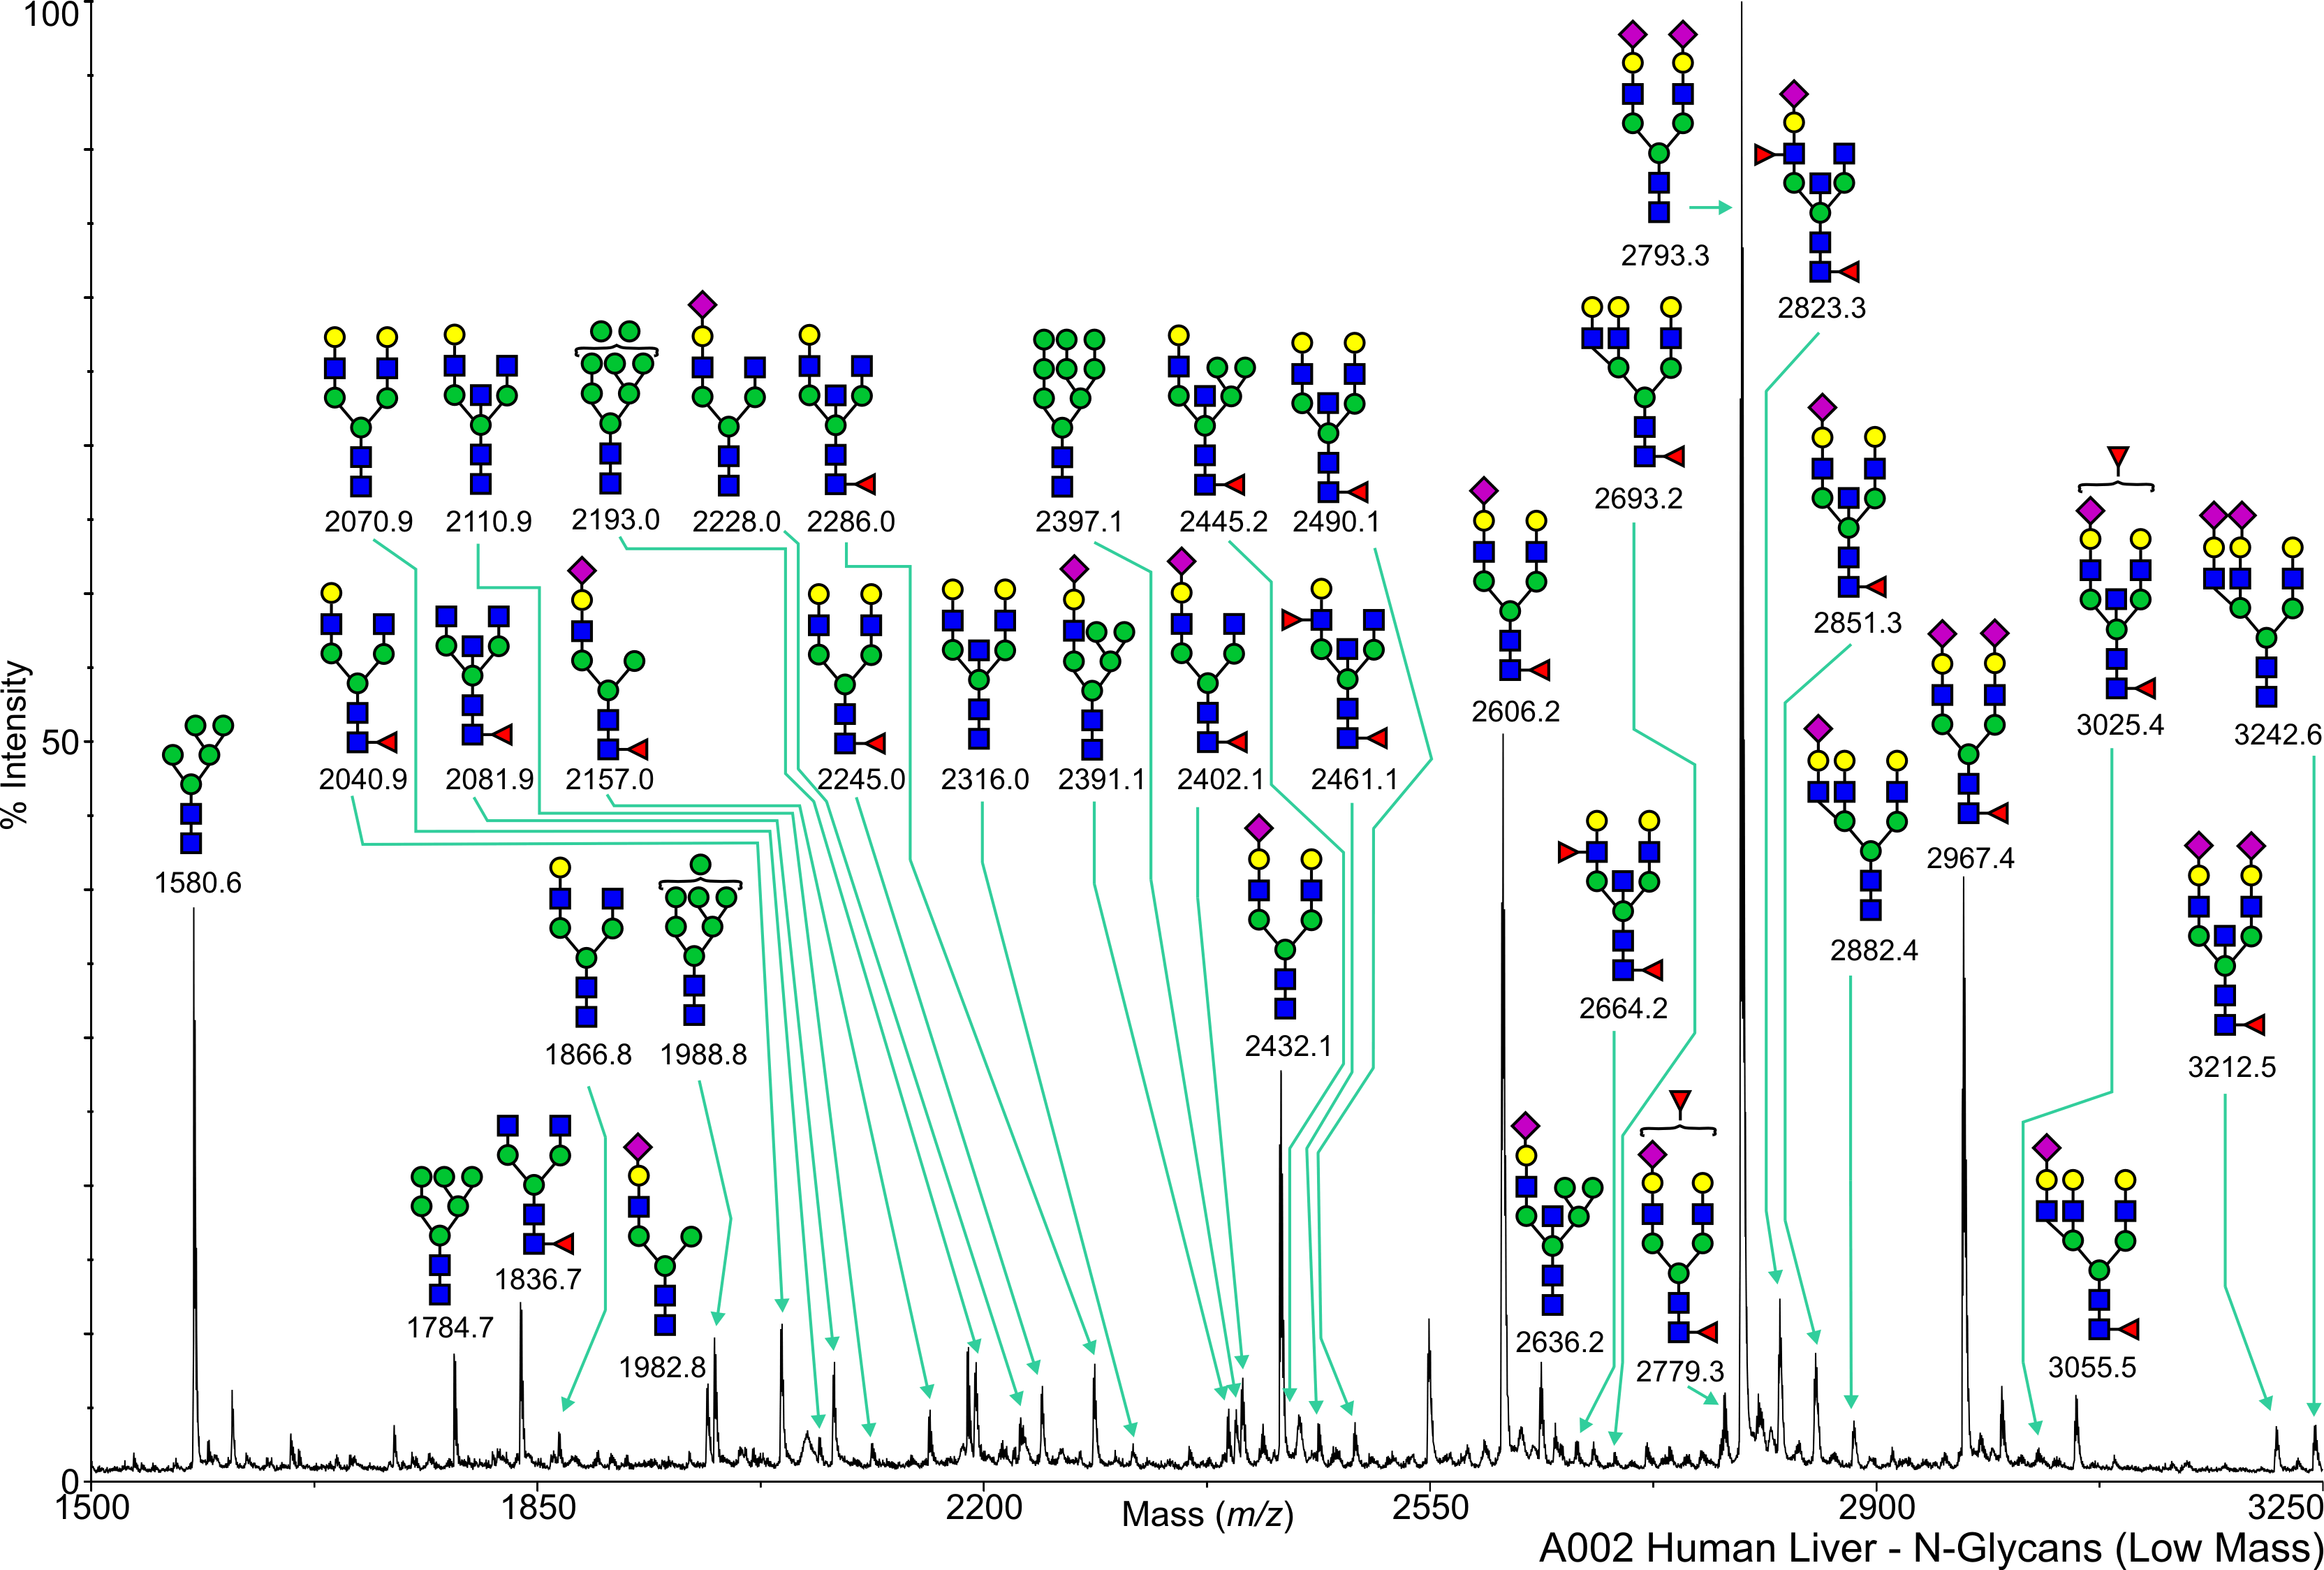
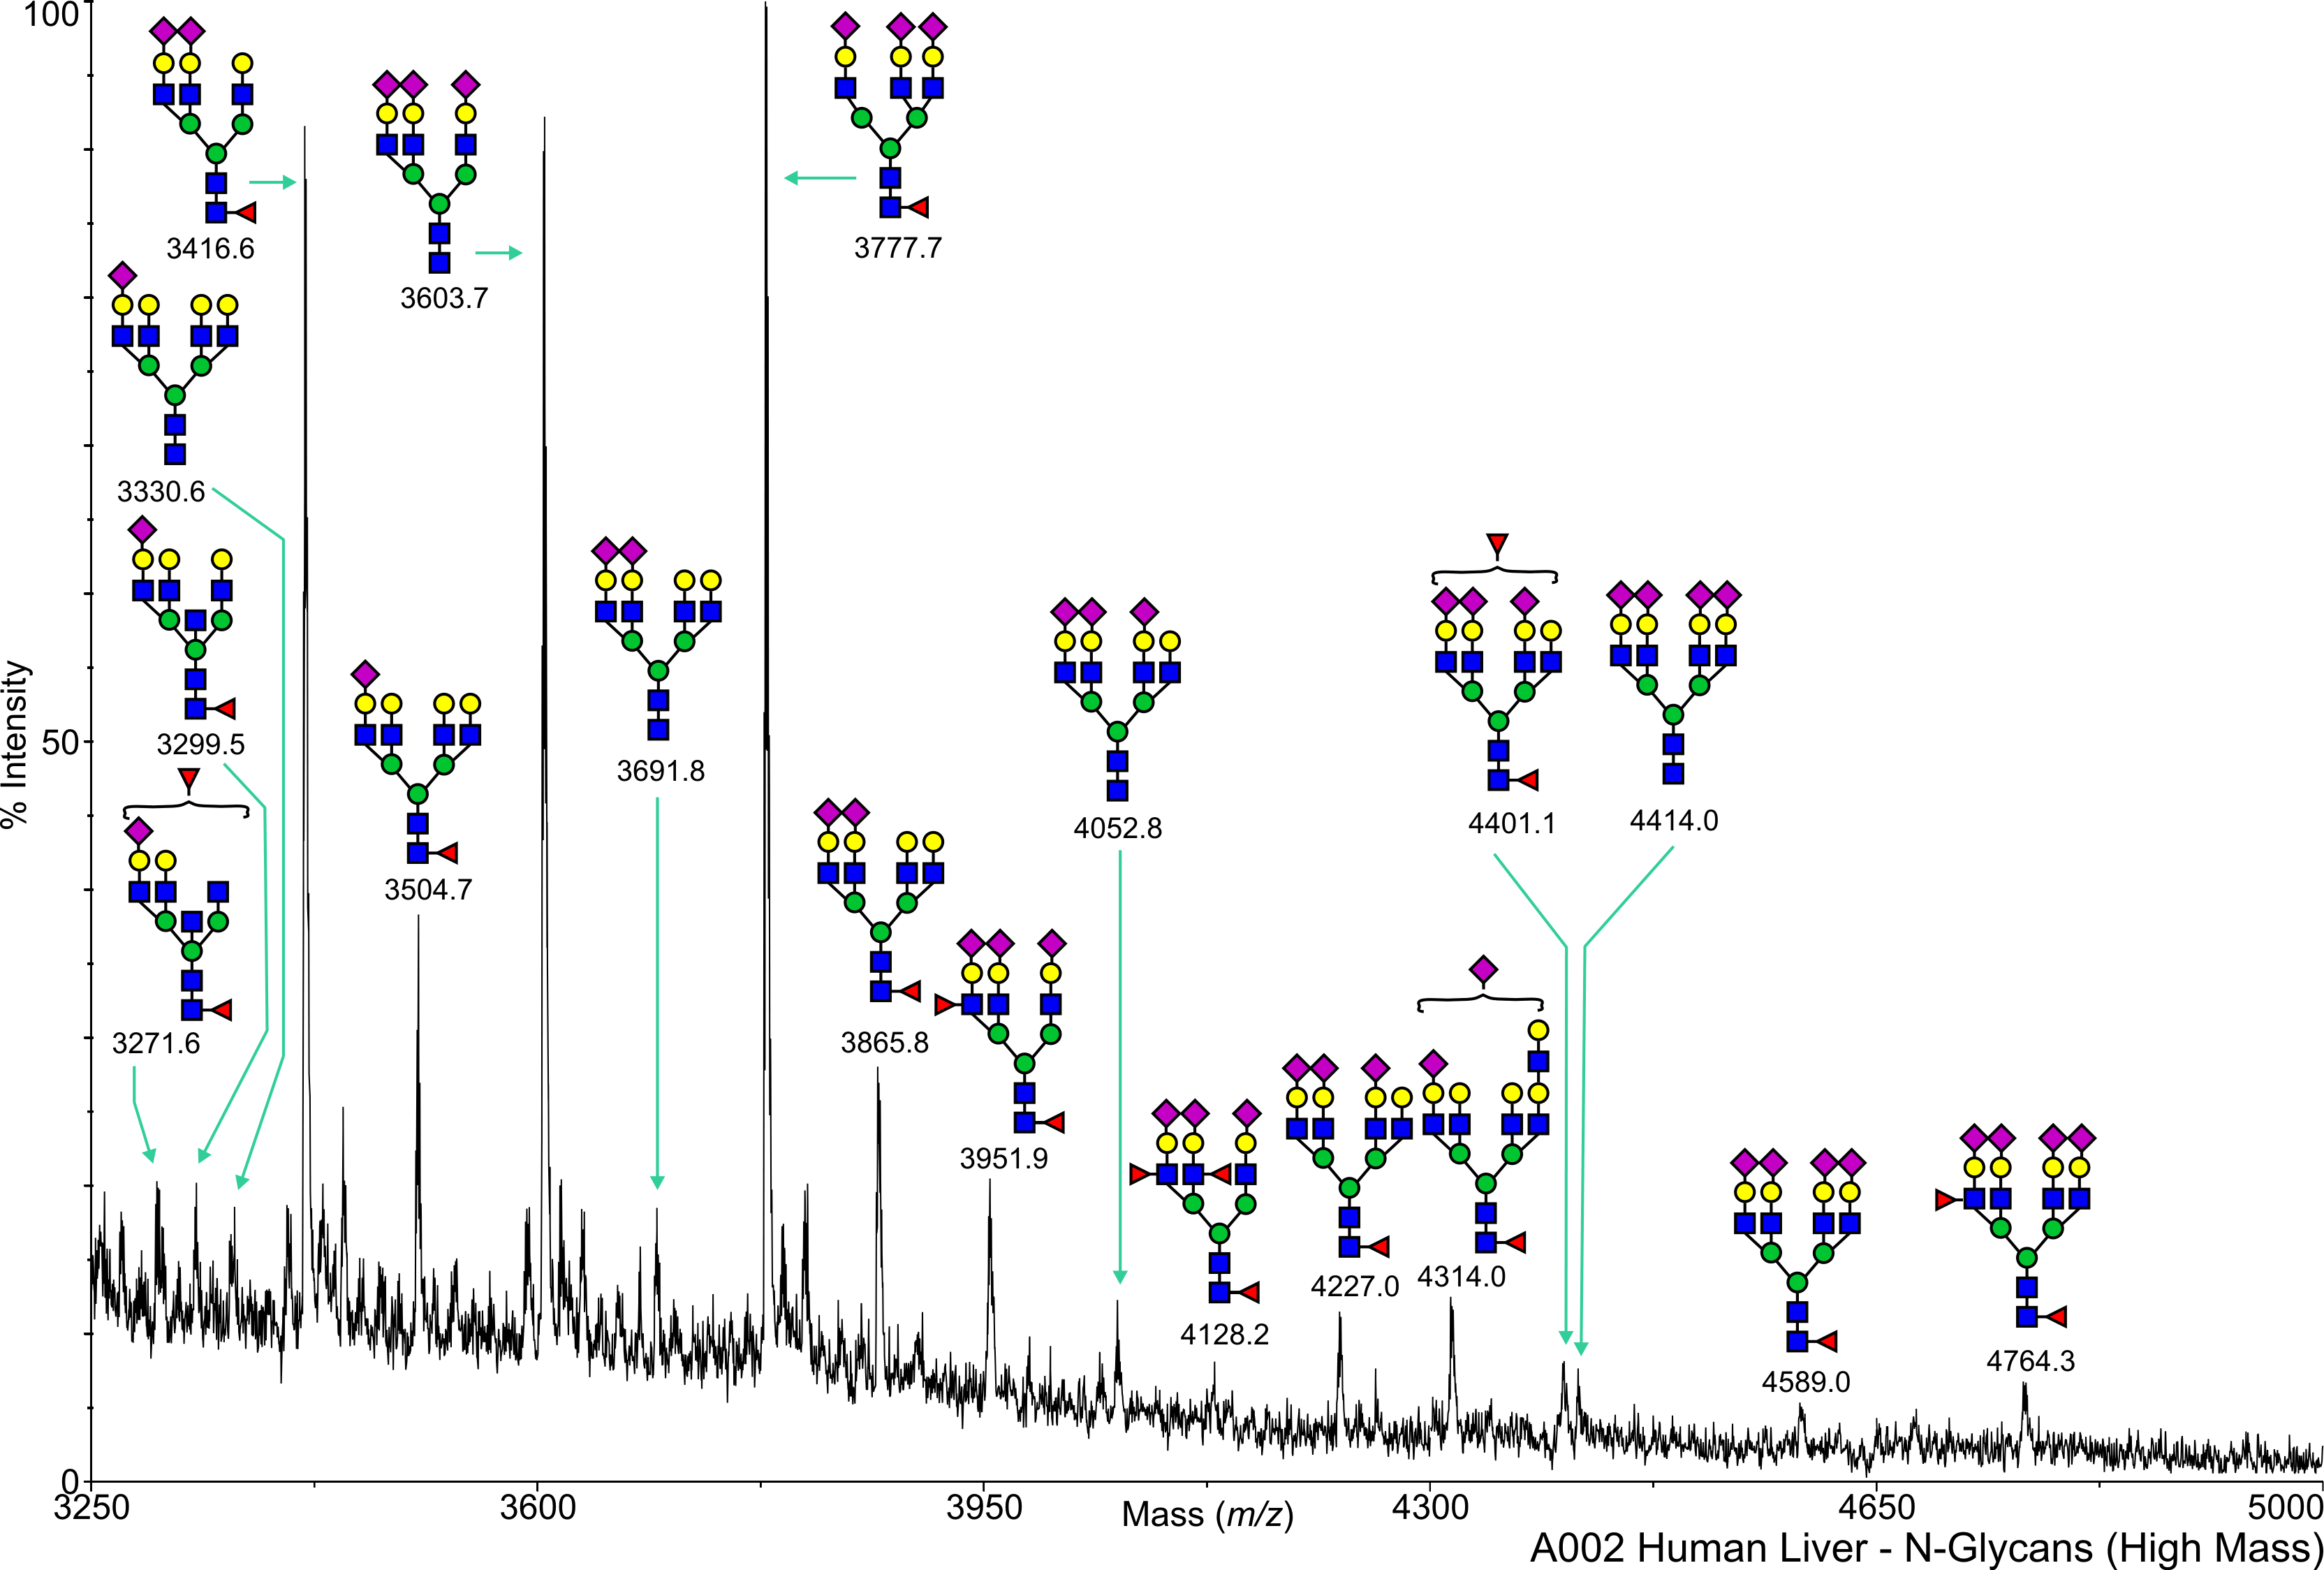
Human Liver N-Linked A002 Salomon,Daniel View experimental details      
Annotated file for lower mass range in JPG formatAnnotated file for higher mass range in JPG format Annotated file for lower mass range in PDF formatAnnotated file for higher mass range in PDF format
         
cfg_rRequest_1691
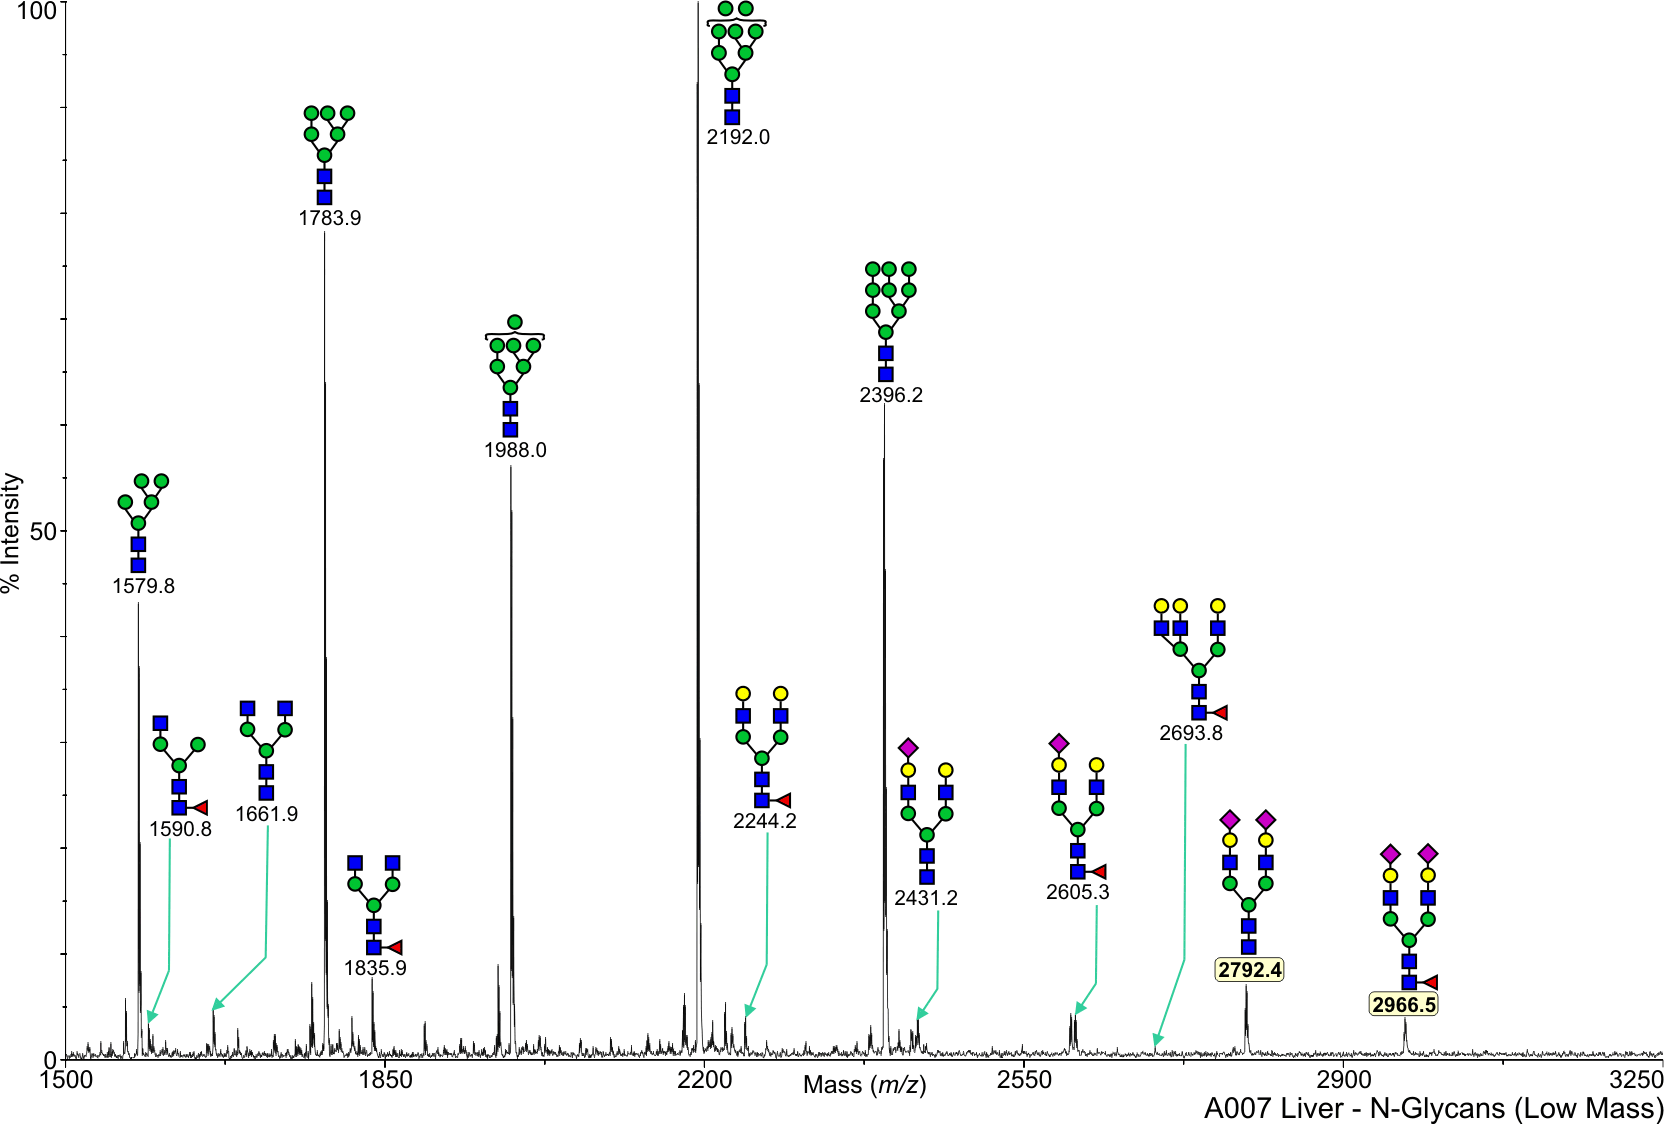
Human Liver N-Linked A007 Salomon,Daniel View experimental details      
Annotated file in JPG format Annotated file in PDF format
View Mass Spectrum data as text View Mass Peak file   Interactive Mass Spectrum Viewer
cfg_rRequest_1691
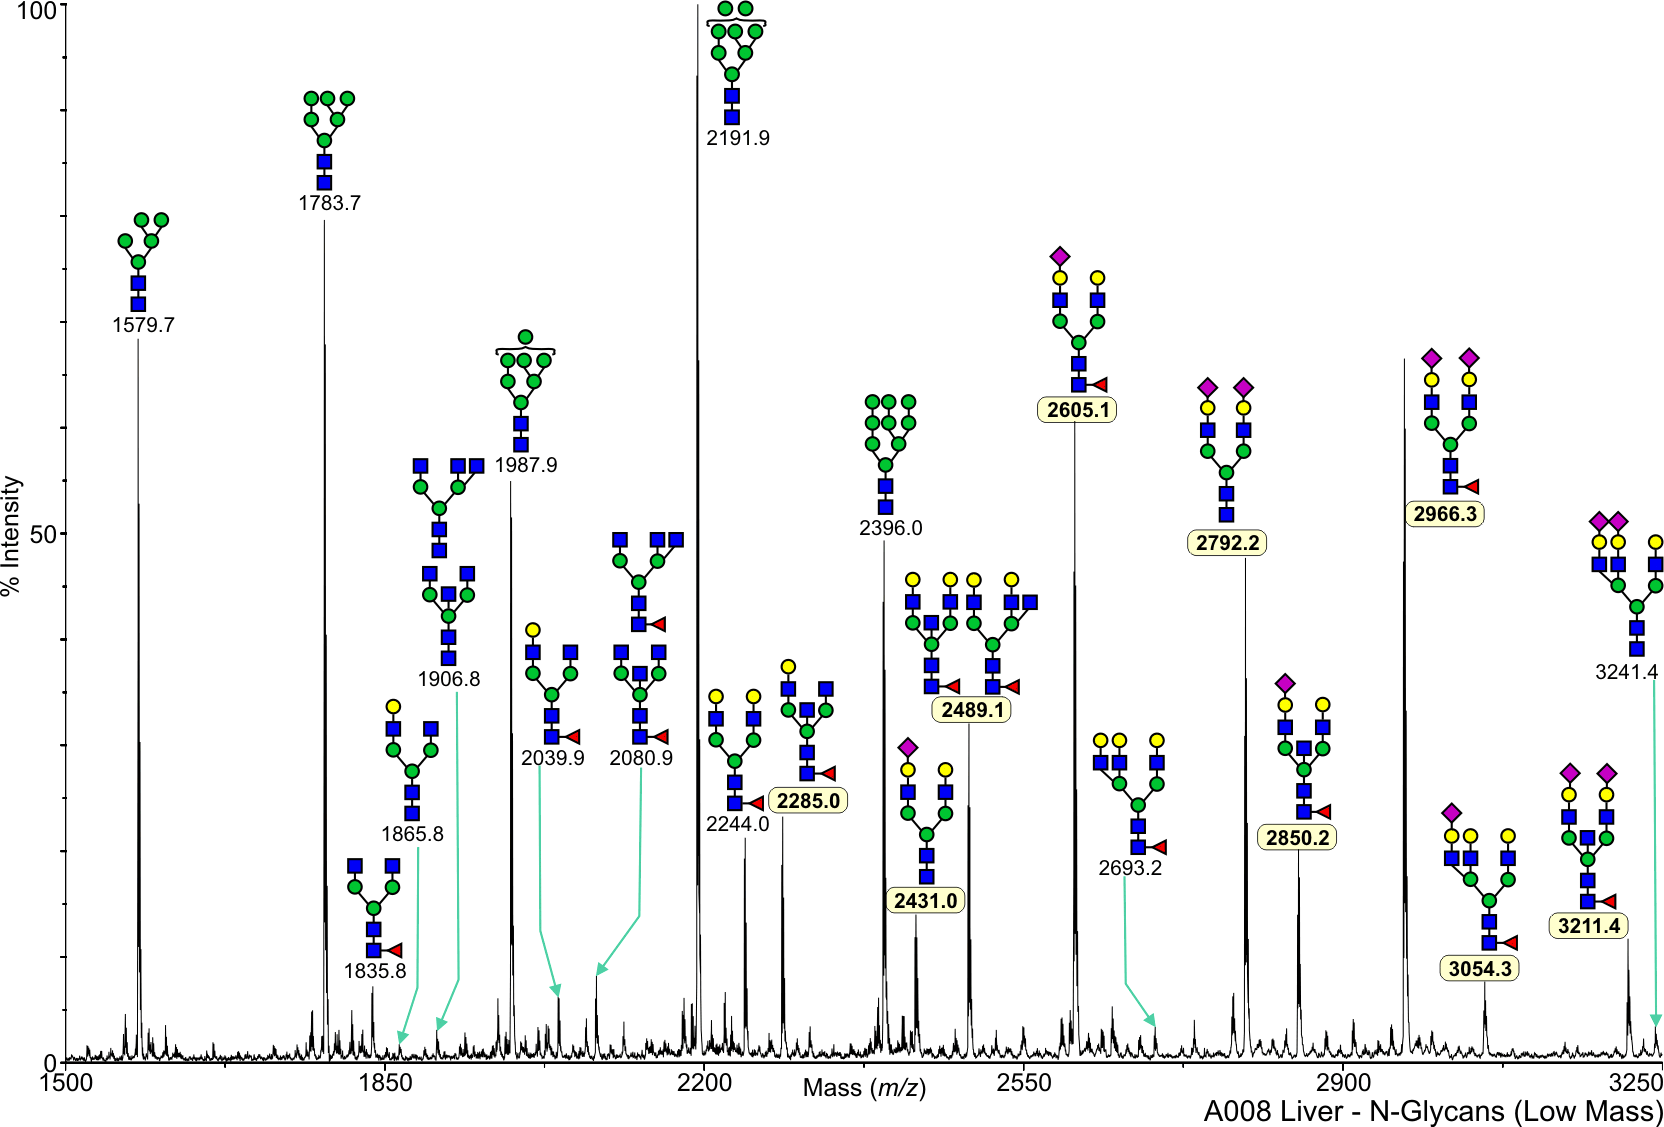
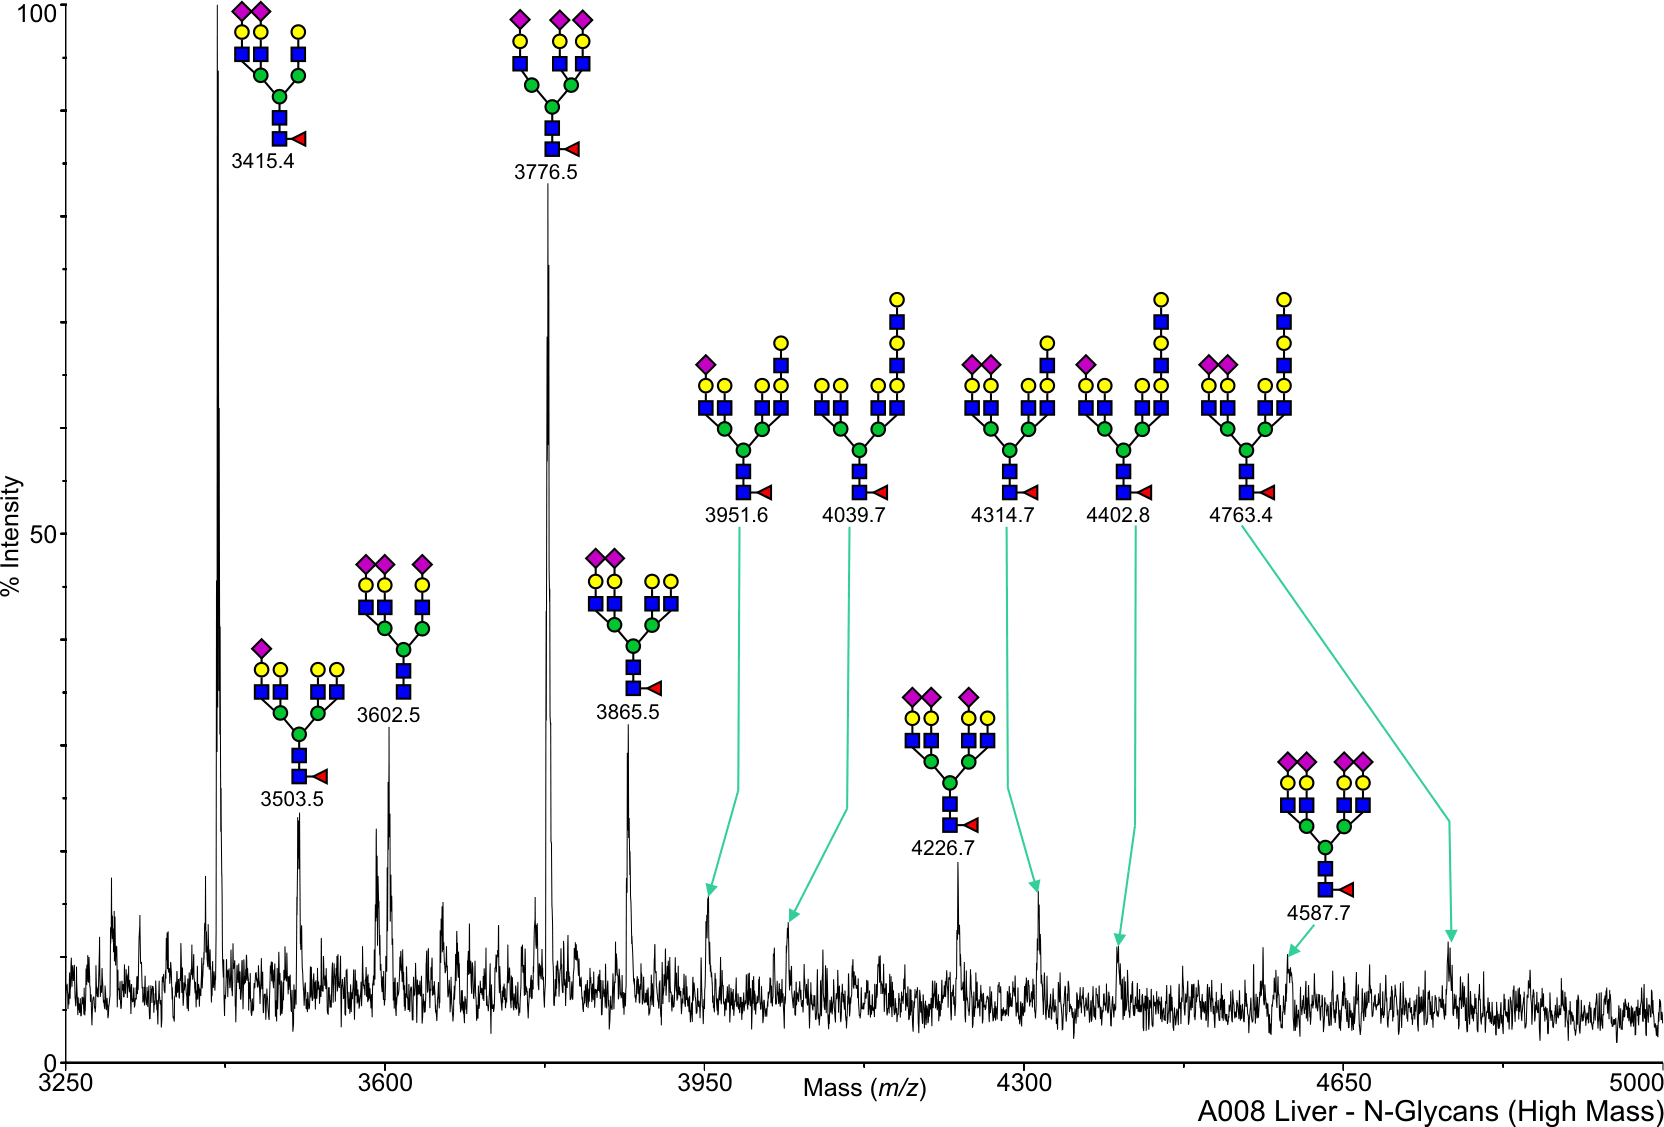
Human Liver N-Linked A008 Salomon,Daniel View experimental details      
Annotated file for lower mass range in JPG formatAnnotated file for higher mass range in JPG format Annotated file for lower mass range in PDF formatAnnotated file for higher mass range in PDF format
View Mass Spectrum data as text View Mass Peak file   Interactive Mass Spectrum Viewer
cfg_rRequest_1691
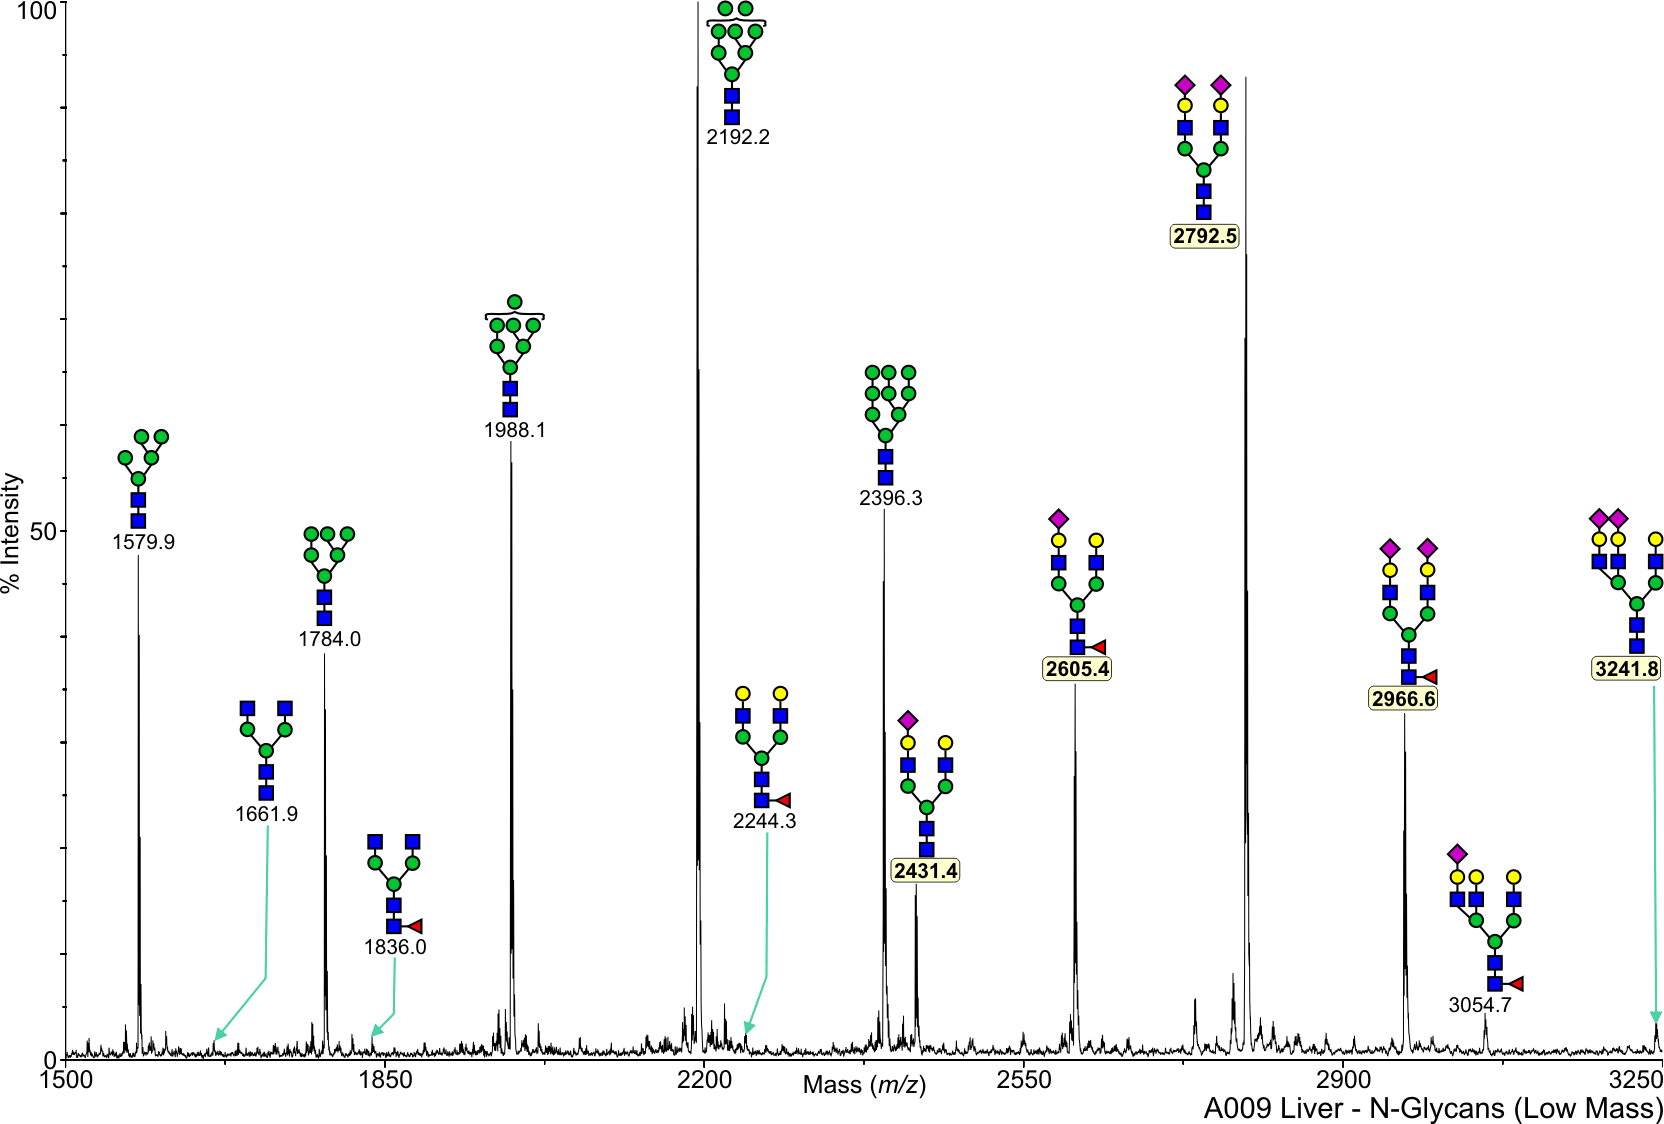
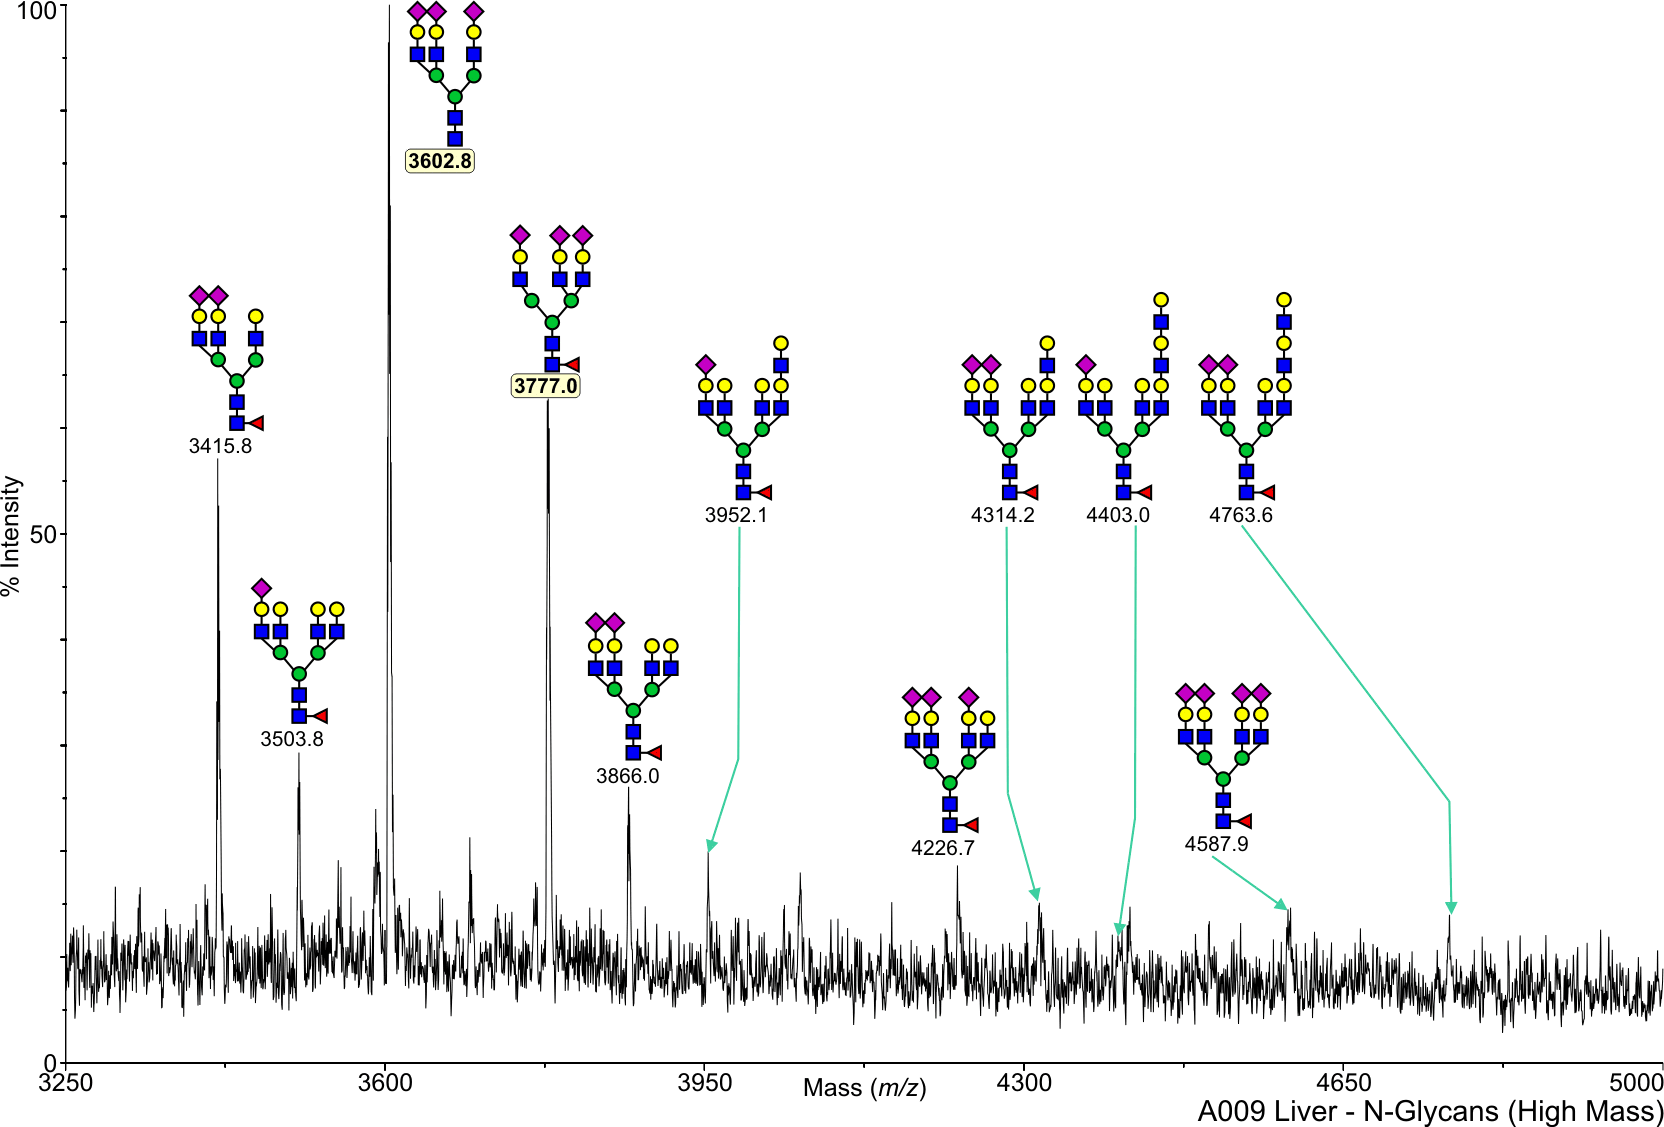
Human Liver N-Linked A009 Salomon,Daniel View experimental details      
Annotated file for lower mass range in JPG formatAnnotated file for higher mass range in JPG format Annotated file for lower mass range in PDF formatAnnotated file for higher mass range in PDF format
View Mass Spectrum data as text View Mass Peak file   Interactive Mass Spectrum Viewer
cfg_rRequest_1691
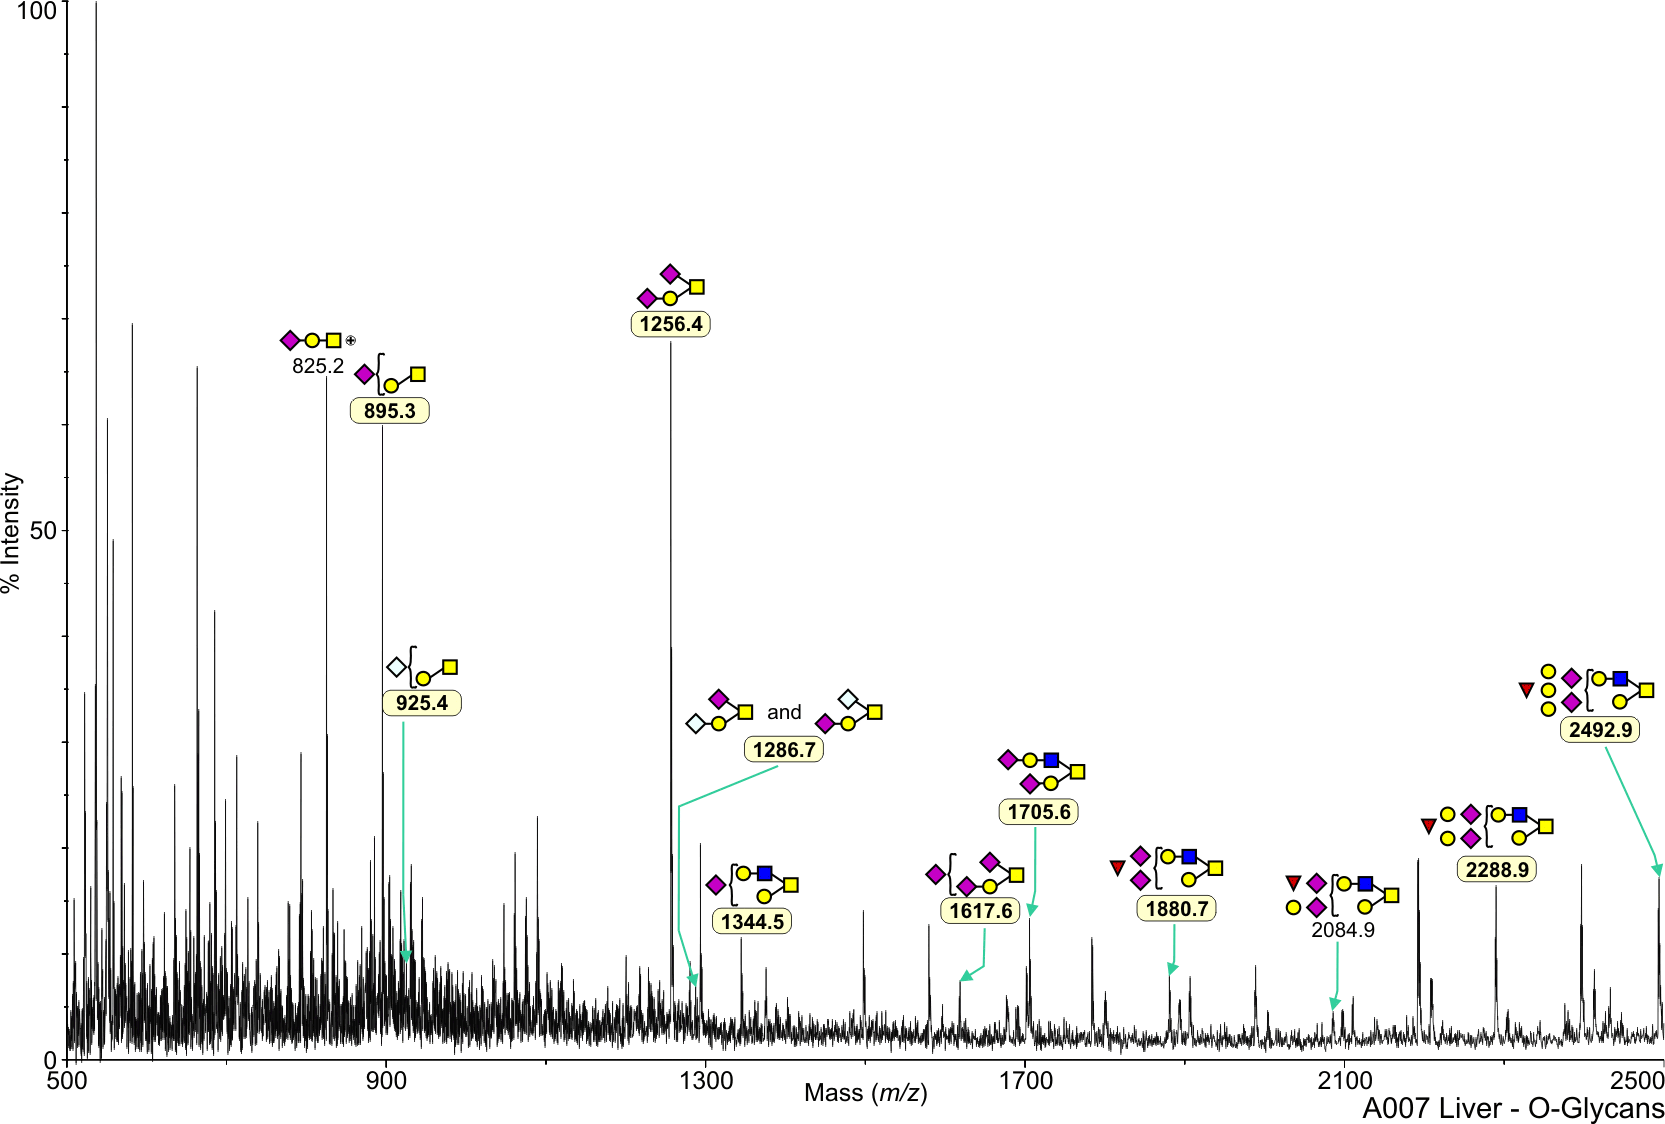
Human Liver O-Linked A007 Salomon,Daniel View experimental details      
Annotated file in JPG format Annotated file in PDF format
View Mass Spectrum data as text View Mass Peak file   Interactive Mass Spectrum Viewer
cfg_rRequest_1691
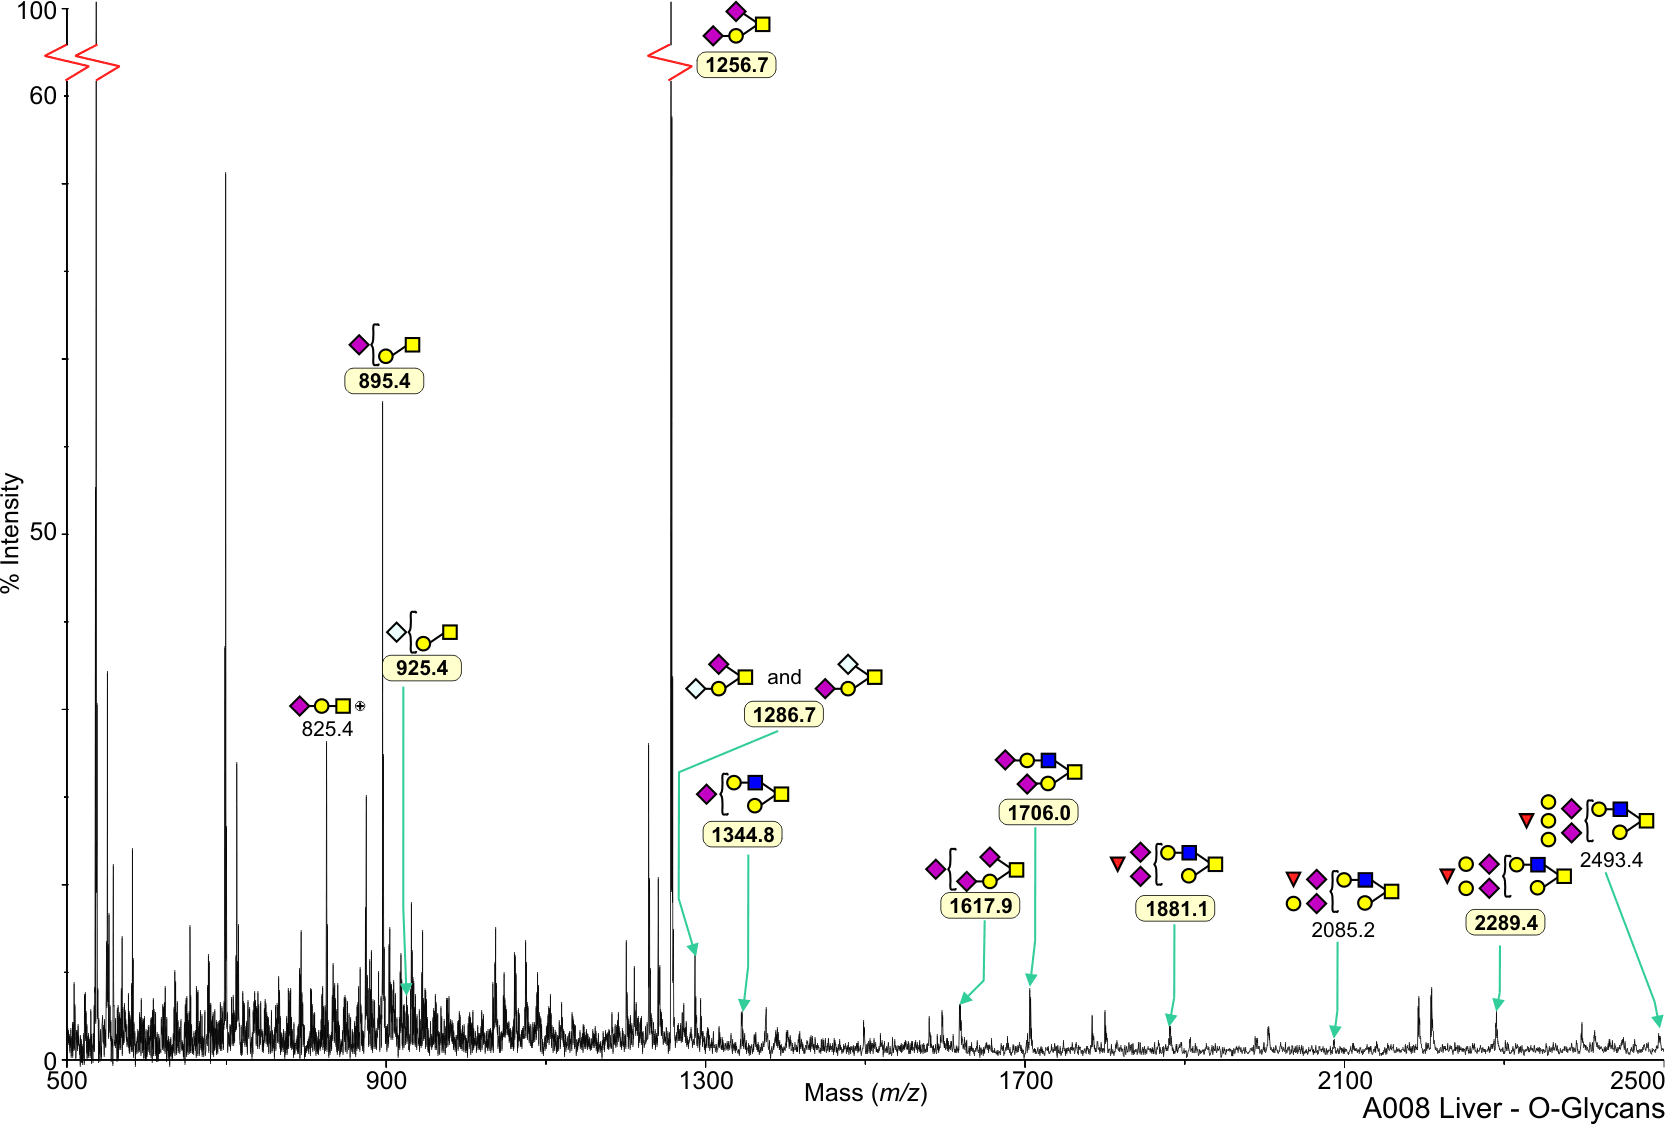
Human Liver O-Linked A008 Salomon,Daniel View experimental details      
Annotated file in JPG format Annotated file in PDF format
View Mass Spectrum data as text View Mass Peak file   Interactive Mass Spectrum Viewer
cfg_rRequest_1691
Human Liver O-Linked A009 Salomon,Daniel View experimental details      
Annotated file in JPG format Annotated file in PDF format
View Mass Spectrum data as text View Mass Peak file   Interactive Mass Spectrum Viewer
cfg_rRequest_1691
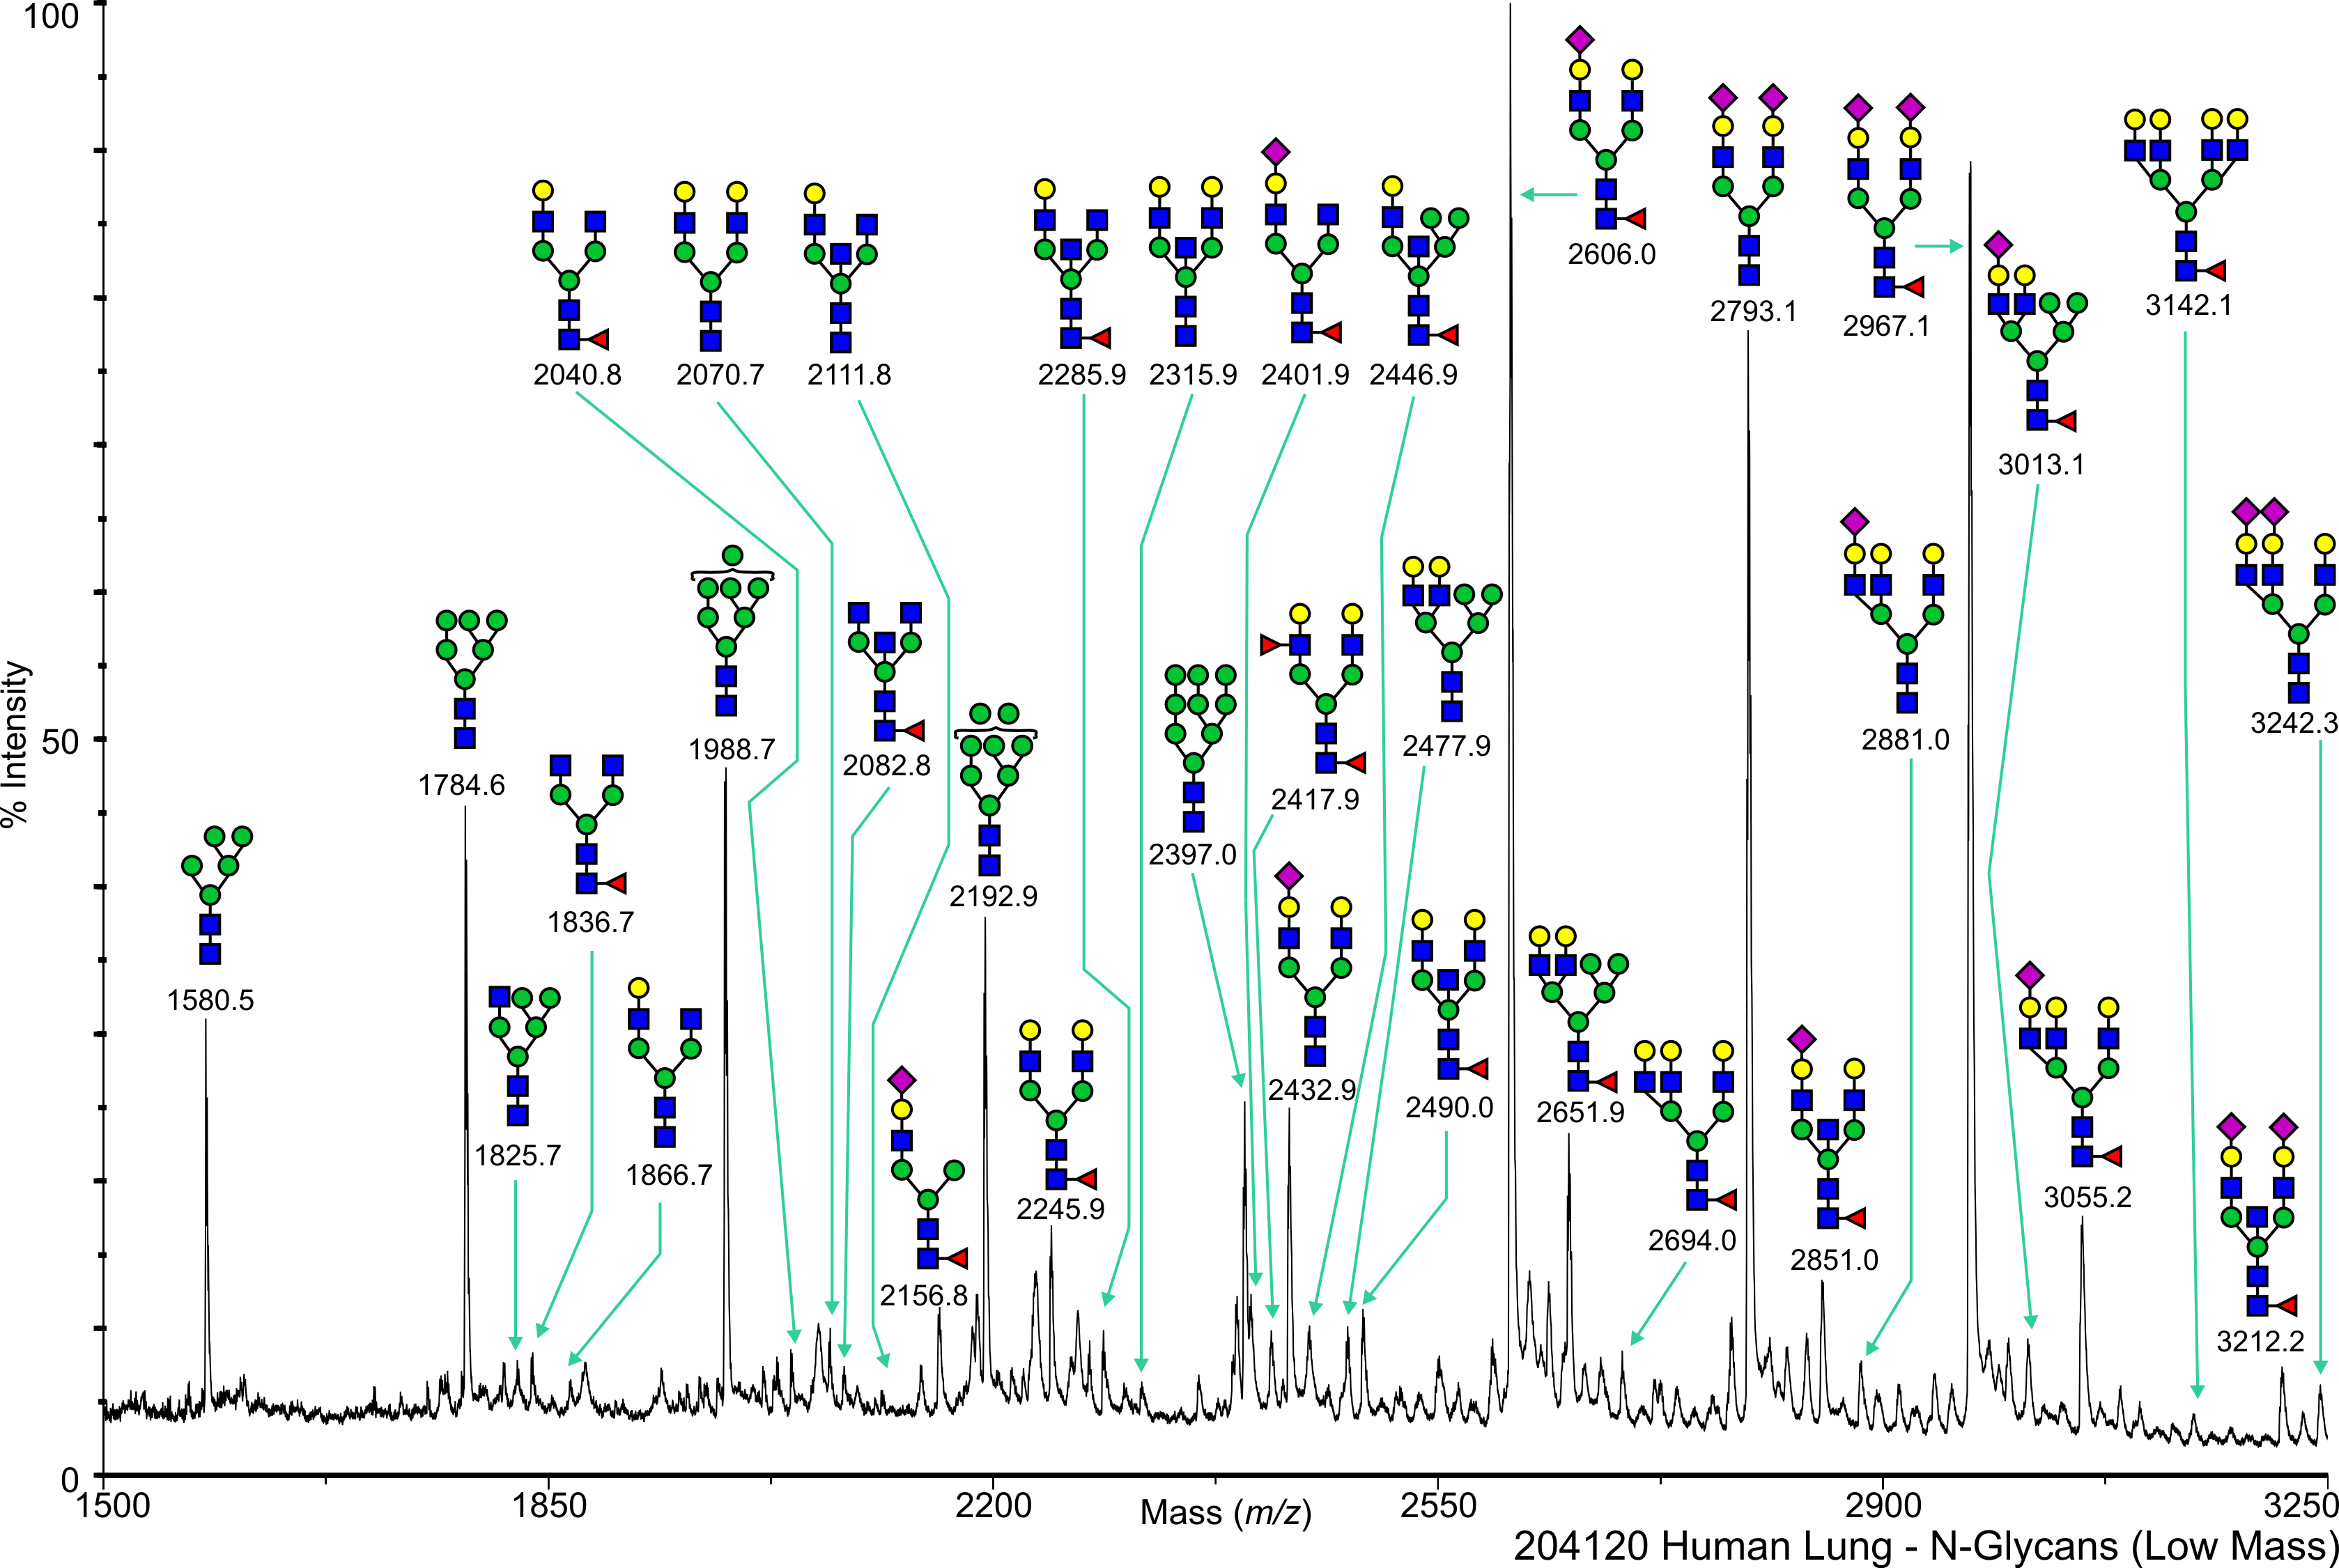
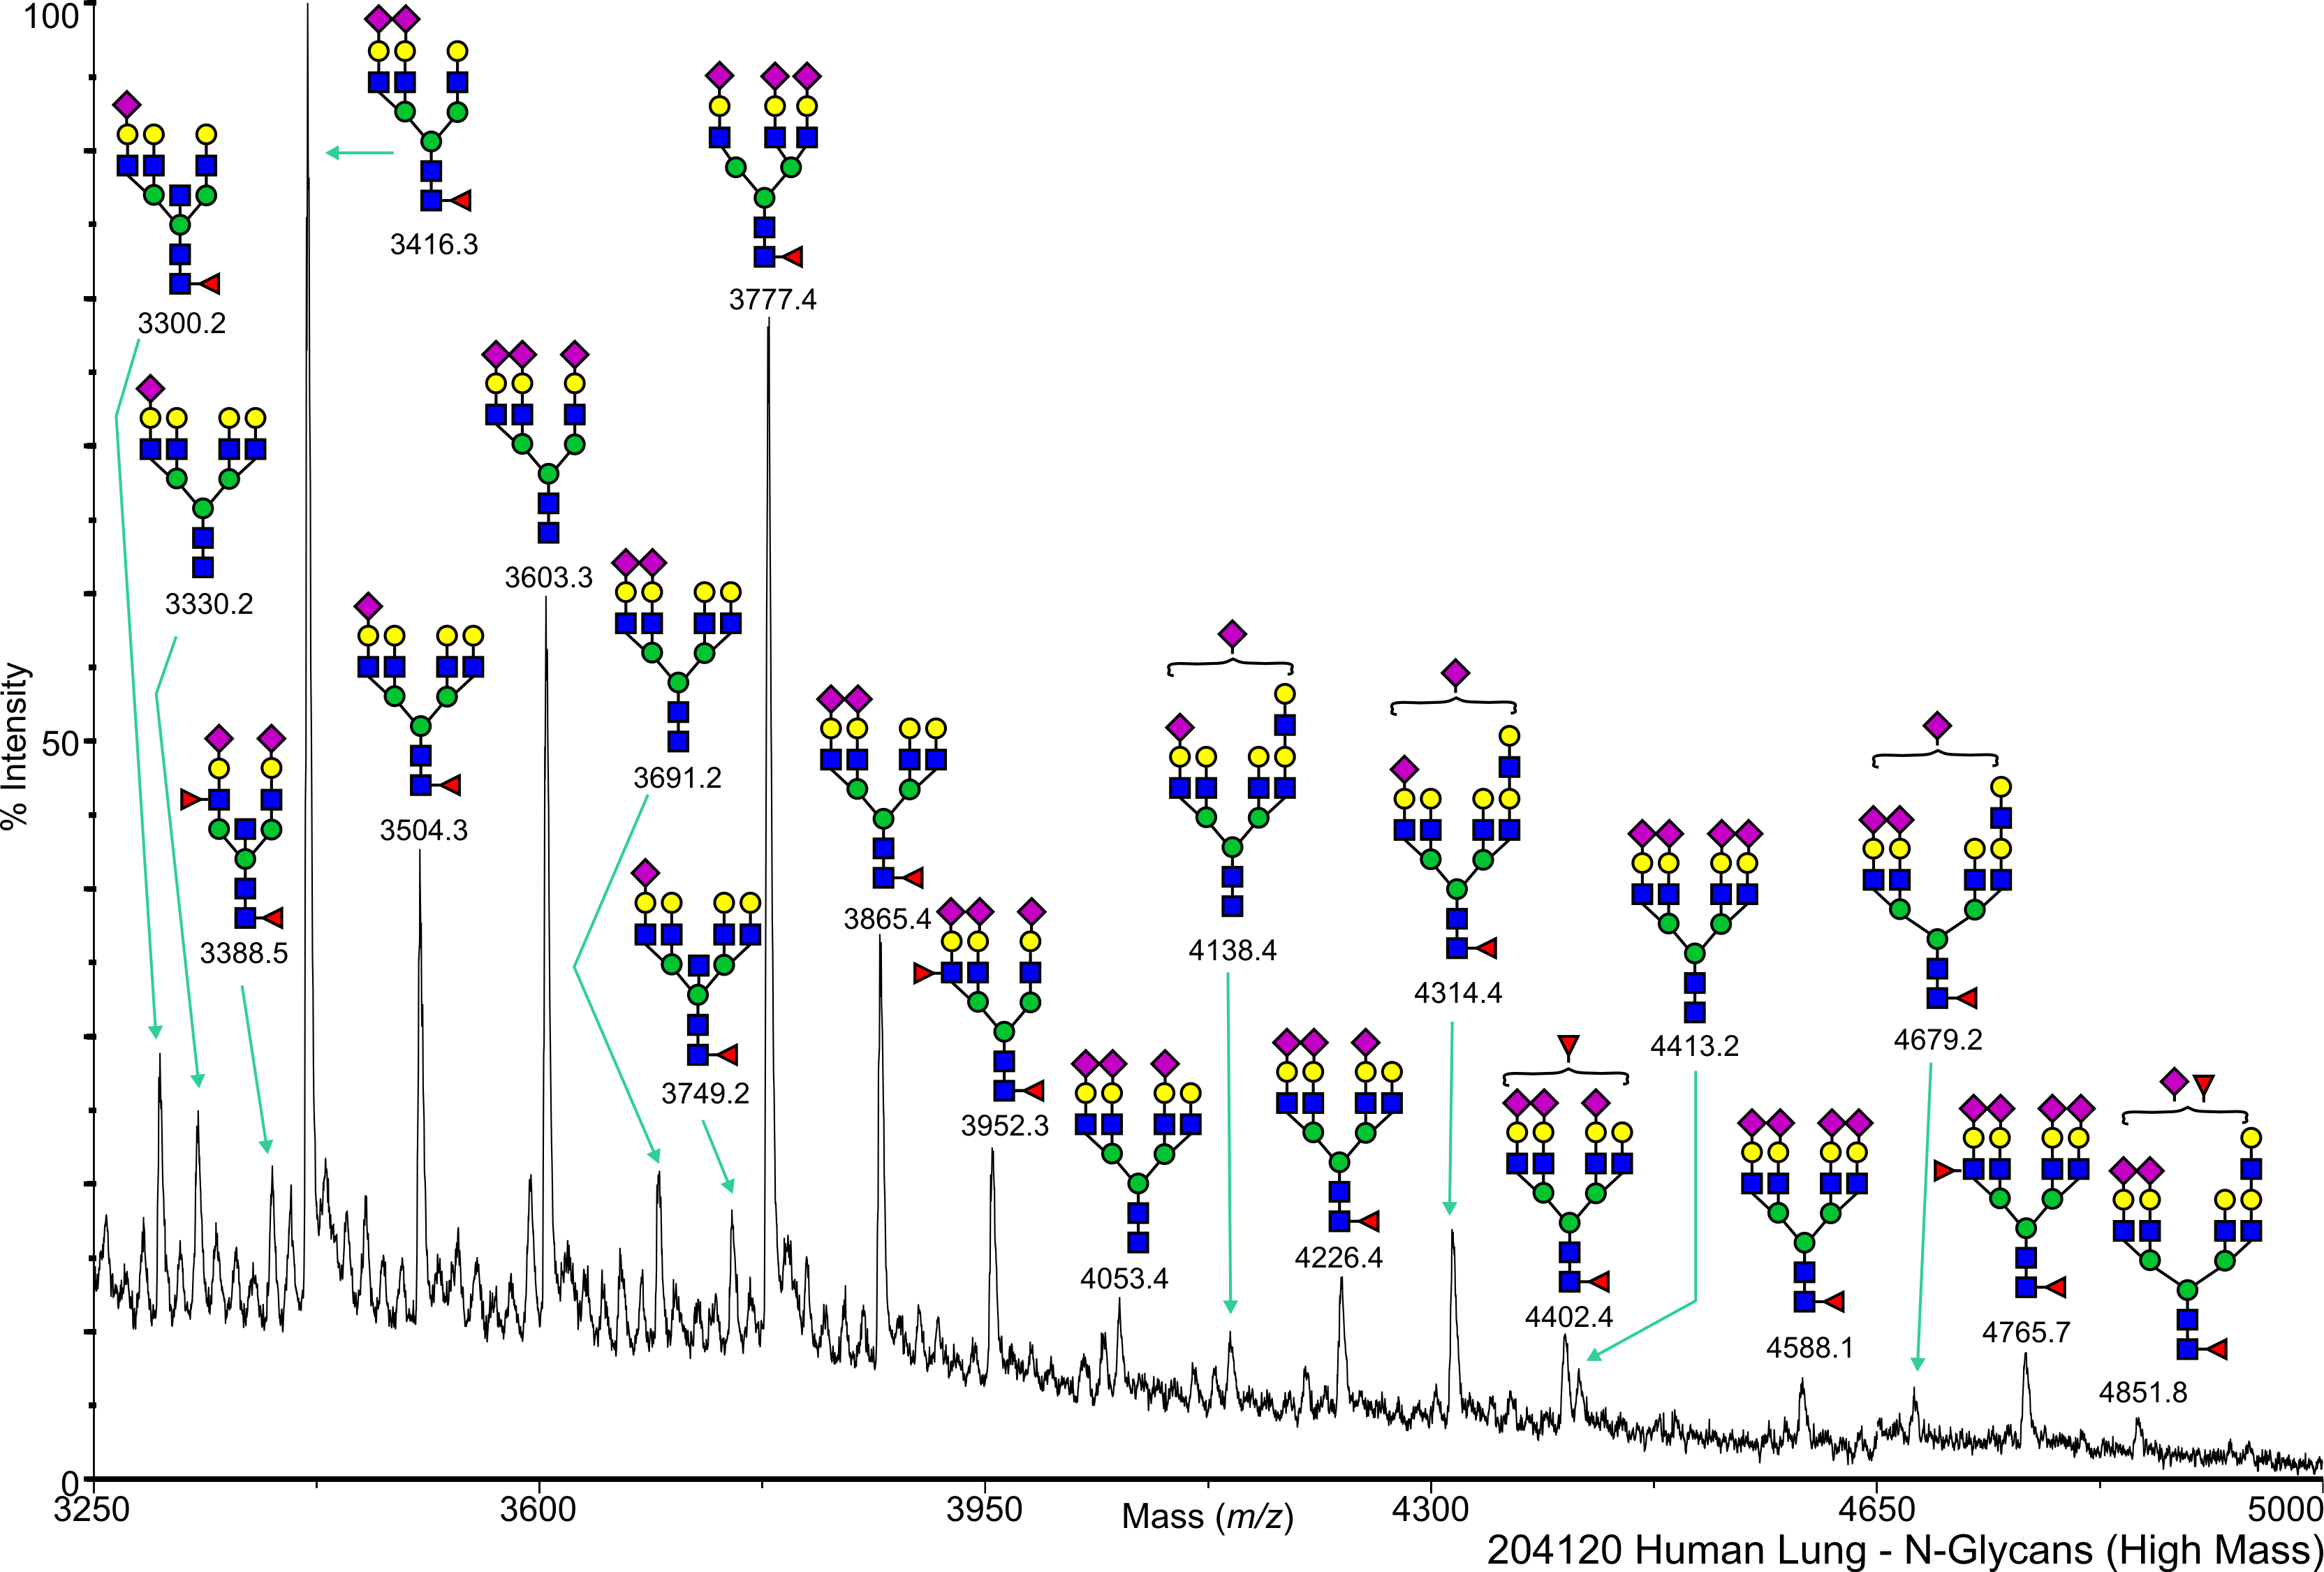
Human Lung N-Linked 204120 Salomon,Daniel View experimental details      
Annotated file for lower mass range in JPG formatAnnotated file for higher mass range in JPG format Annotated file for lower mass range in PDF formatAnnotated file for higher mass range in PDF format
       
cfg_rRequest_1691
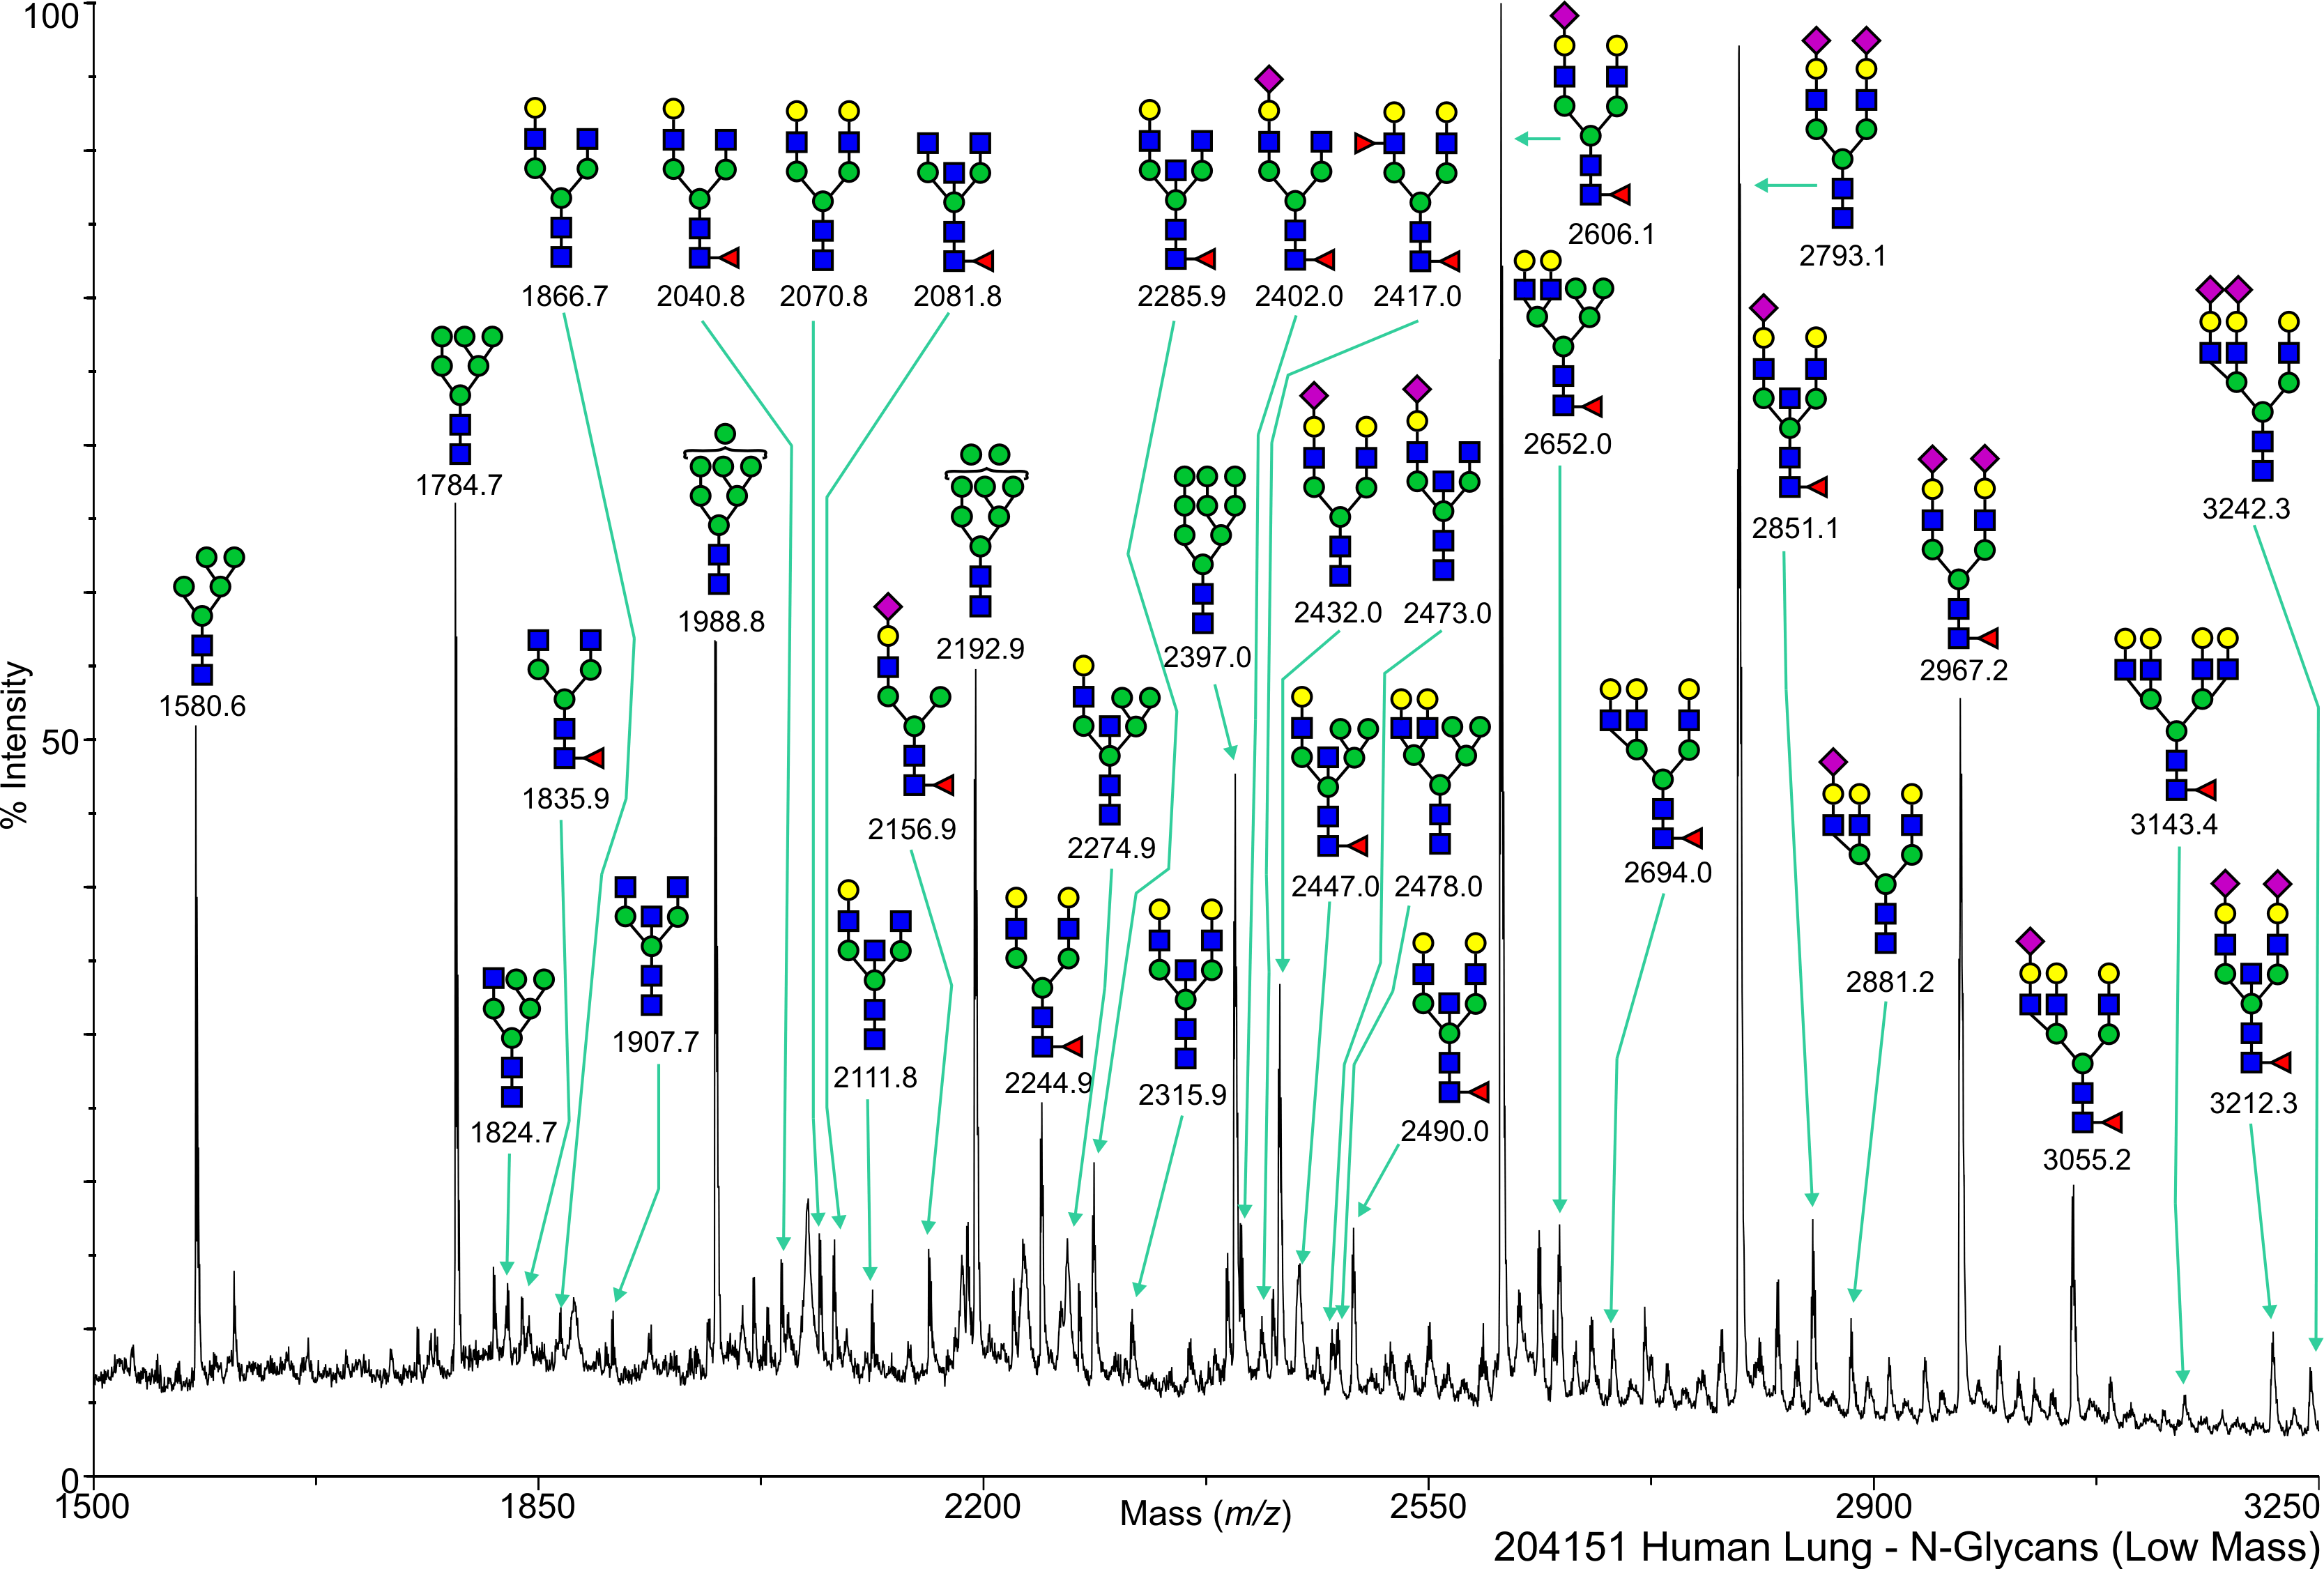
Human Lung N-Linked 204151 Salomon,Daniel View experimental details      
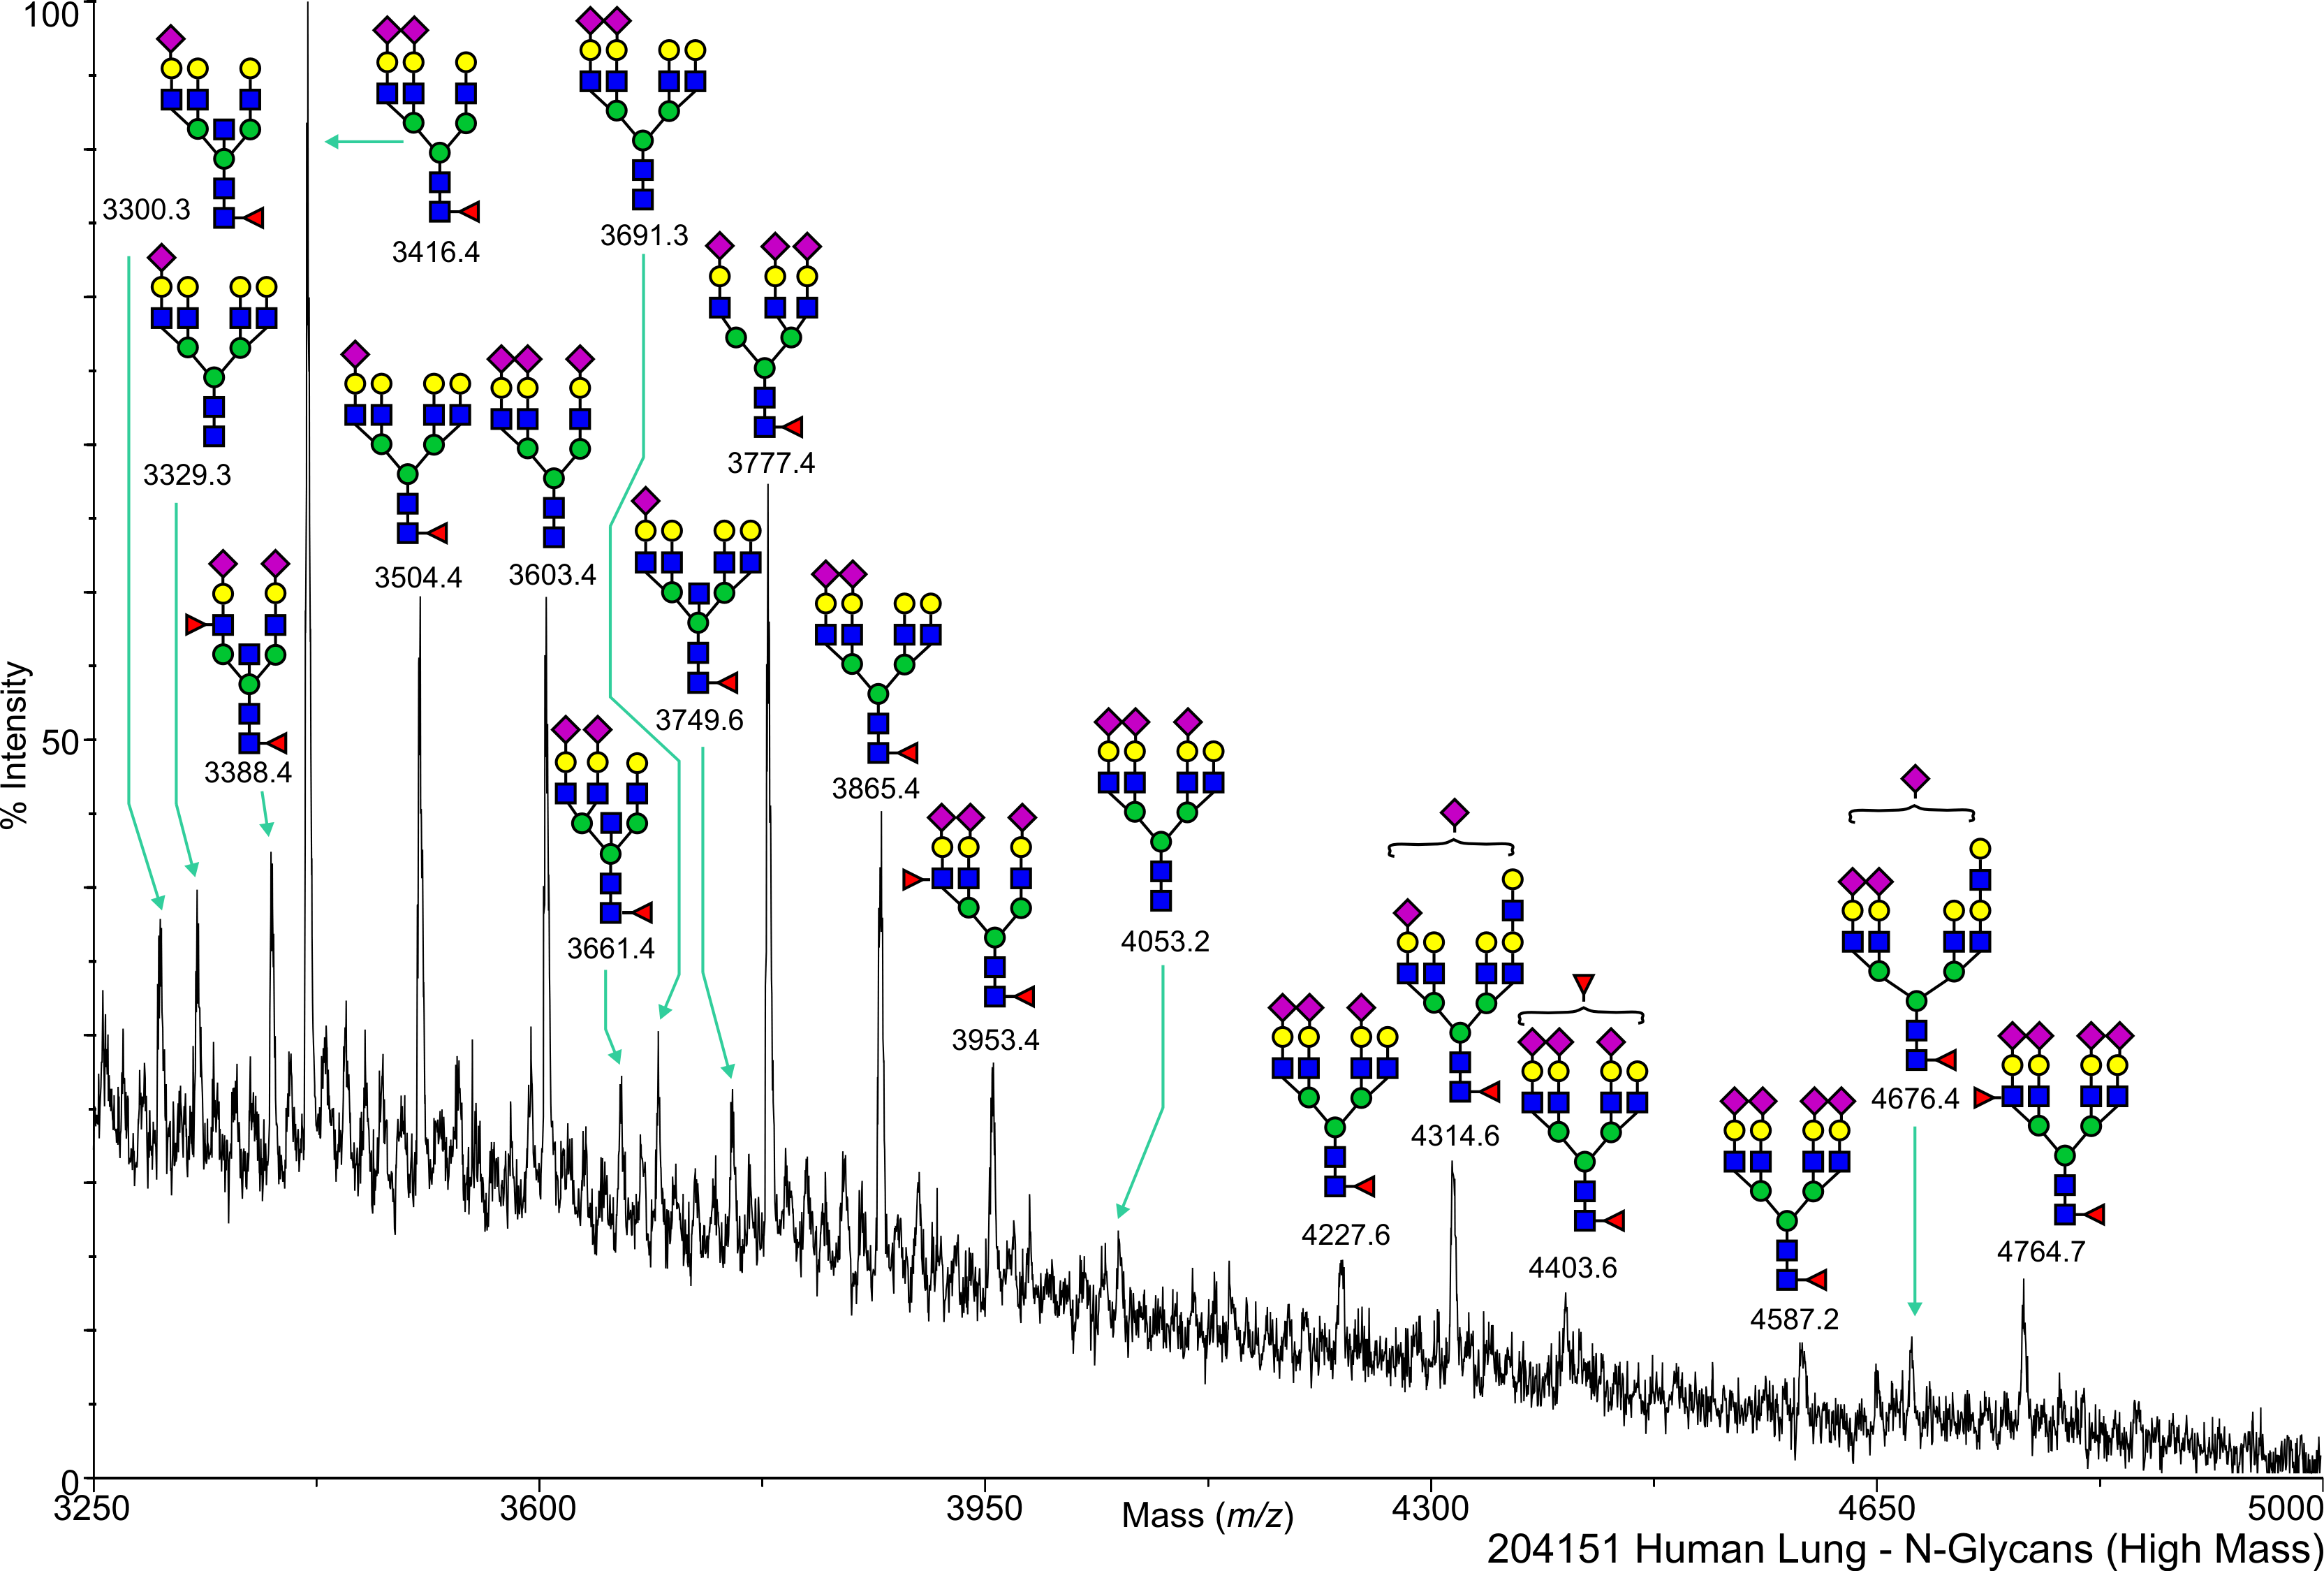
Annotated file for lower mass range in JPG formatAnnotated file for higher mass range in JPG format Annotated file for lower mass range in PDF formatAnnotated file for higher mass range in PDF format
       
cfg_rRequest_1691
Human Lung N-Linked A002 Salomon,Daniel View experimental details      
   
       
cfg_rRequest_1691
Human Lung N-Linked A004 Salomon,Daniel View experimental details      
   
       
cfg_rRequest_1691
Human Lung N-Linked A006 Salomon,Daniel View experimental details      
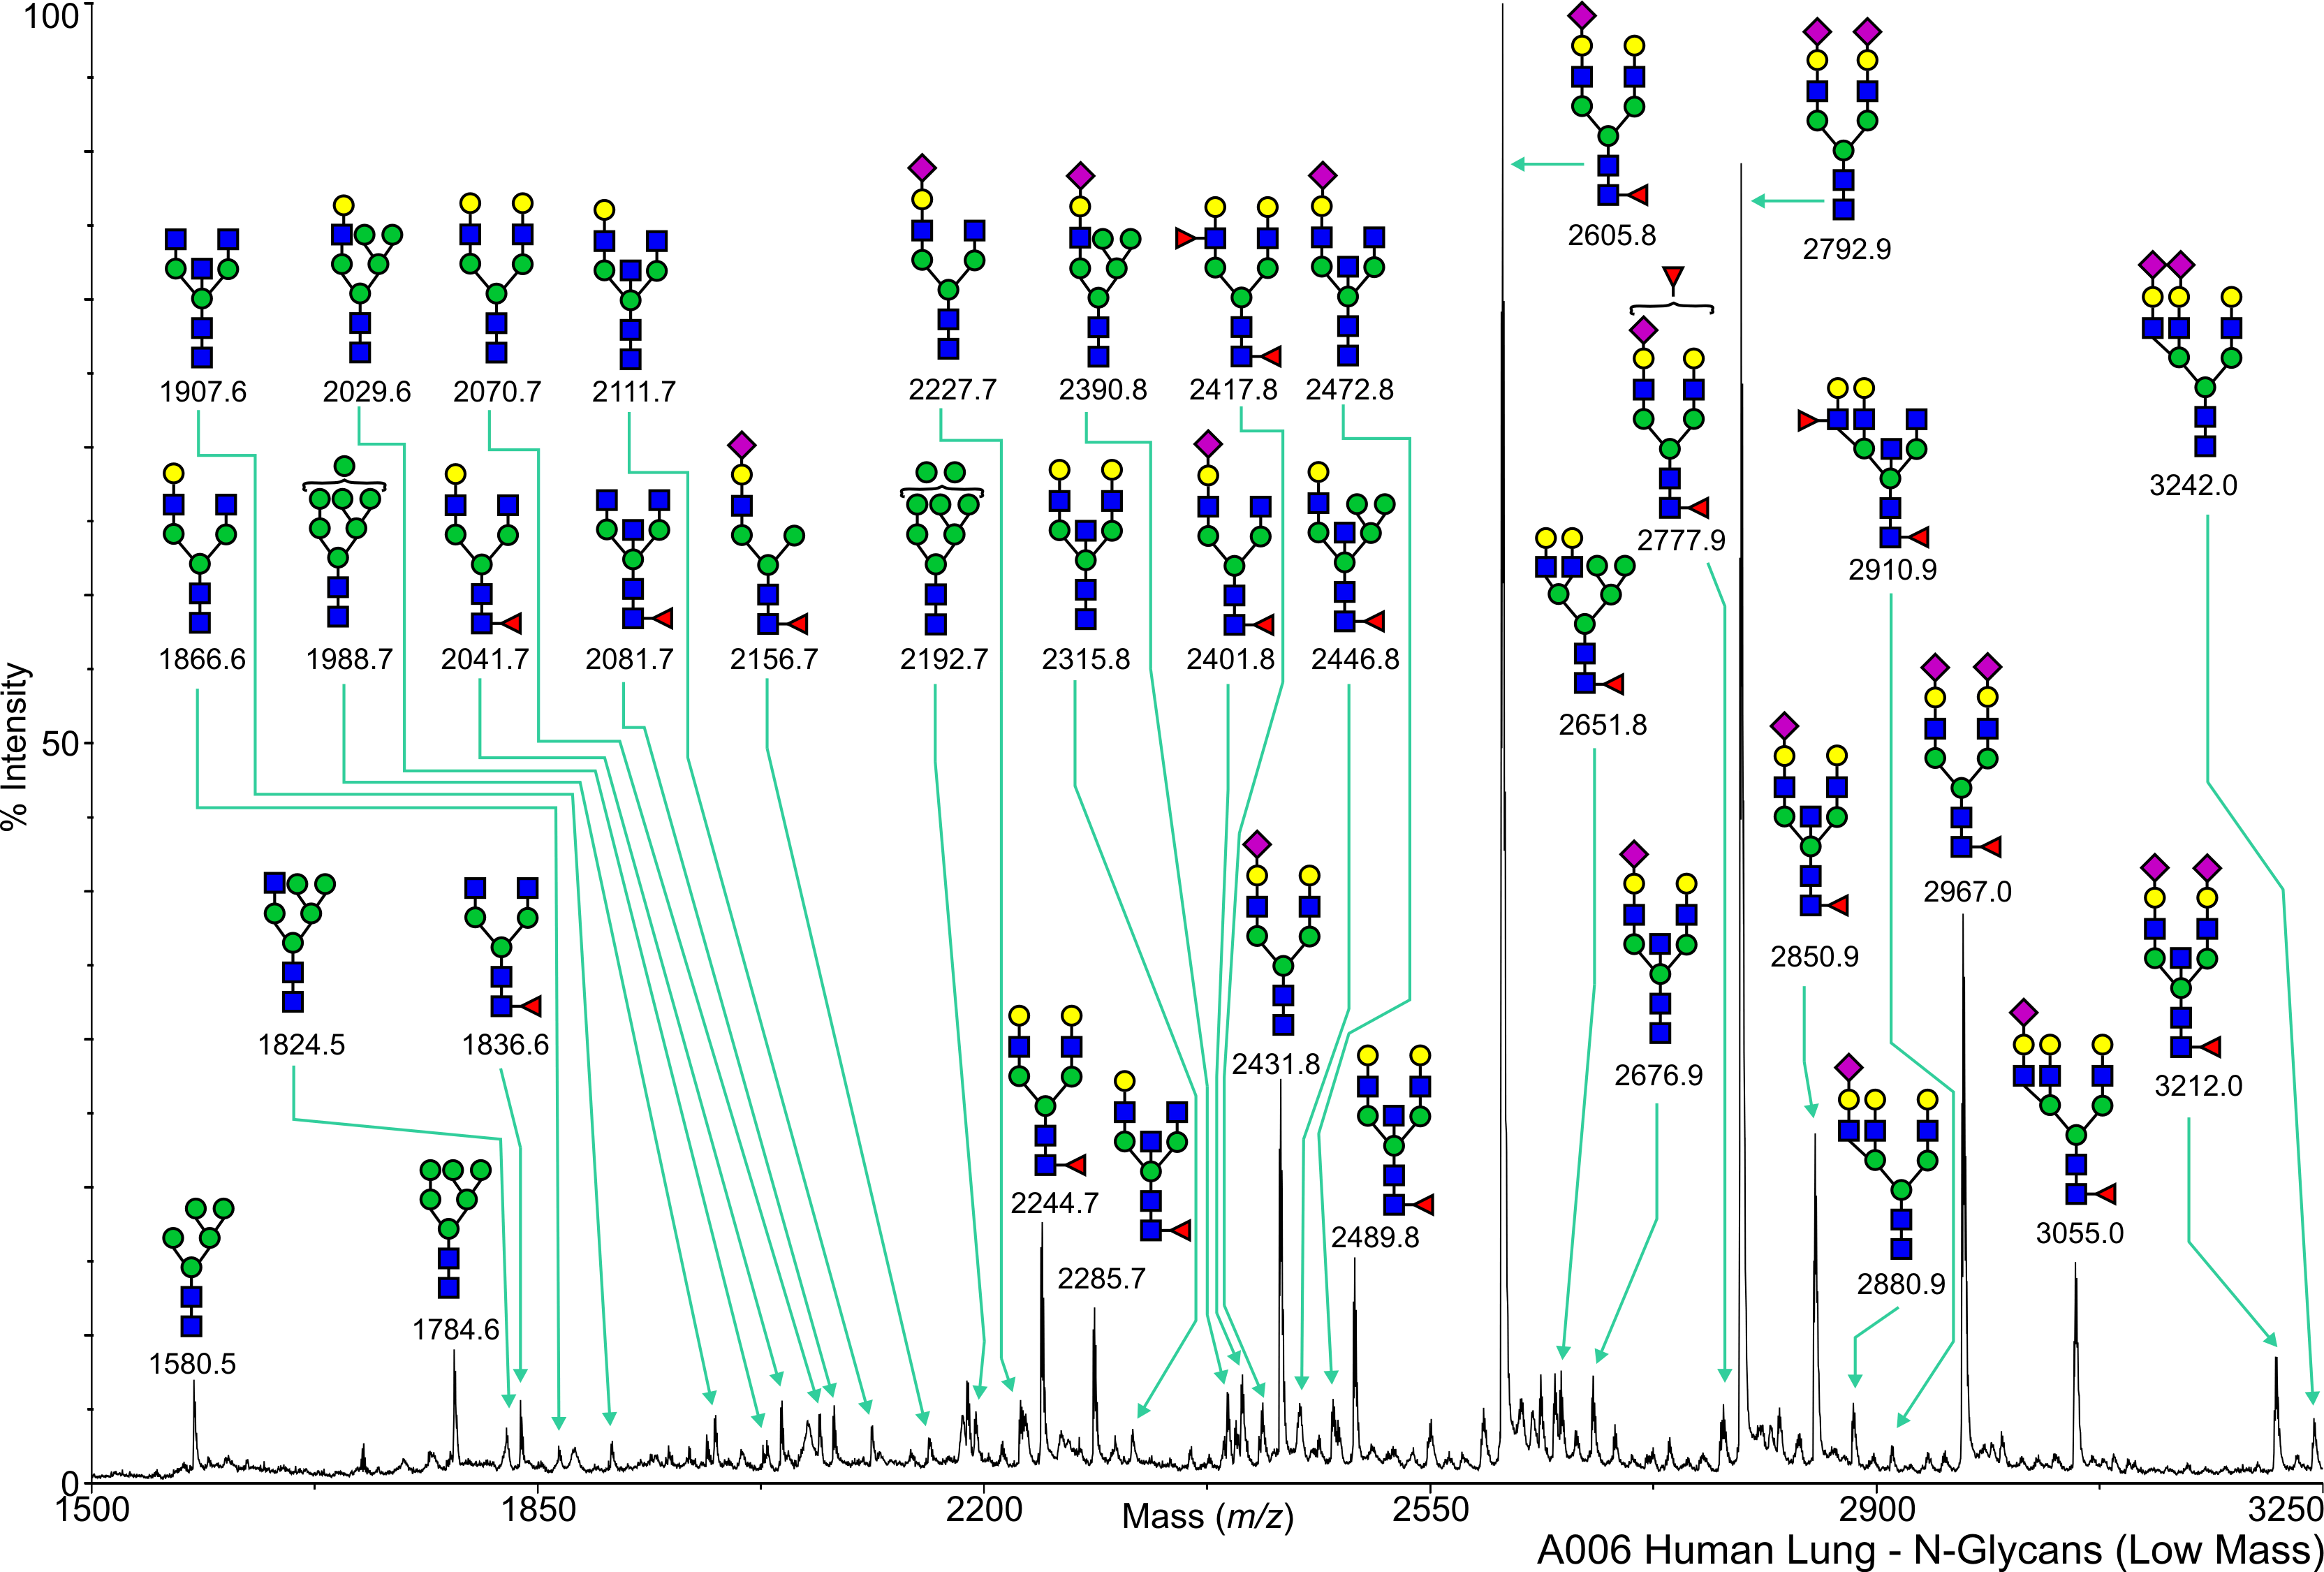
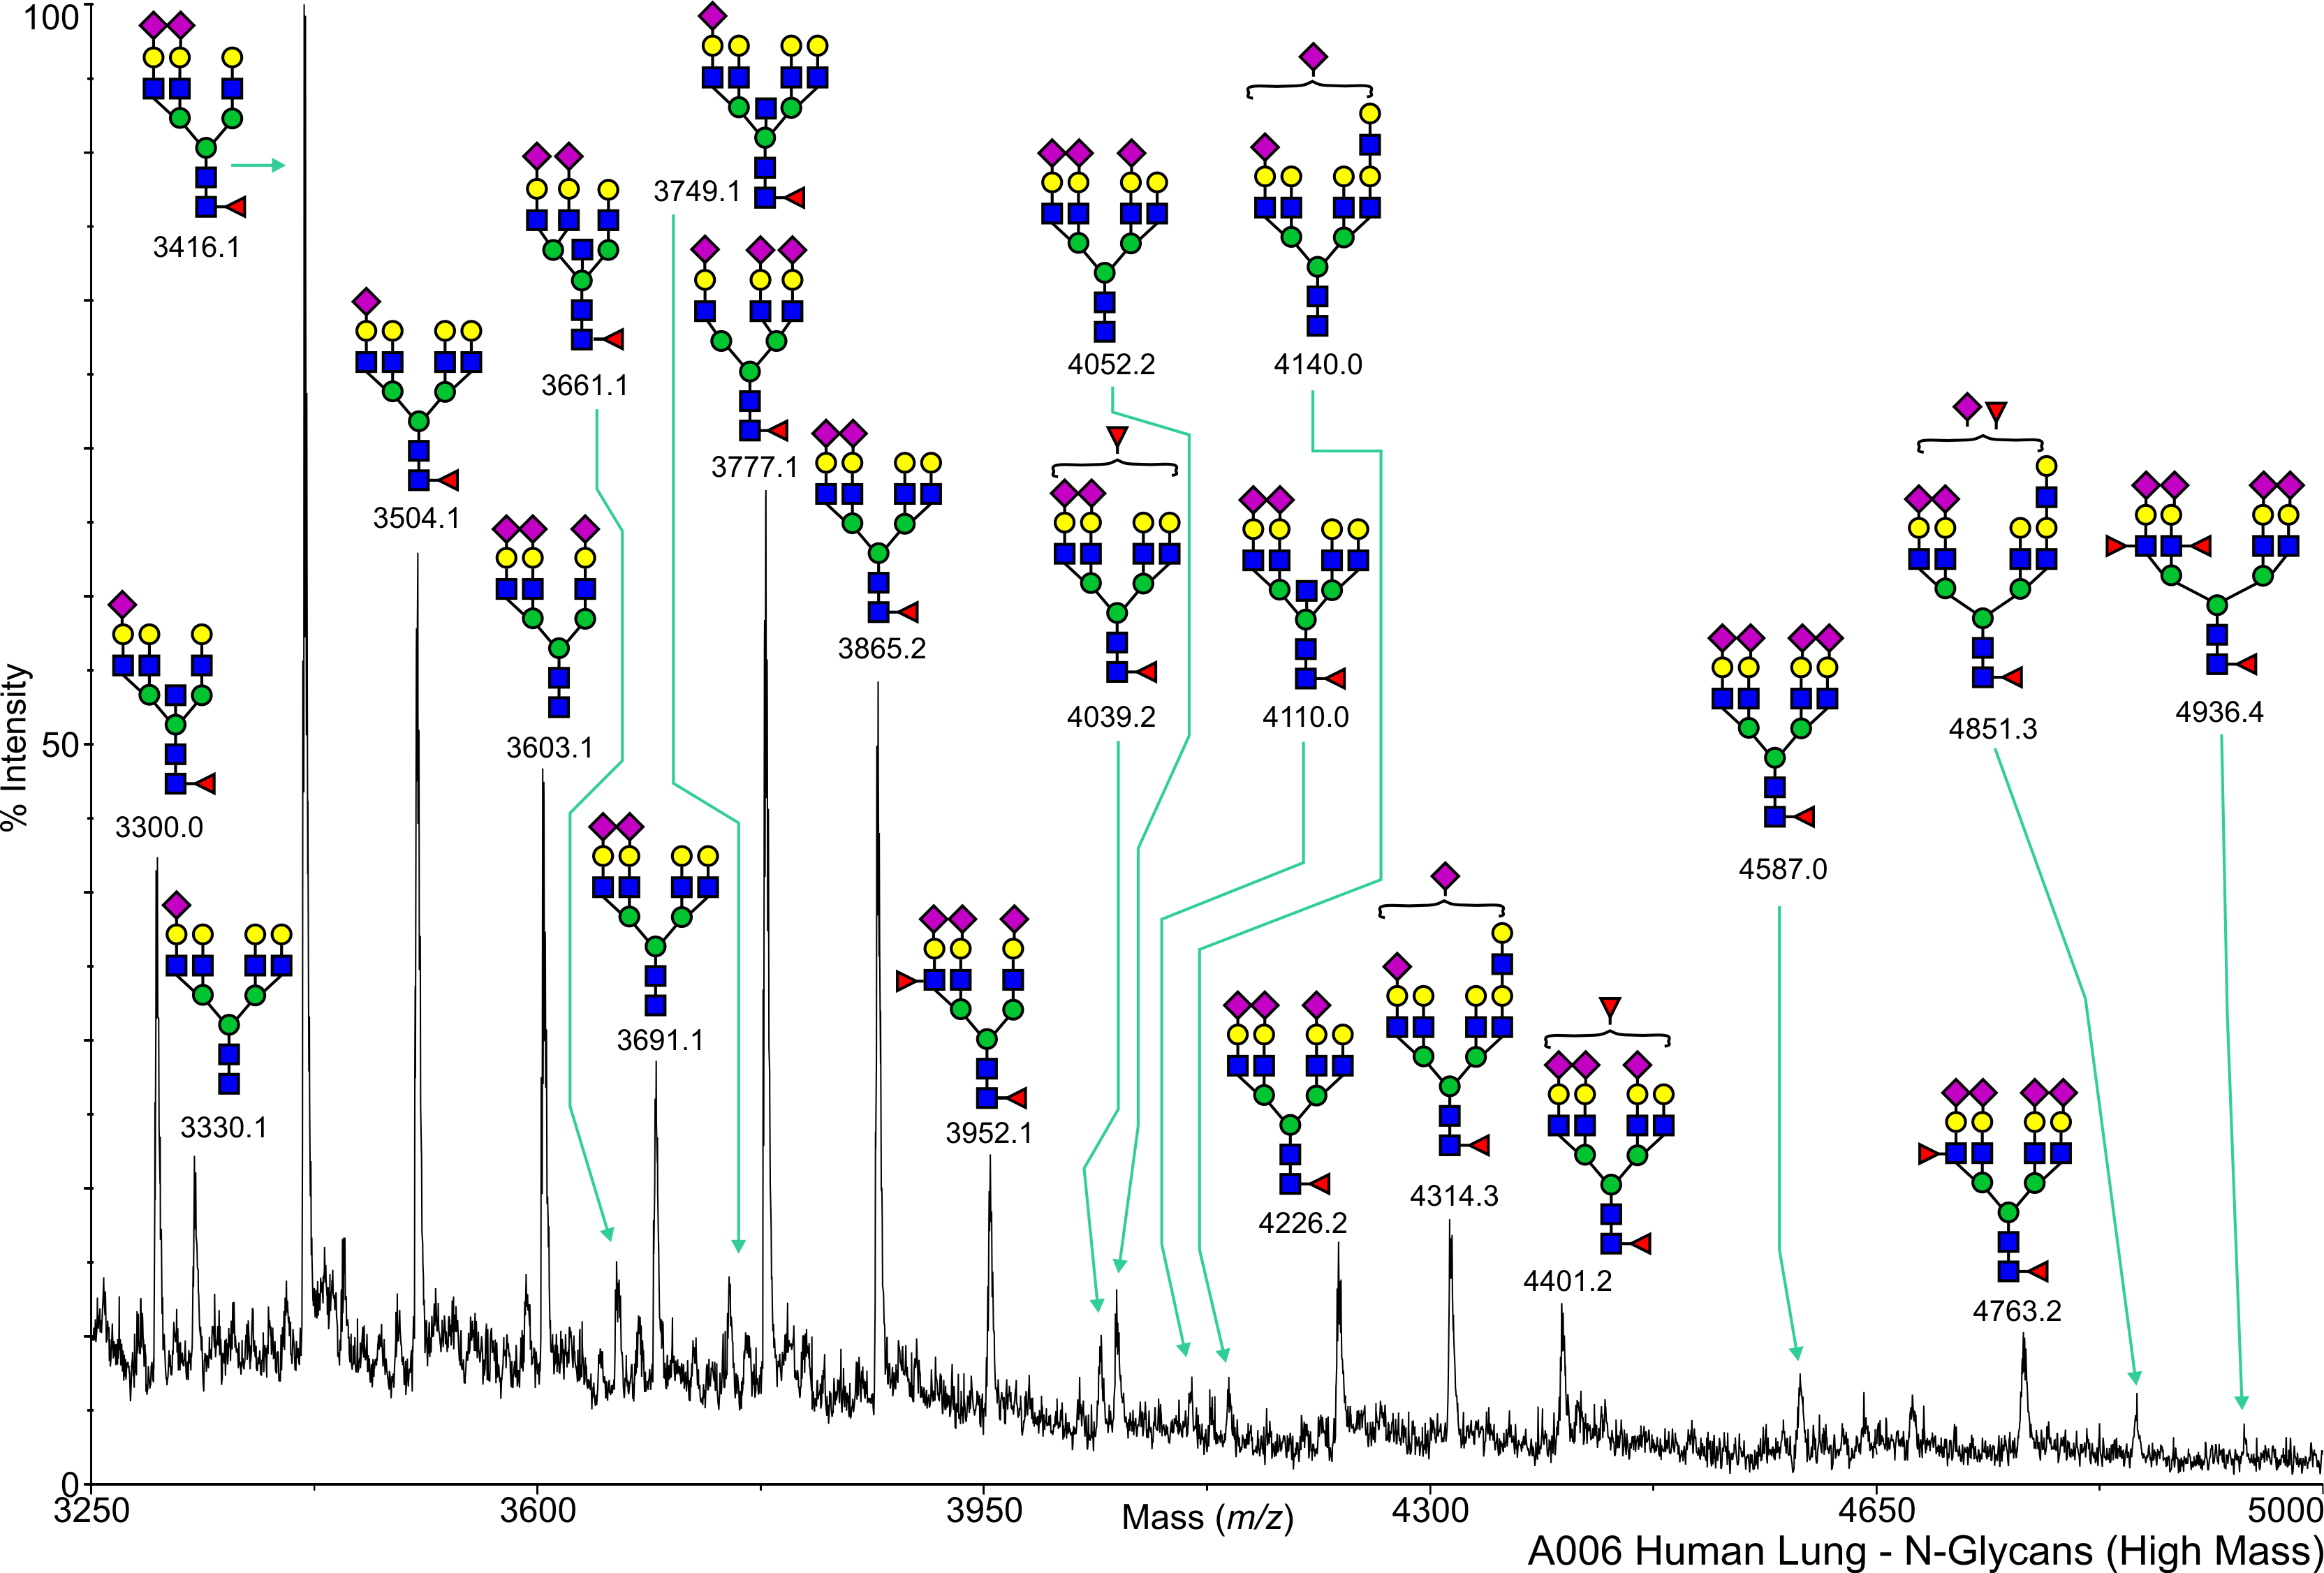
Annotated file for lower mass range in JPG formatAnnotated file for higher mass range in JPG format Annotated file for lower mass range in PDF formatAnnotated file for higher mass range in PDF format
View Mass Spectrum data as text View Mass Peak file   Interactive Mass Spectrum Viewer
cfg_rRequest_1691
Human Lung N-Linked A007 Salomon,Daniel View experimental details      
   
View Mass Spectrum data as text      
cfg_rRequest_1691
Human Lung N-Linked A008 Salomon,Daniel View experimental details      
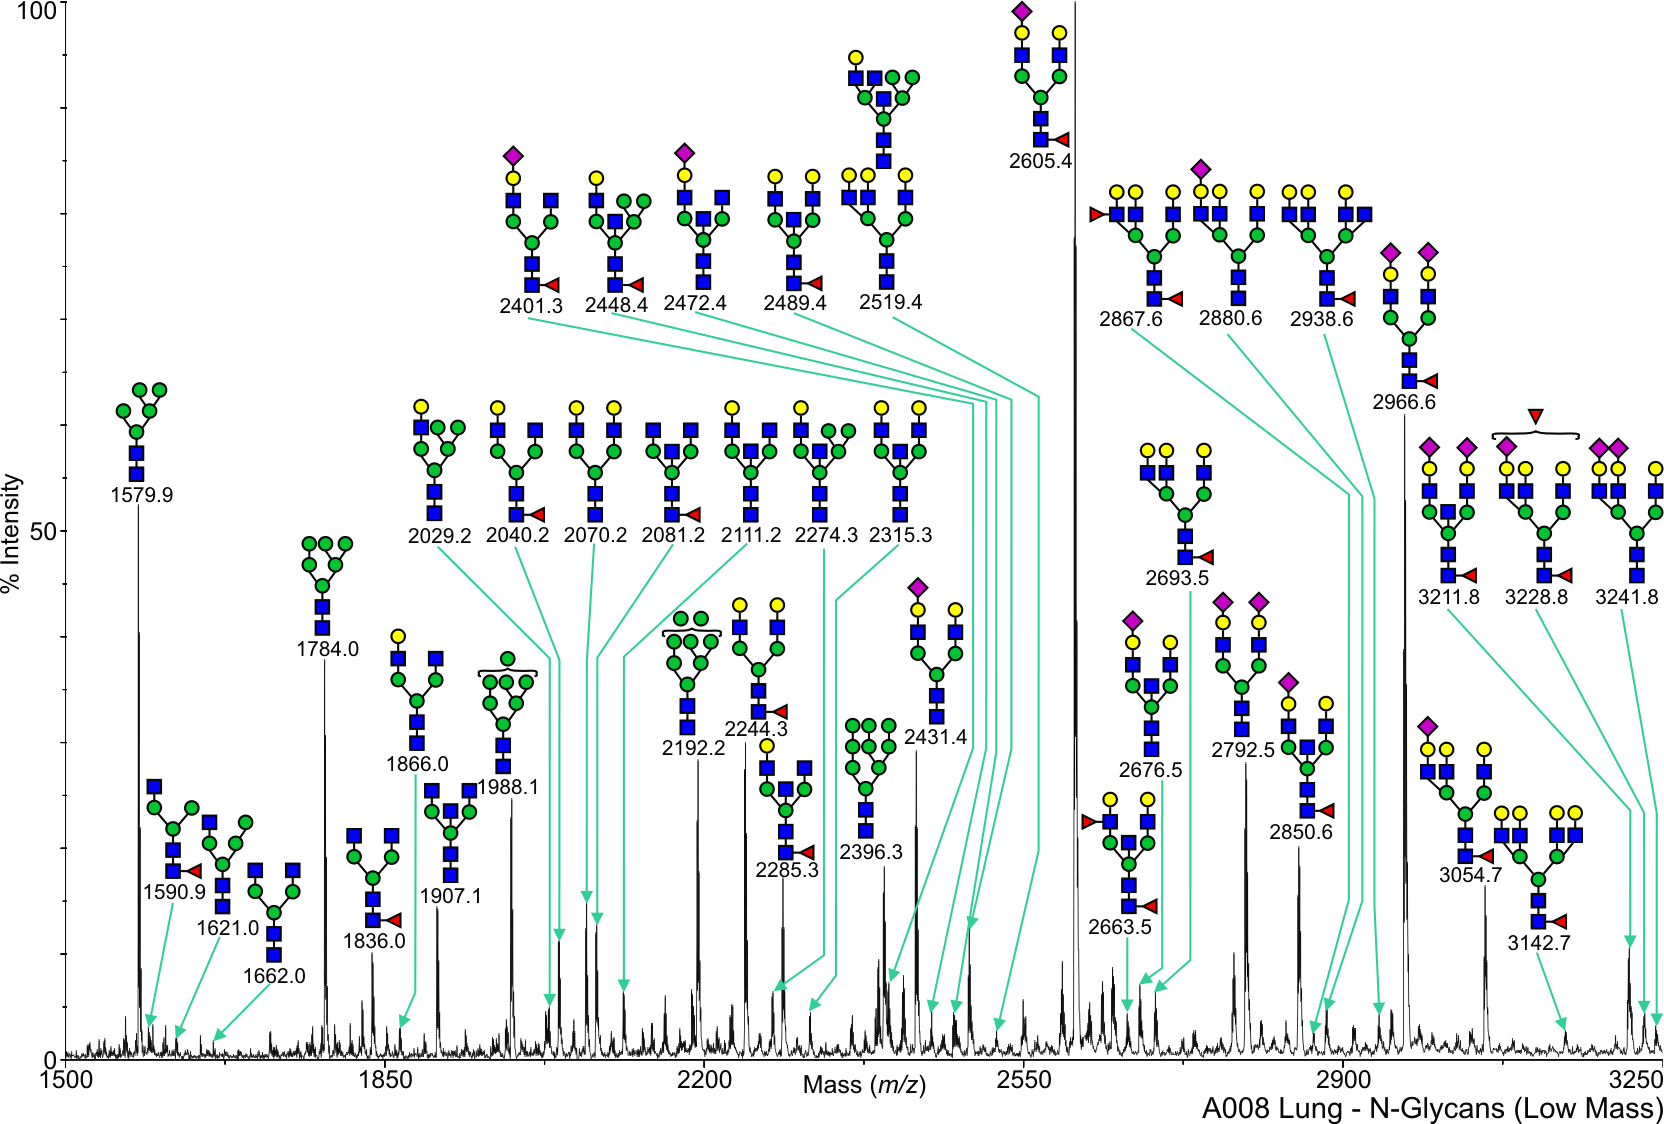
Annotated file for lower mass range in JPG formatAnnotated file for higher mass range in JPG format Annotated file for lower mass range in PDF formatAnnotated file for higher mass range in PDF format
View Mass Spectrum data as text View Mass Peak file   Interactive Mass Spectrum Viewer
cfg_rRequest_1691
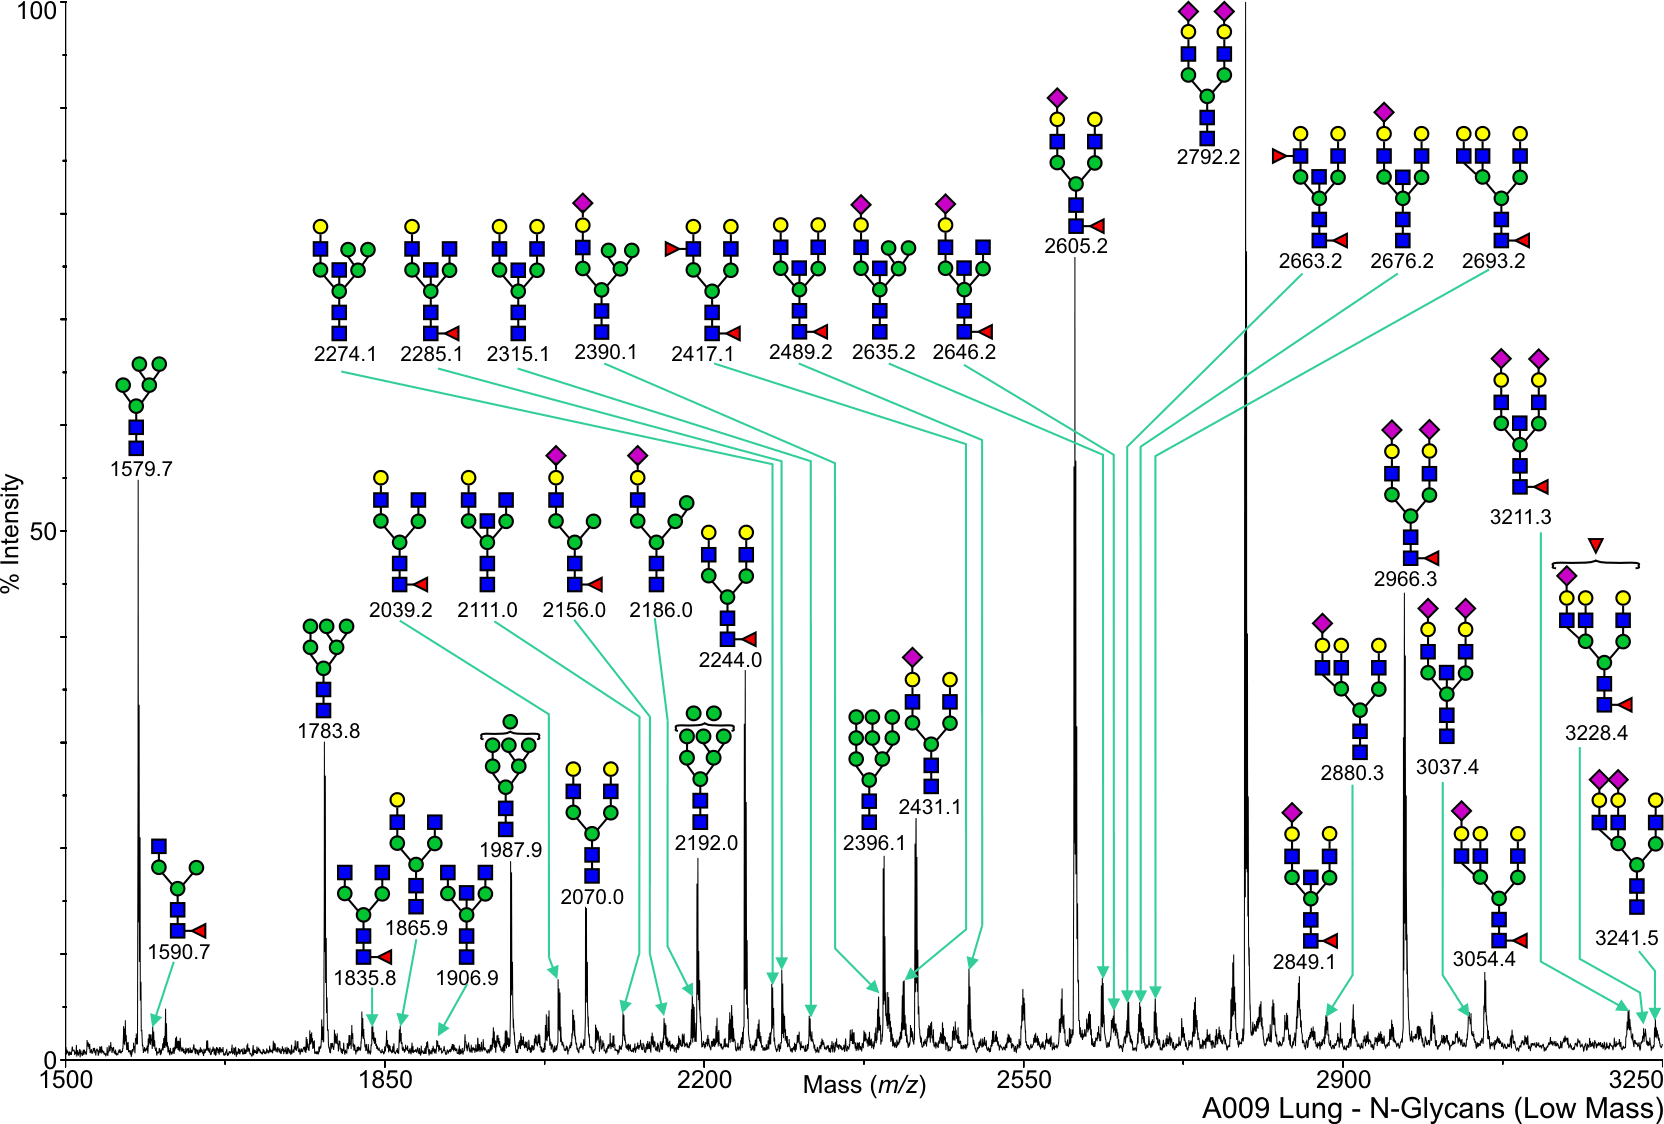
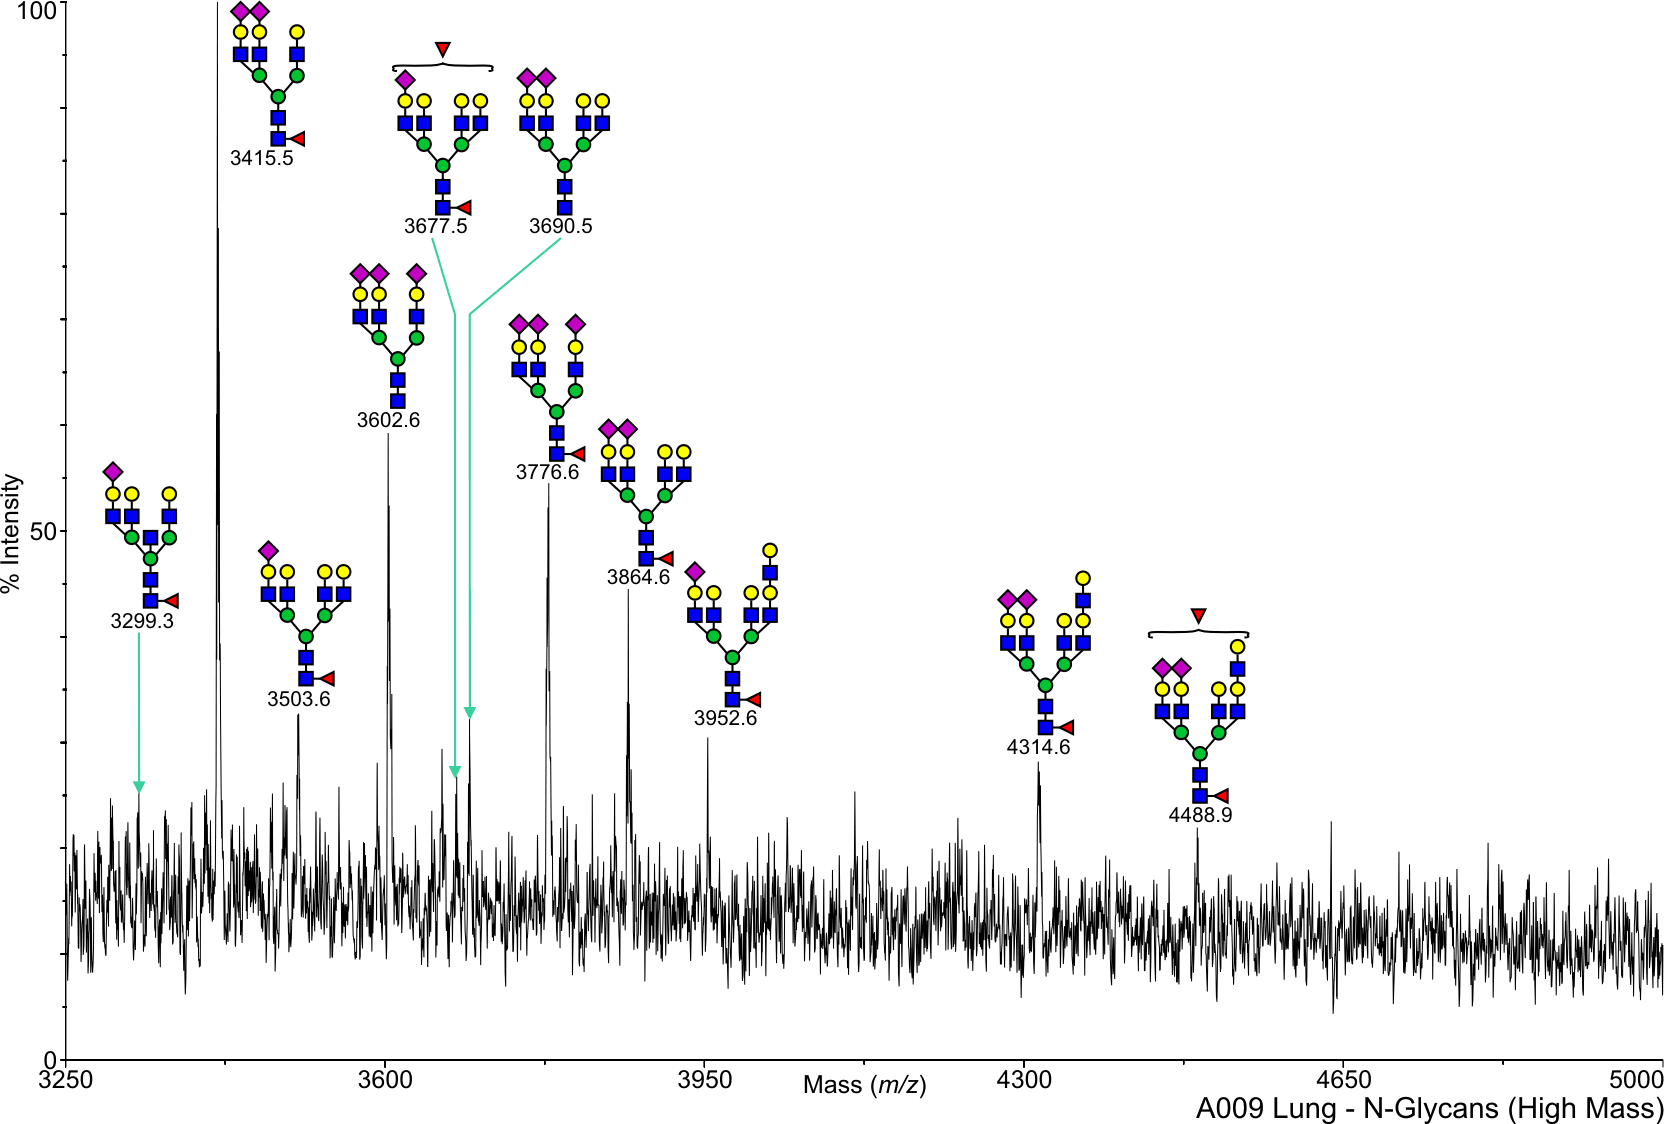
Human Lung N-Linked A009 Salomon,Daniel View experimental details      
Annotated file for lower mass range in JPG formatAnnotated file for higher mass range in JPG format Annotated file for lower mass range in PDF formatAnnotated file for higher mass range in PDF format
View Mass Spectrum data as text View Mass Peak file   Interactive Mass Spectrum Viewer
cfg_rRequest_1691
Human Lung O-Linked 204120 Salomon,Daniel View experimental details      
   
       
cfg_rRequest_1691
Human Lung O-Linked 204151 Salomon,Daniel View experimental details      
   
       
cfg_rRequest_1691
Human Lung O-Linked A002 Salomon,Daniel View experimental details      
   
       
cfg_rRequest_1691
Human Lung O-Linked A004 Salomon,Daniel View experimental details      
   
       
cfg_rRequest_1691
Human Lung O-Linked A006 Salomon,Daniel View experimental details      
   
       
cfg_rRequest_1691
Human Lung O-Linked A007 Salomon,Daniel View experimental details      
   
View Mass Spectrum data as text      
cfg_rRequest_1691
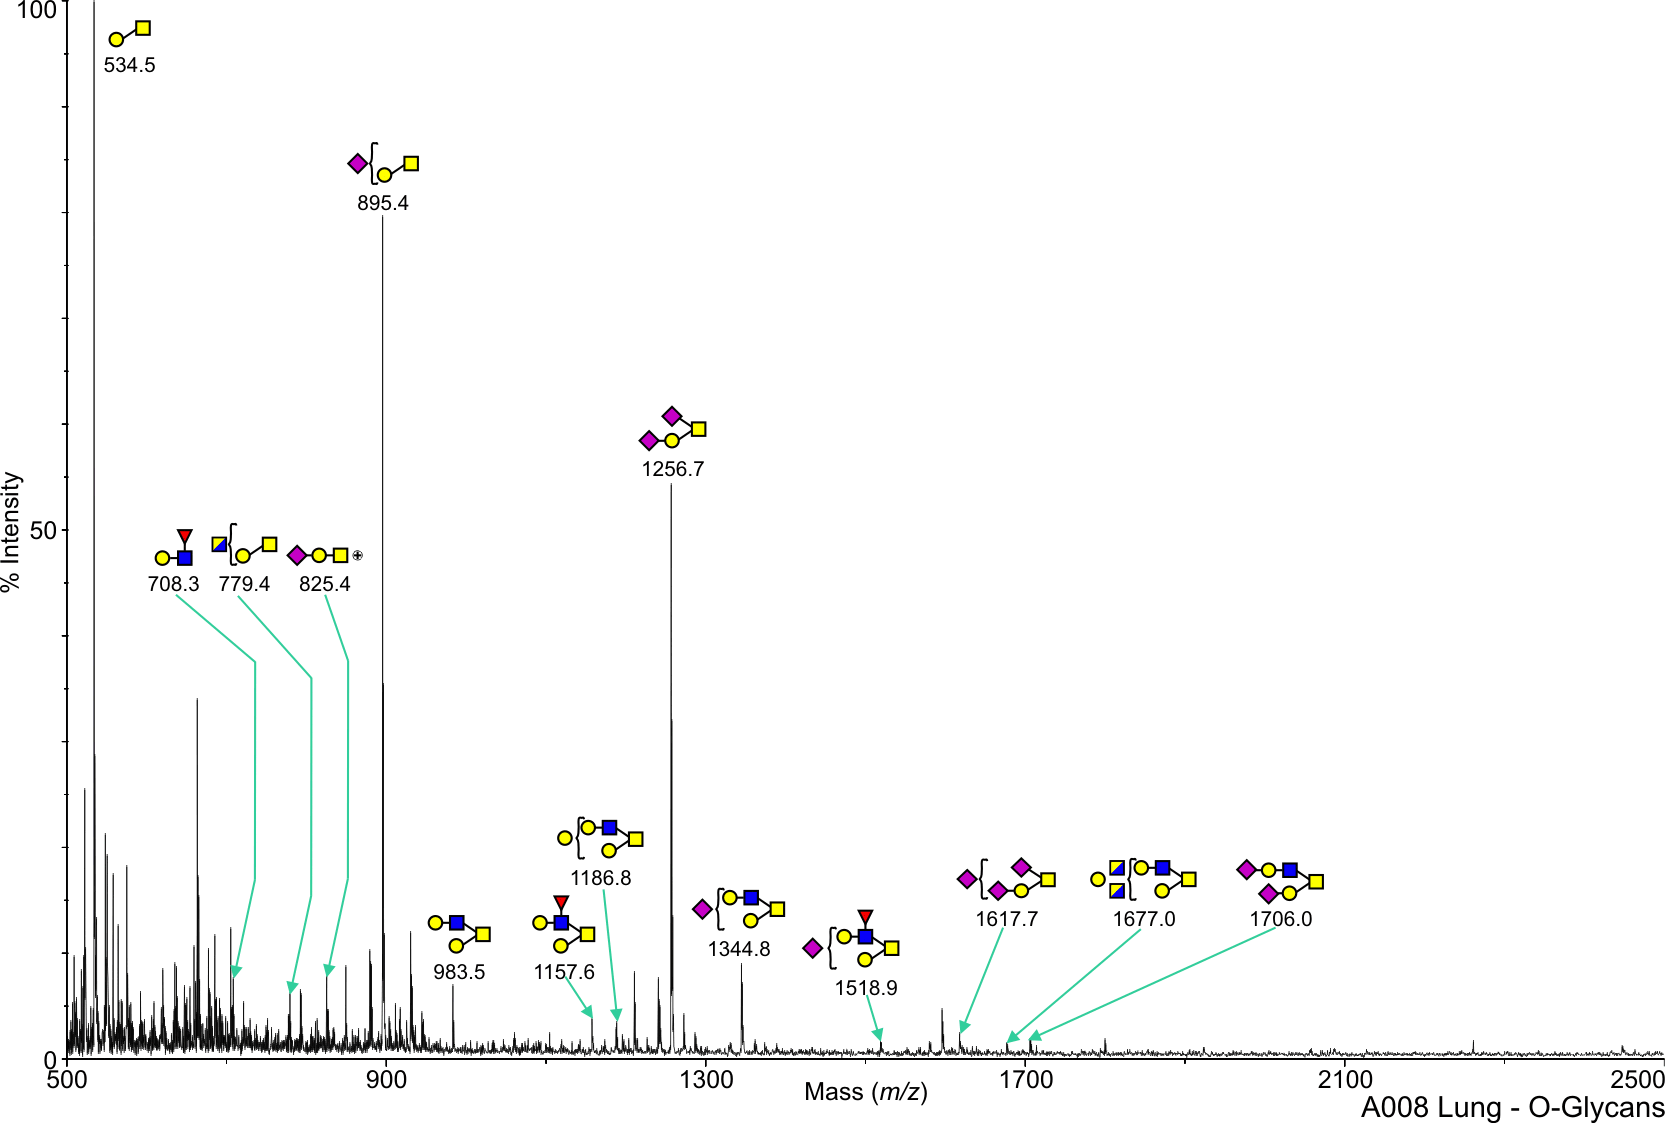
Human Lung O-Linked A008 Salomon,Daniel View experimental details      
Annotated file in JPG format Annotated file in PDF format
View Mass Spectrum data as text View Mass Peak file   Interactive Mass Spectrum Viewer
cfg_rRequest_1691
Human Lung O-Linked A009 Salomon,Daniel View experimental details      
Annotated file in JPG format Annotated file in PDF format
View Mass Spectrum data as text View Mass Peak file   Interactive Mass Spectrum Viewer
cfg_rRequest_1691
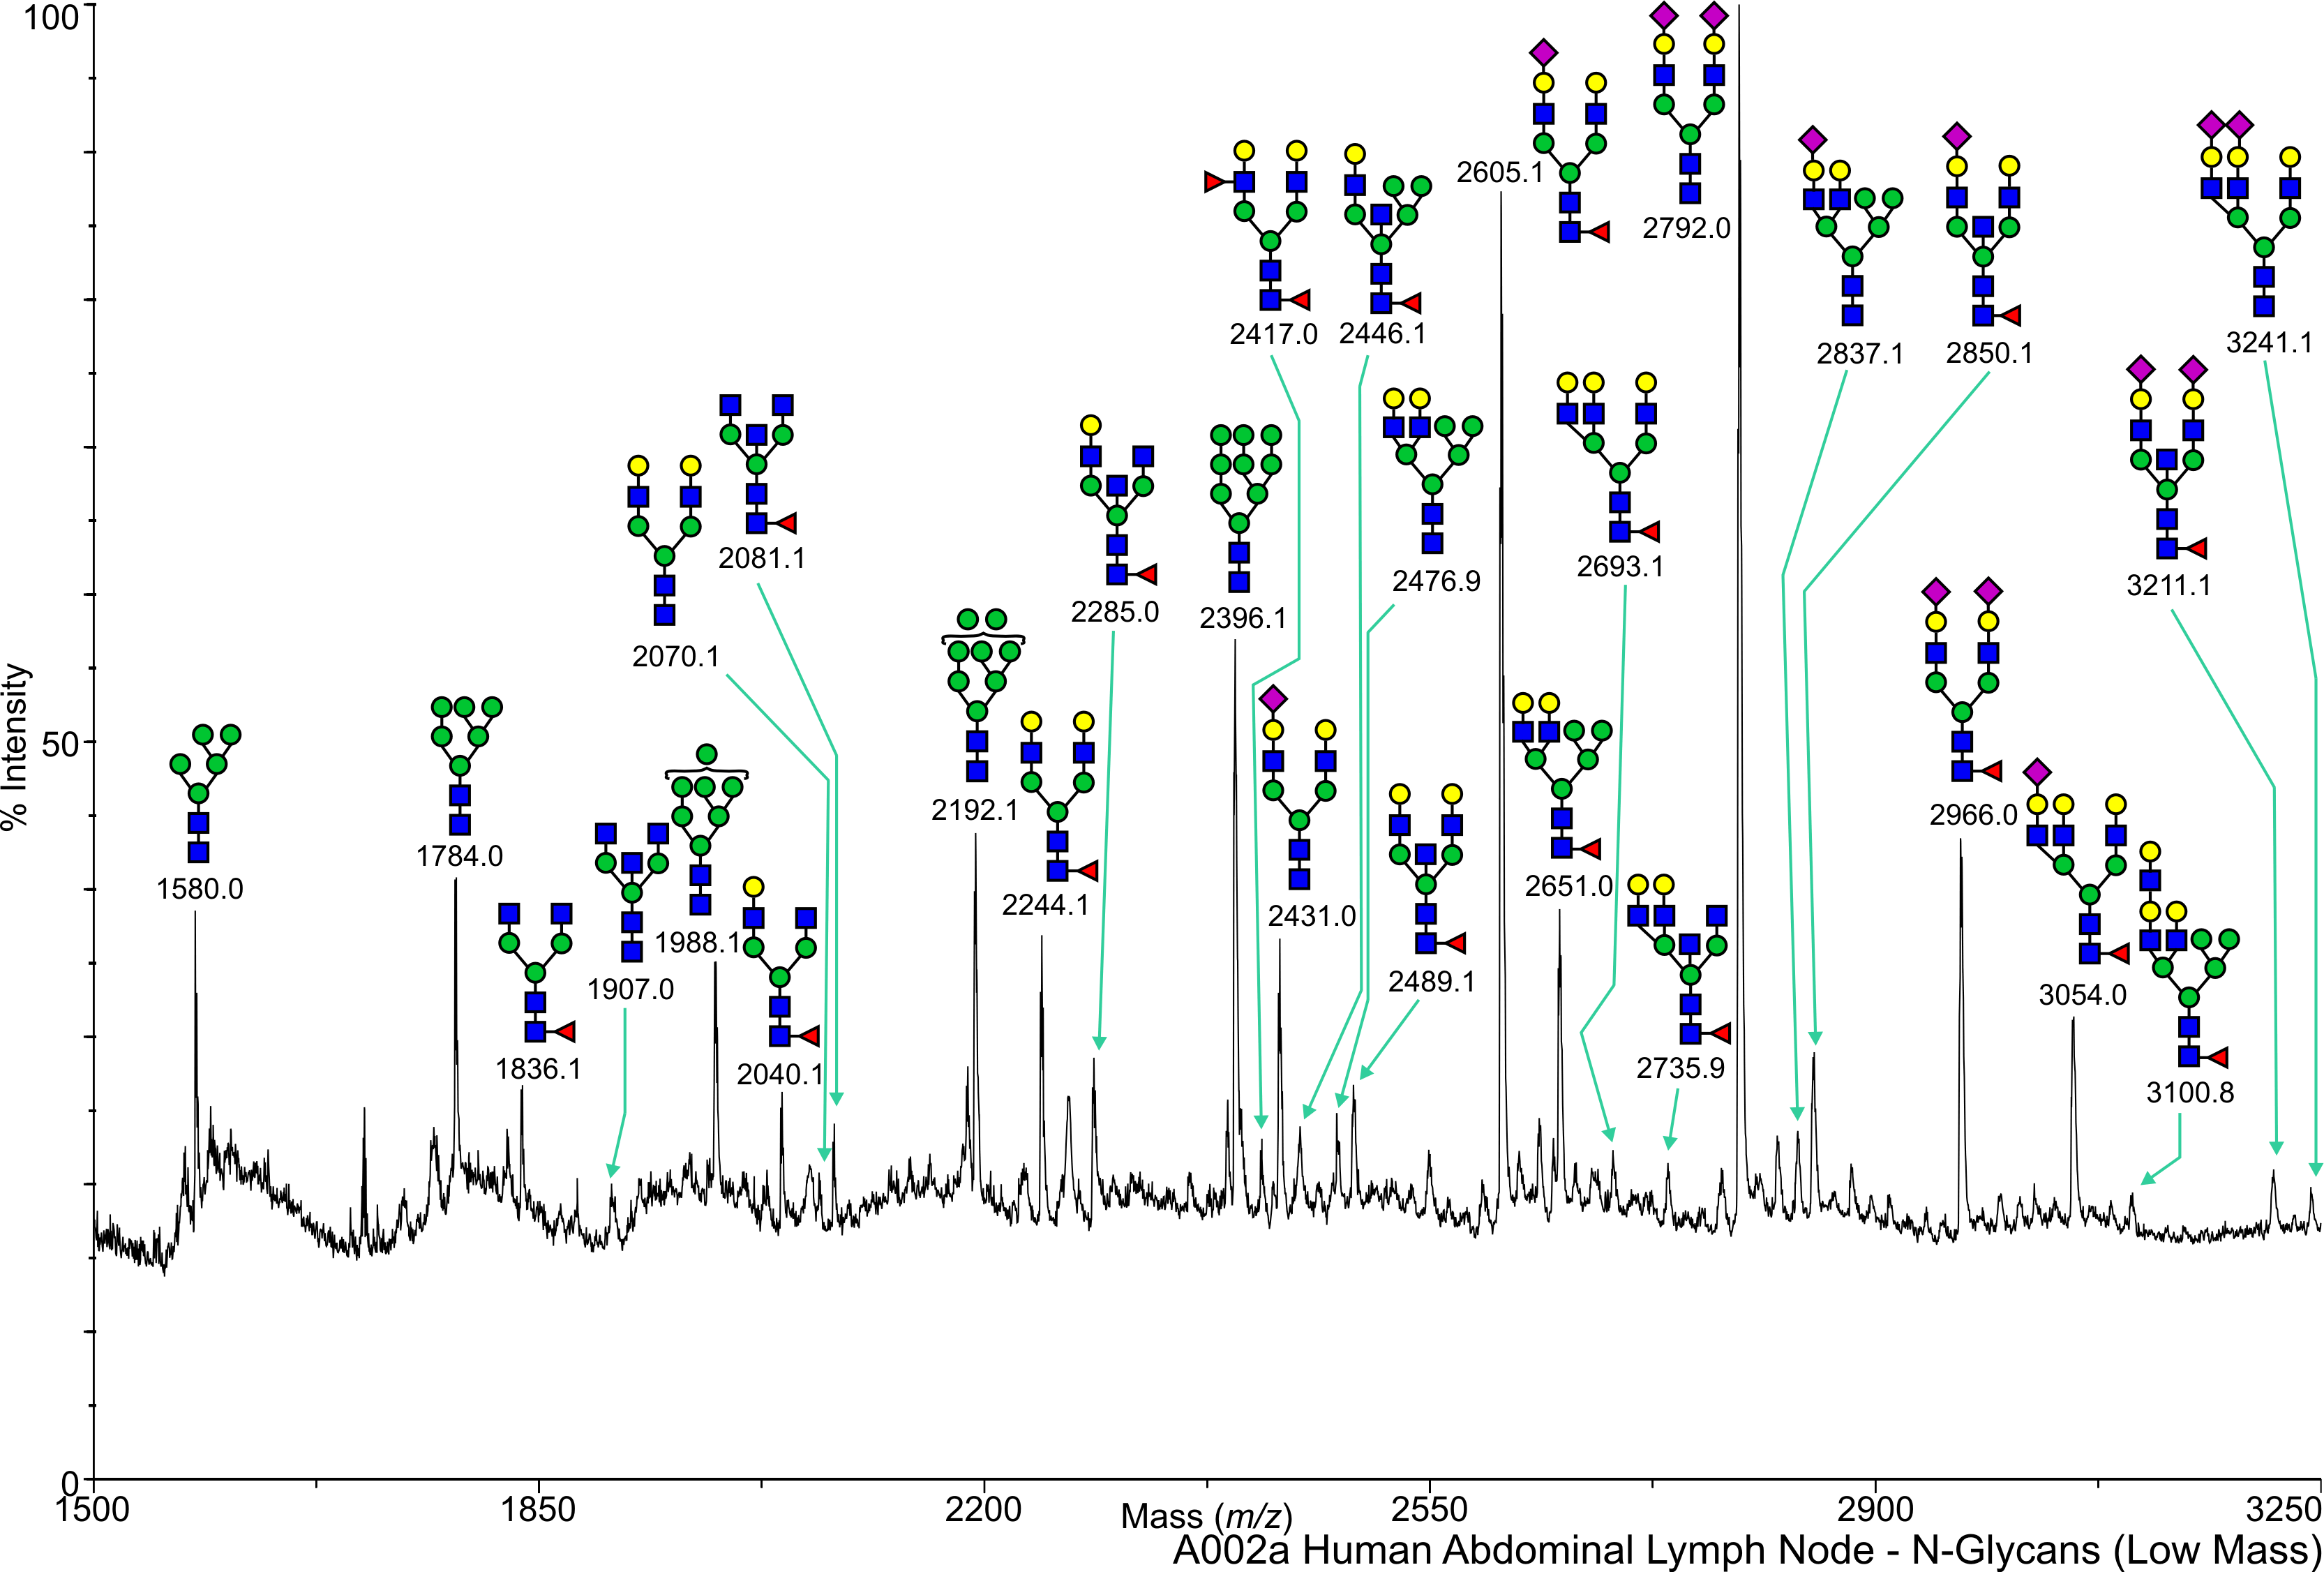
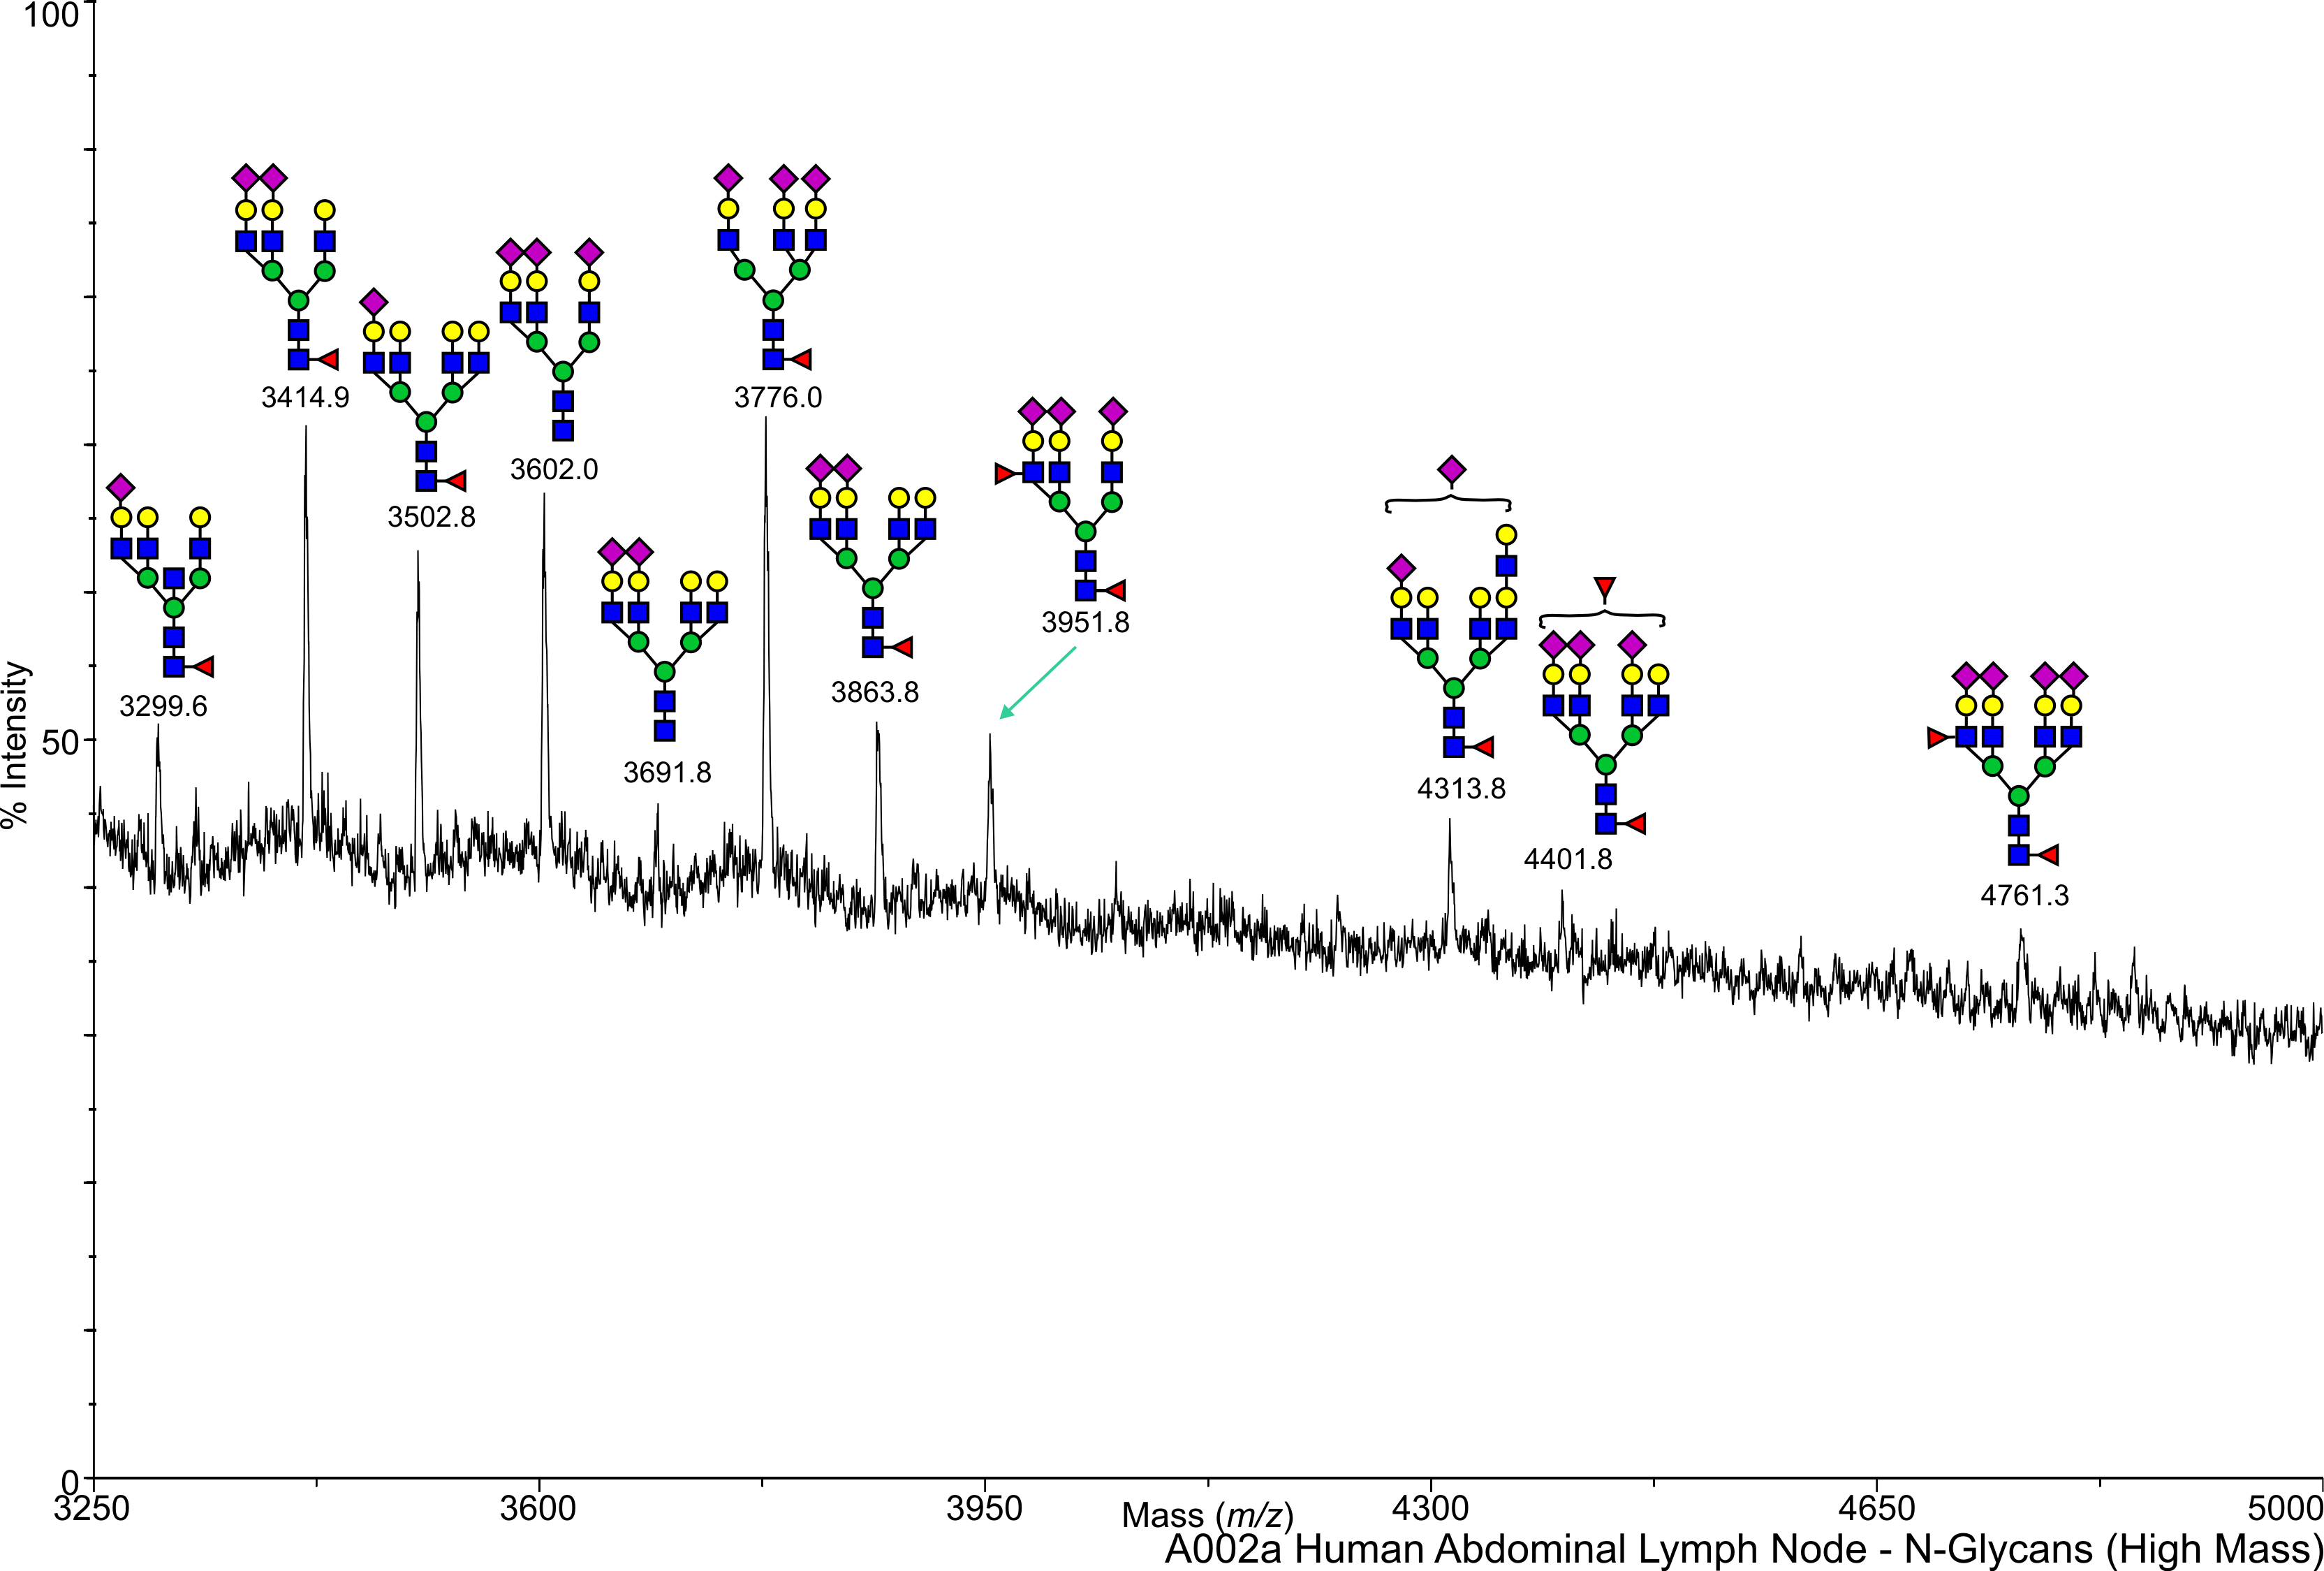
Human Lymph Node N-Linked A002a Salomon,Daniel View experimental details      
Annotated file for lower mass range in JPG formatAnnotated file for higher mass range in JPG format Annotated file for lower mass range in PDF formatAnnotated file for higher mass range in PDF format
       
cfg_rRequest_1691
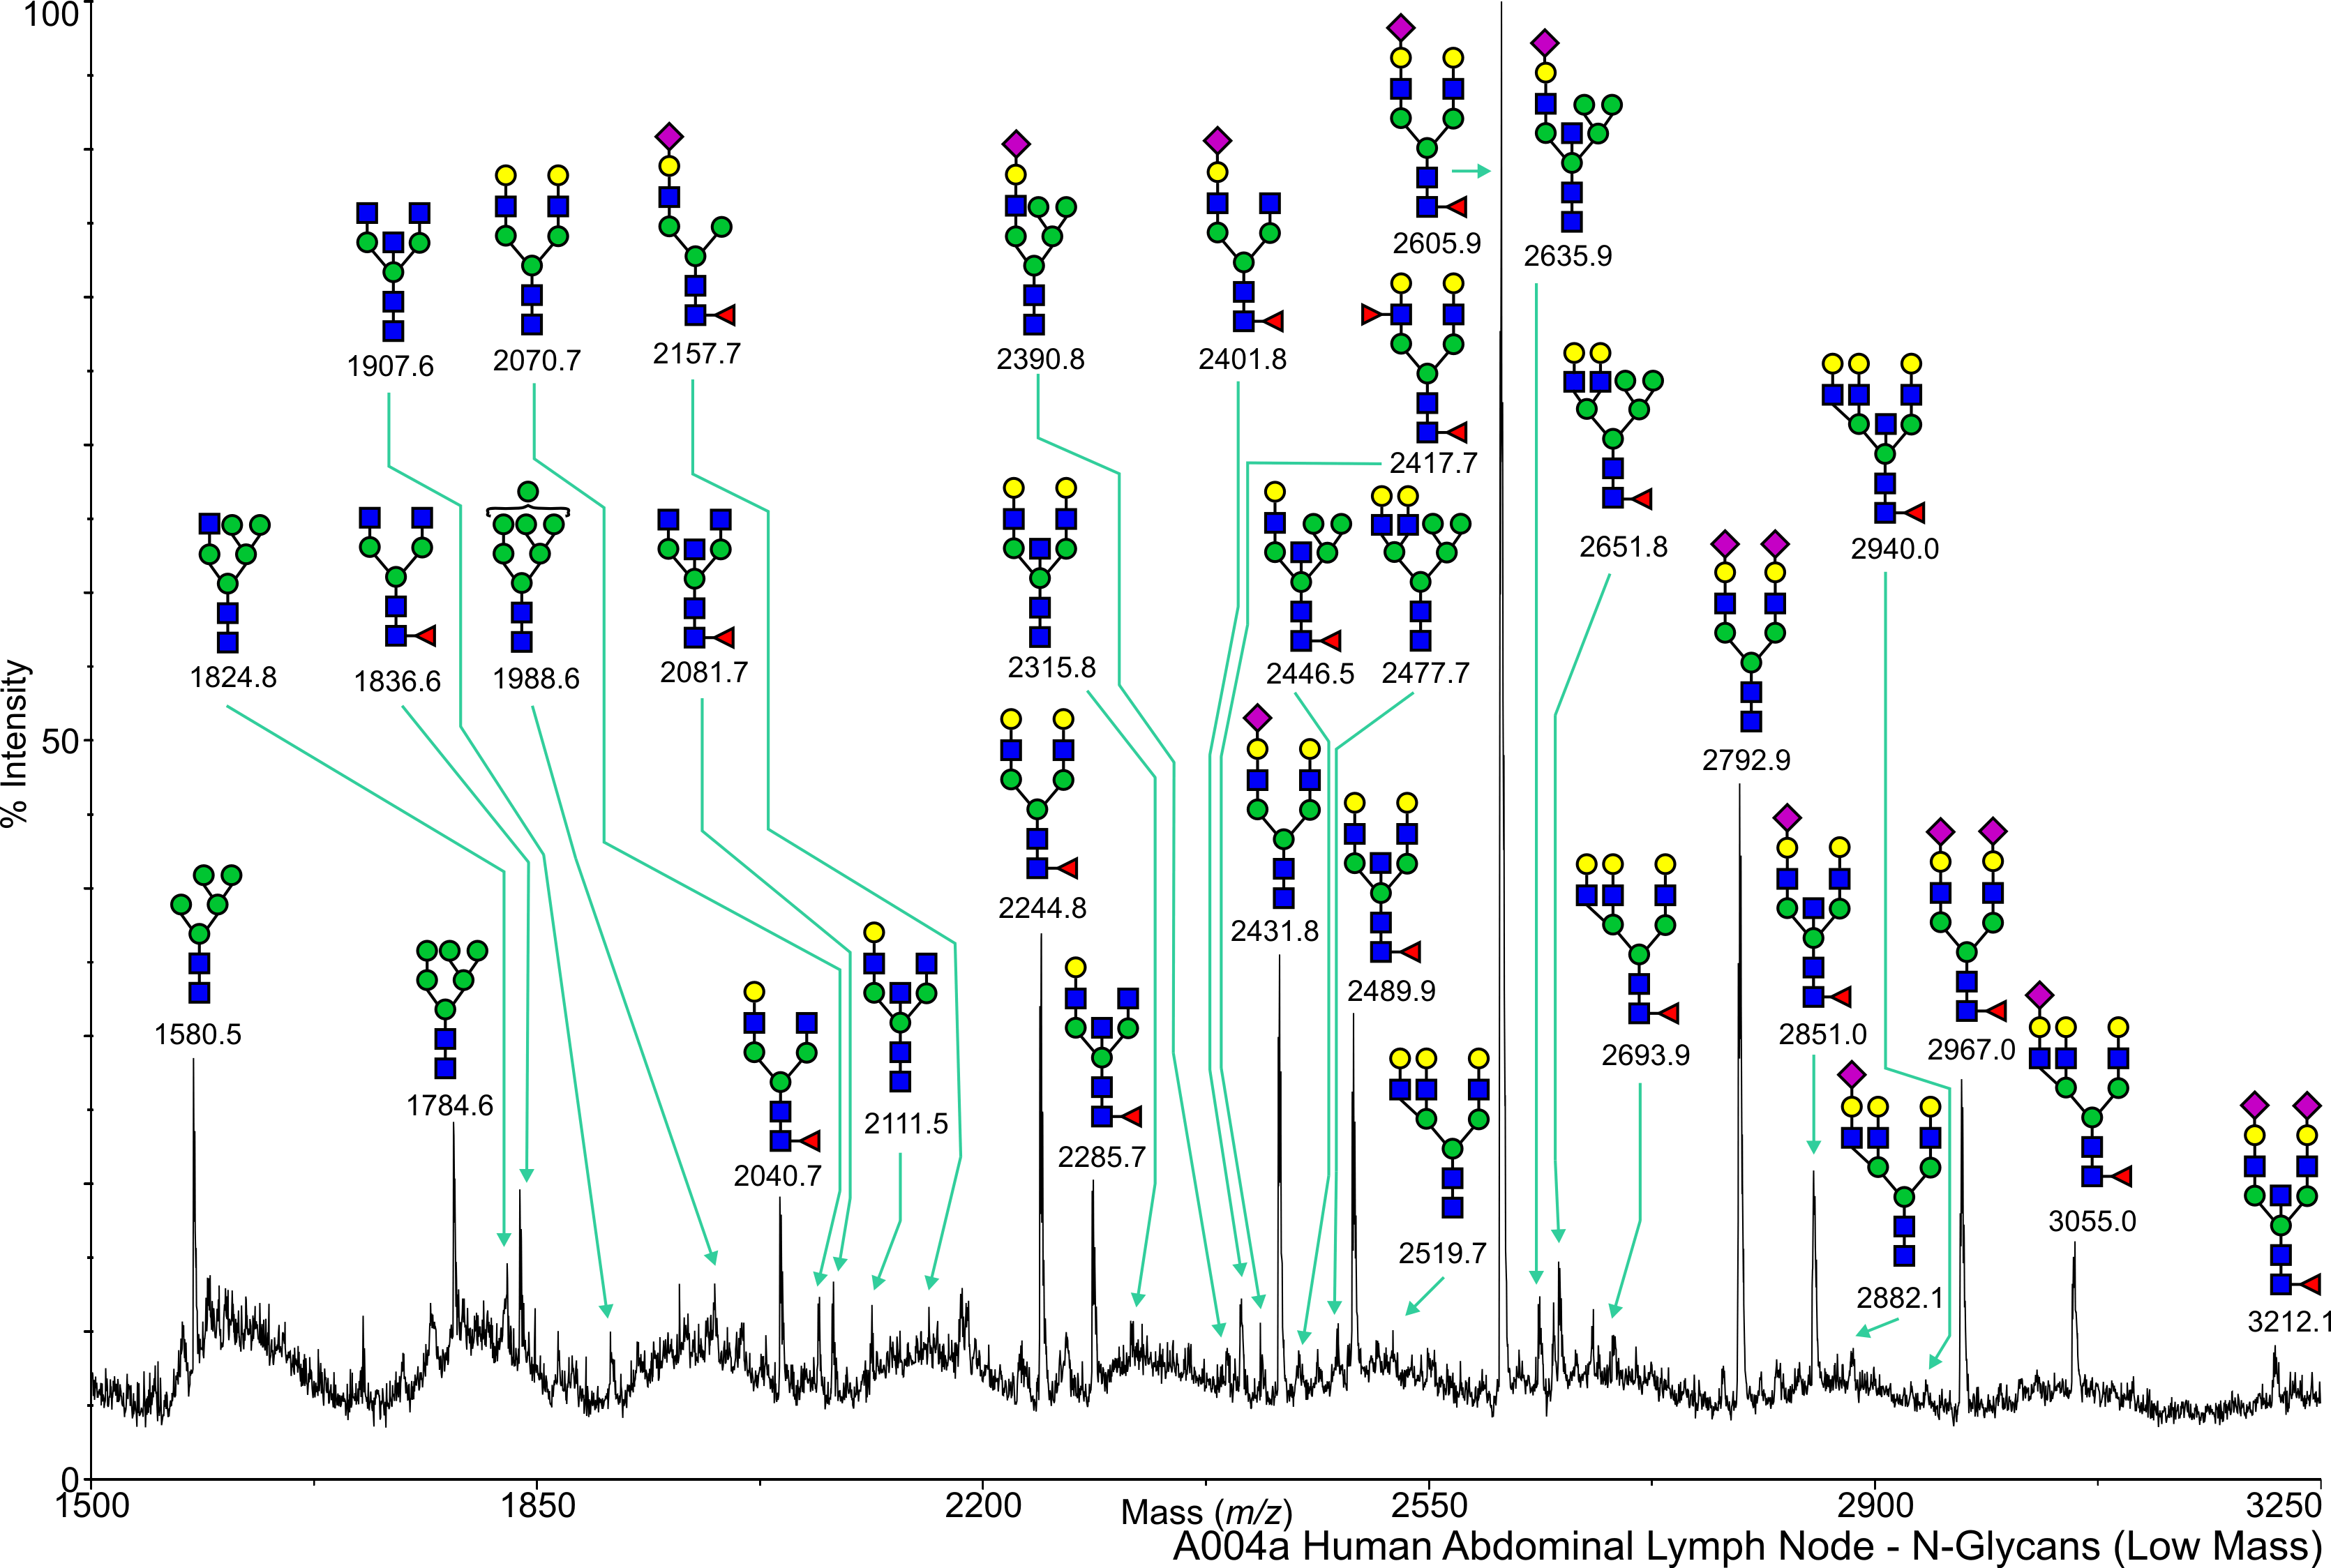
Human Lymph Node N-Linked A004a Salomon,Daniel View experimental details      
Annotated file for lower mass range in JPG formatAnnotated file for higher mass range in JPG format Annotated file for lower mass range in PDF formatAnnotated file for higher mass range in PDF format
View Mass Spectrum data as text View Mass Peak file   Interactive Mass Spectrum Viewer
cfg_rRequest_1691
Human Lymph Node N-Linked A006a Salomon,Daniel View experimental details      
Annotated file for lower mass range in JPG formatAnnotated file for higher mass range in JPG format Annotated file for lower mass range in PDF formatAnnotated file for higher mass range in PDF format
View Mass Spectrum data as text View Mass Peak file   Interactive Mass Spectrum Viewer
cfg_rRequest_1691
Human Lymph Node N-Linked P004a Salomon,Daniel View experimental details      
Annotated file for lower mass range in JPG formatAnnotated file for higher mass range in JPG format Annotated file for lower mass range in PDF formatAnnotated file for higher mass range in PDF format
       
cfg_rRequest_1691
Human Lymph Node O-Linked A002a Salomon,Daniel View experimental details      
   
       
cfg_rRequest_1691
Human Lymph Node O-Linked A004a Salomon,Daniel View experimental details      
   
       
cfg_rRequest_1691
Human Lymph Node O-Linked A006a Salomon,Daniel View experimental details      
   
       
cfg_rRequest_1691
Human Lymph Node O-Linked P004a Salomon,Daniel View experimental details      
   
       
cfg_rRequest_1691
Human Pancreas N-Linked 204151 Salomon,Daniel View experimental details      
   
       
cfg_rRequest_1691
Human Pancreas N-Linked A002 Salomon,Daniel View experimental details      
   
       
cfg_rRequest_1691
Human Pancreas N-Linked A004 Salomon,Daniel View experimental details      
   
       
cfg_rRequest_1691
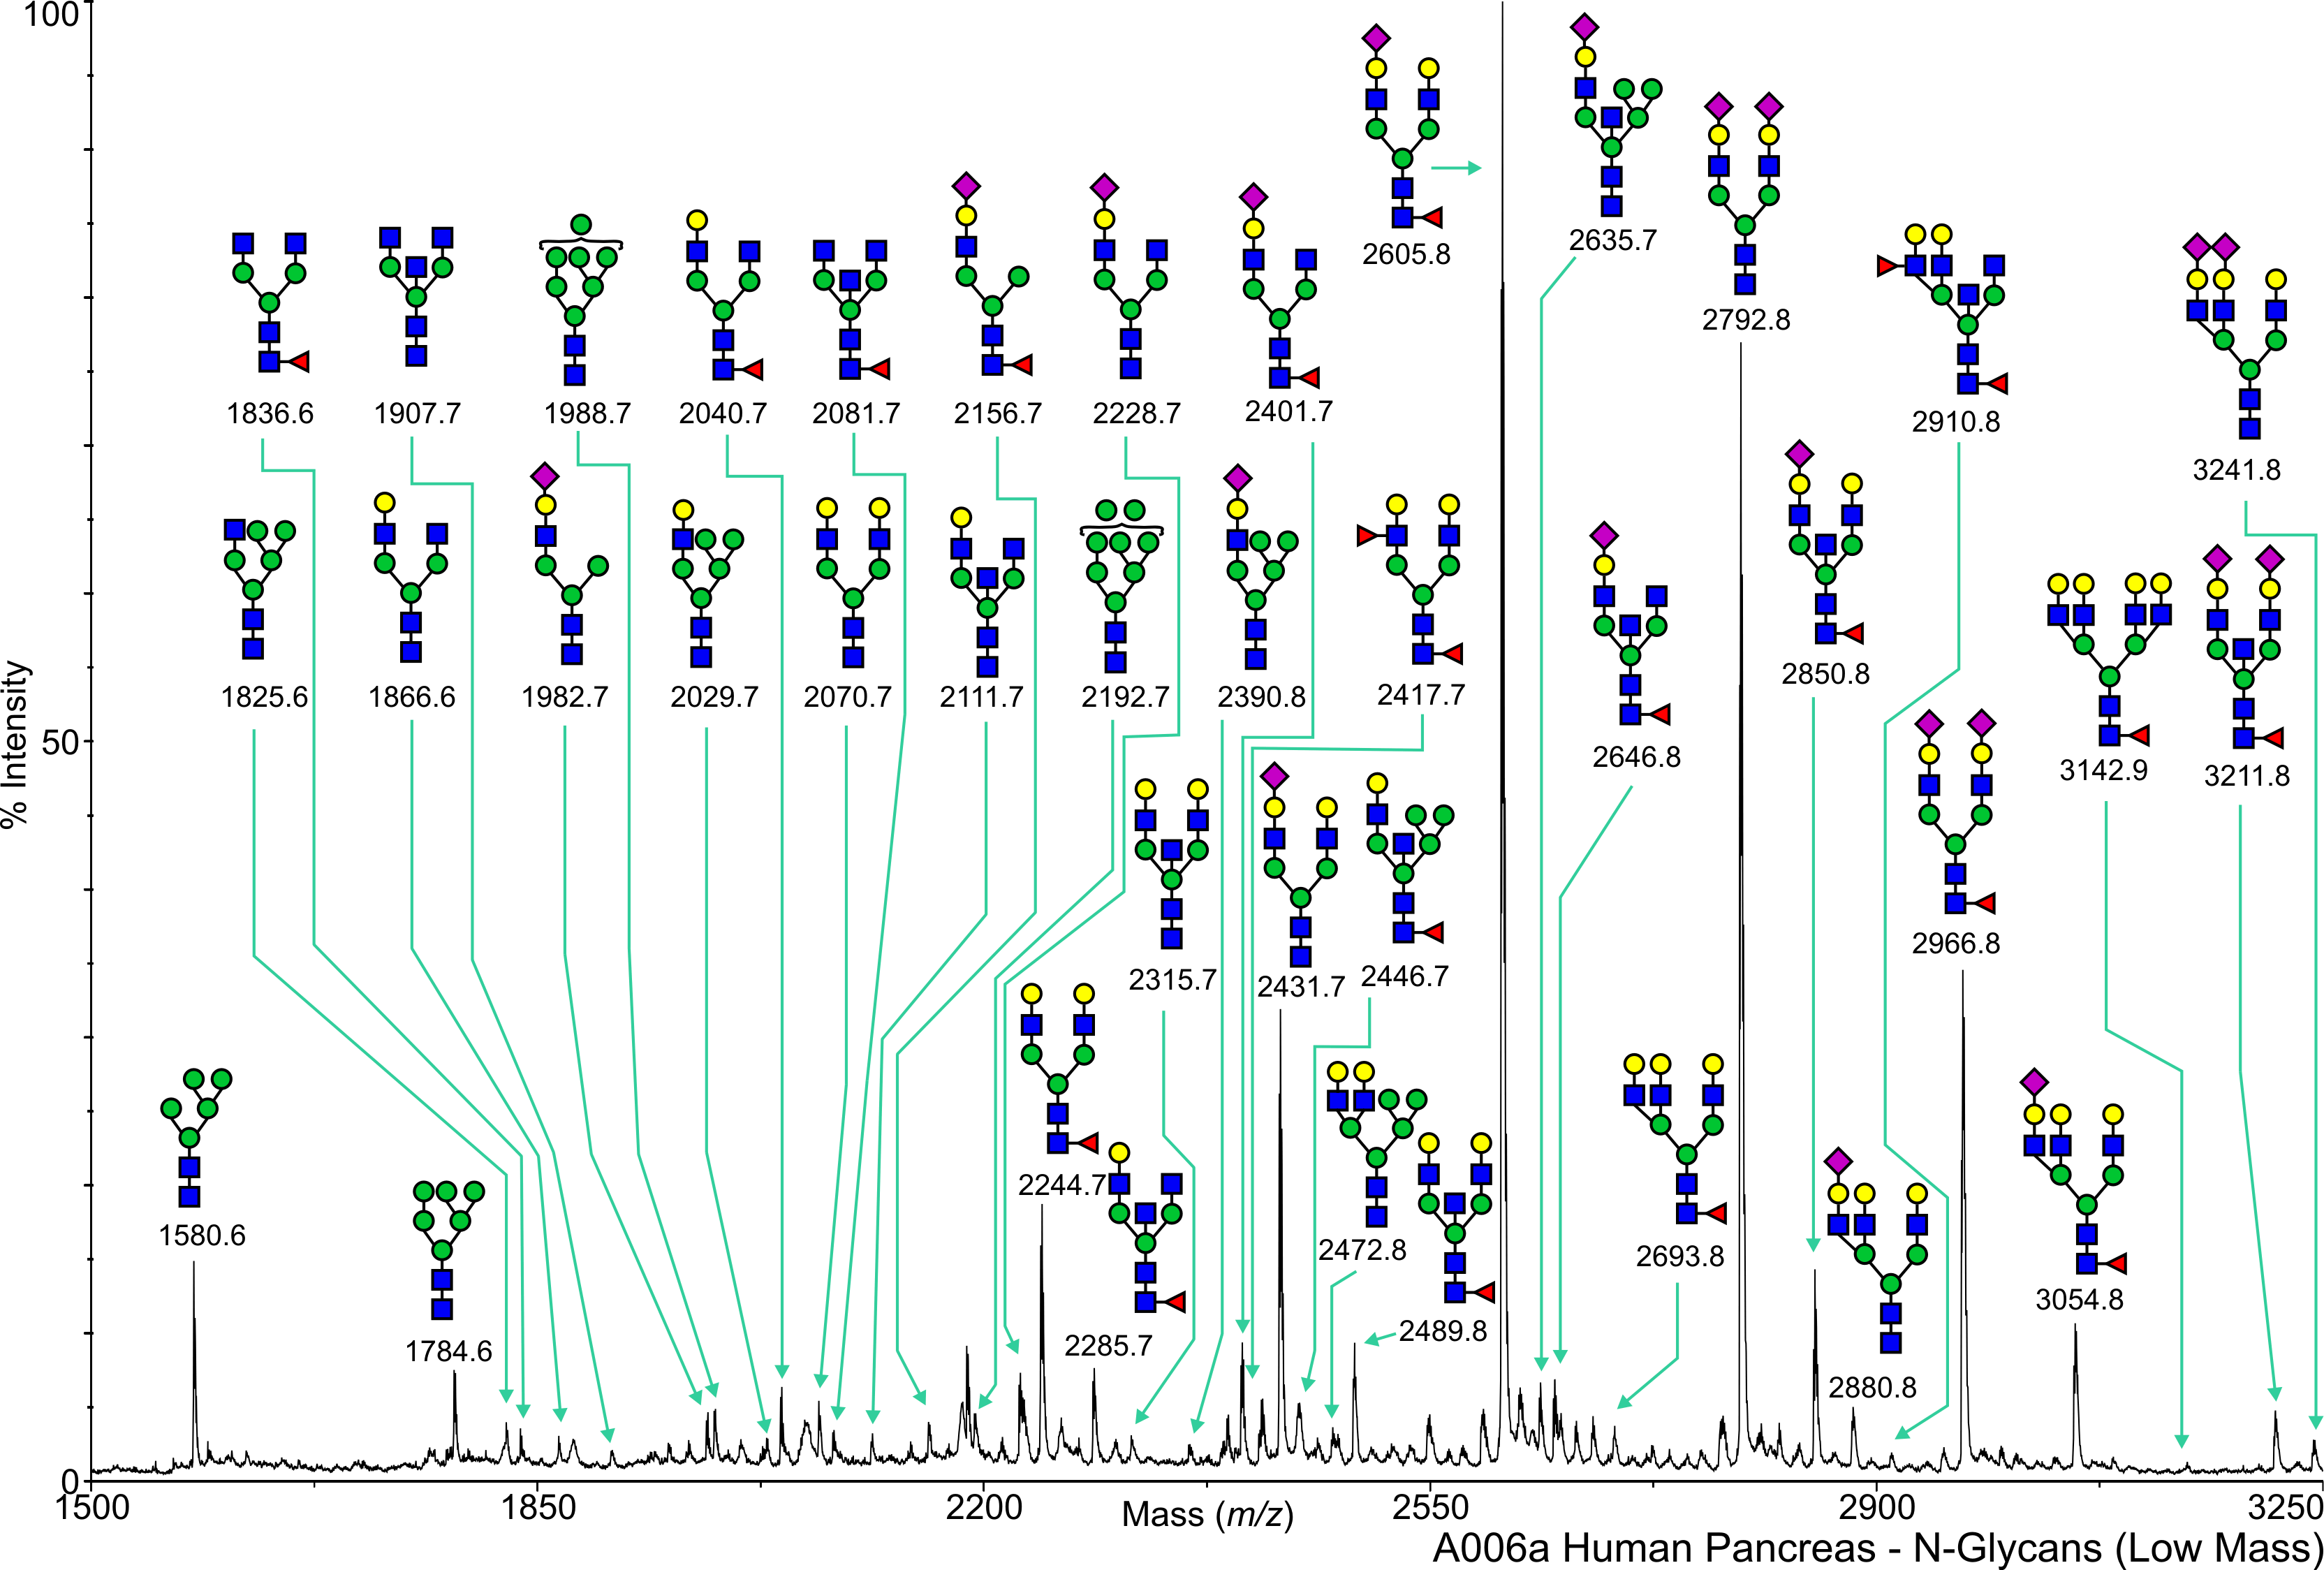
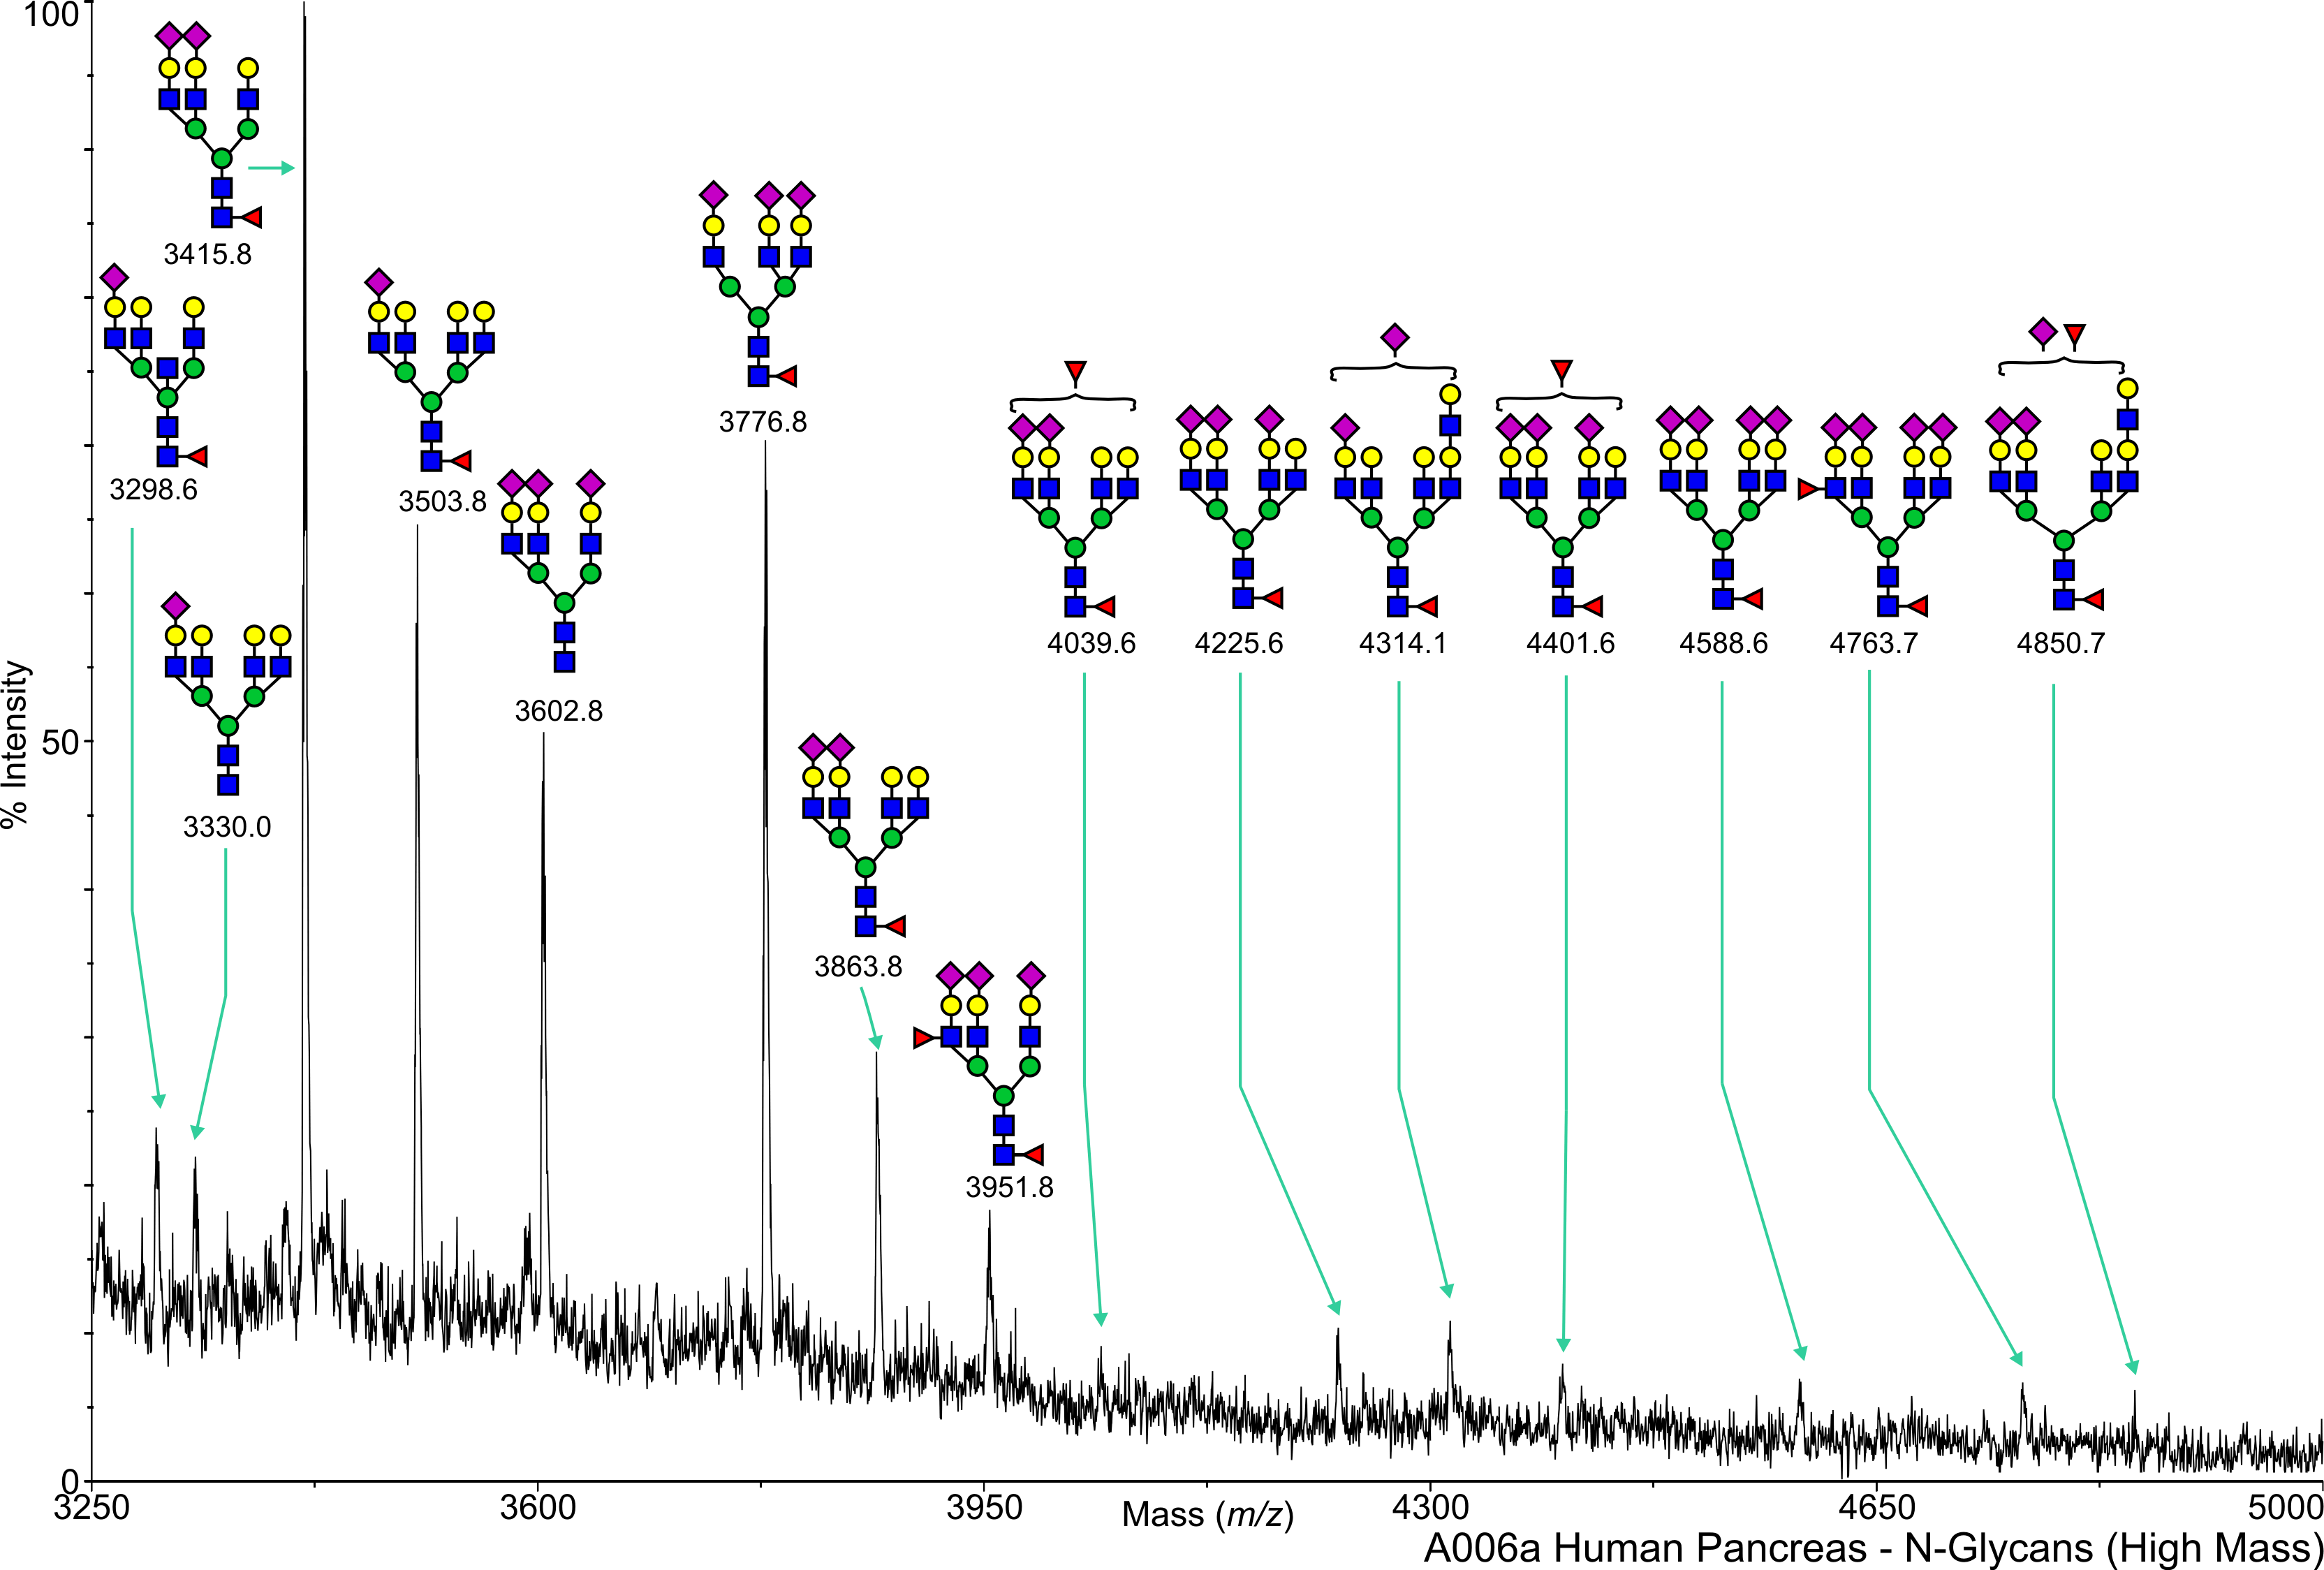
Human Pancreas N-Linked A006a Salomon,Daniel View experimental details      
Annotated file for lower mass range in JPG formatAnnotated file for higher mass range in JPG format Annotated file for lower mass range in PDF formatAnnotated file for higher mass range in PDF format
View Mass Spectrum data as text      
cfg_rRequest_1691
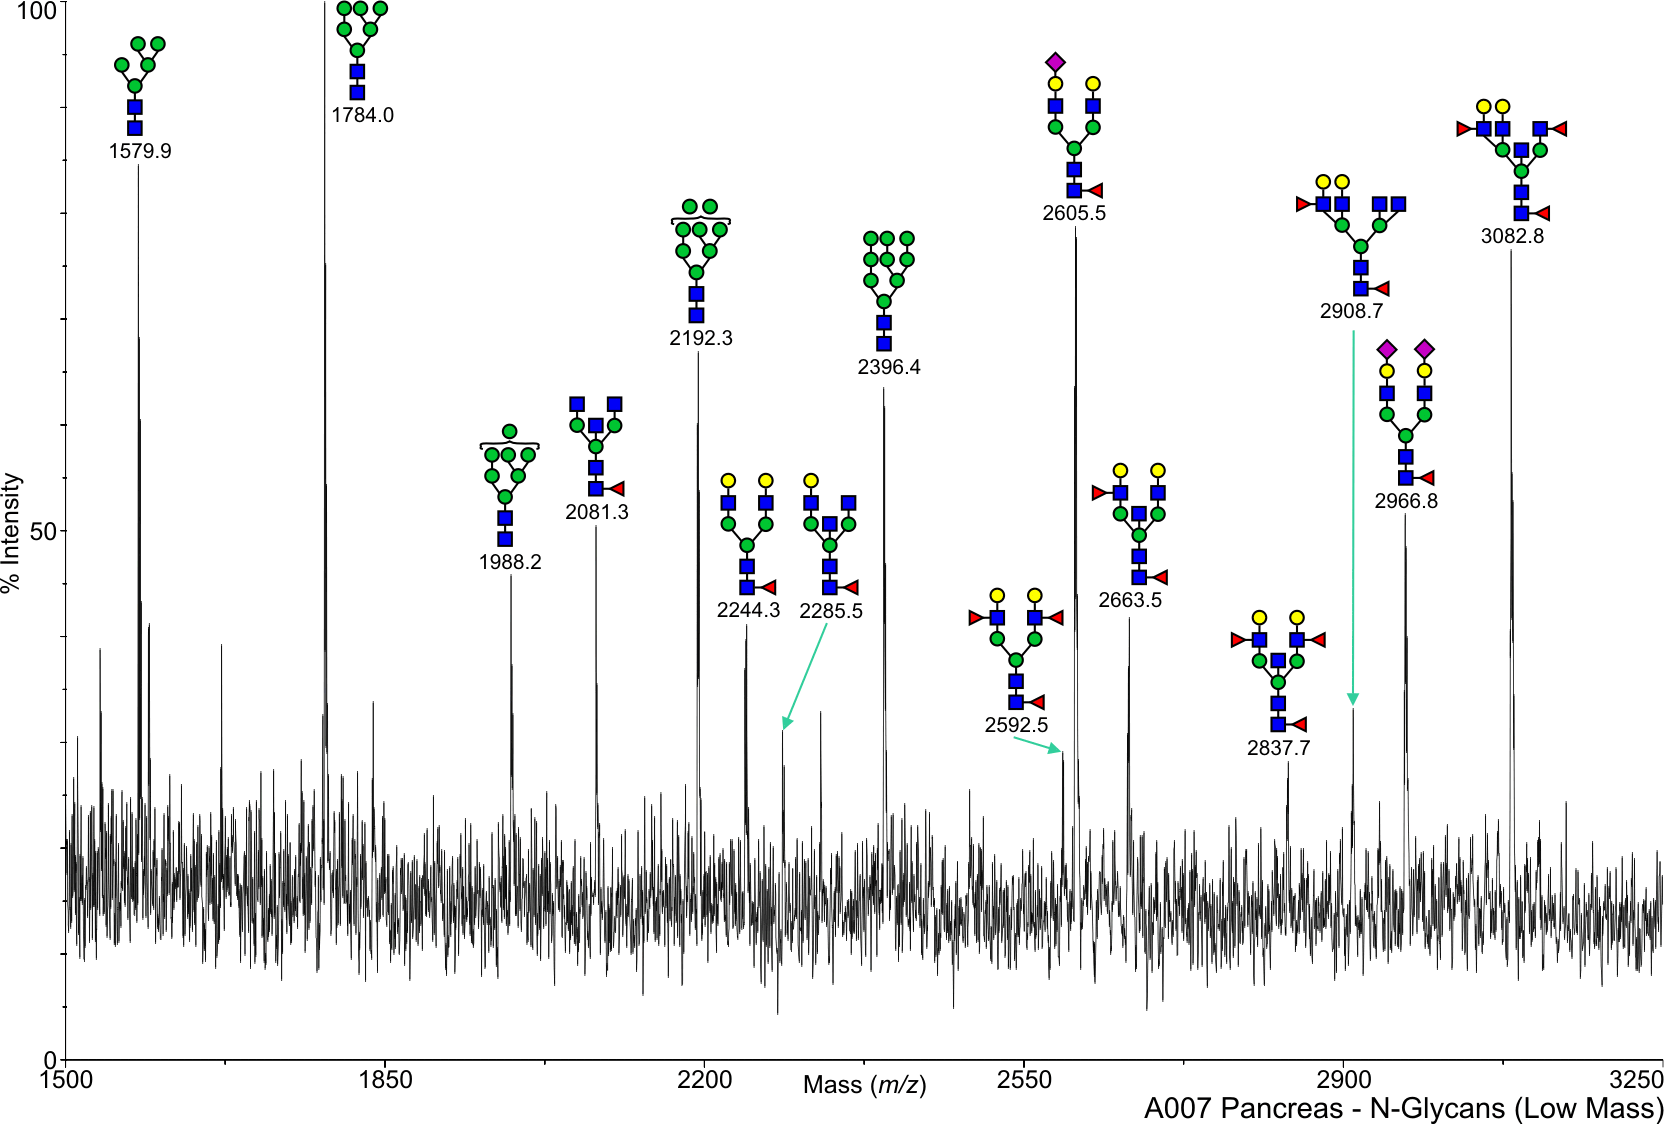
Human Pancreas N-Linked A007 Salomon,Daniel View experimental details      
Annotated file for lower mass range in JPG formatAnnotated file for higher mass range in JPG format Annotated file for lower mass range in PDF formatAnnotated file for higher mass range in PDF format
View Mass Spectrum data as text View Mass Peak file   Interactive Mass Spectrum Viewer
cfg_rRequest_1691
Human Pancreas N-Linked P004a Salomon,Daniel View experimental details      
   
       
cfg_rRequest_1691
Human Pancreas O-Linked 204151 Salomon,Daniel View experimental details      
   
       
cfg_rRequest_1691
Human Pancreas O-Linked A002 Salomon,Daniel View experimental details      
   
       
cfg_rRequest_1691
Human Pancreas O-Linked A004 Salomon,Daniel View experimental details      
   
       
cfg_rRequest_1691
Human Pancreas O-Linked A006a Salomon,Daniel View experimental details      
Annotated file in JPG format Annotated file in PDF format
       
cfg_rRequest_1691
Human Pancreas O-Linked A007 Salomon,Daniel View experimental details      
   
View Mass Spectrum data as text      
cfg_rRequest_1691
Human Pancreas O-Linked P004a Salomon,Daniel View experimental details      
   
       
cfg_rRequest_1691
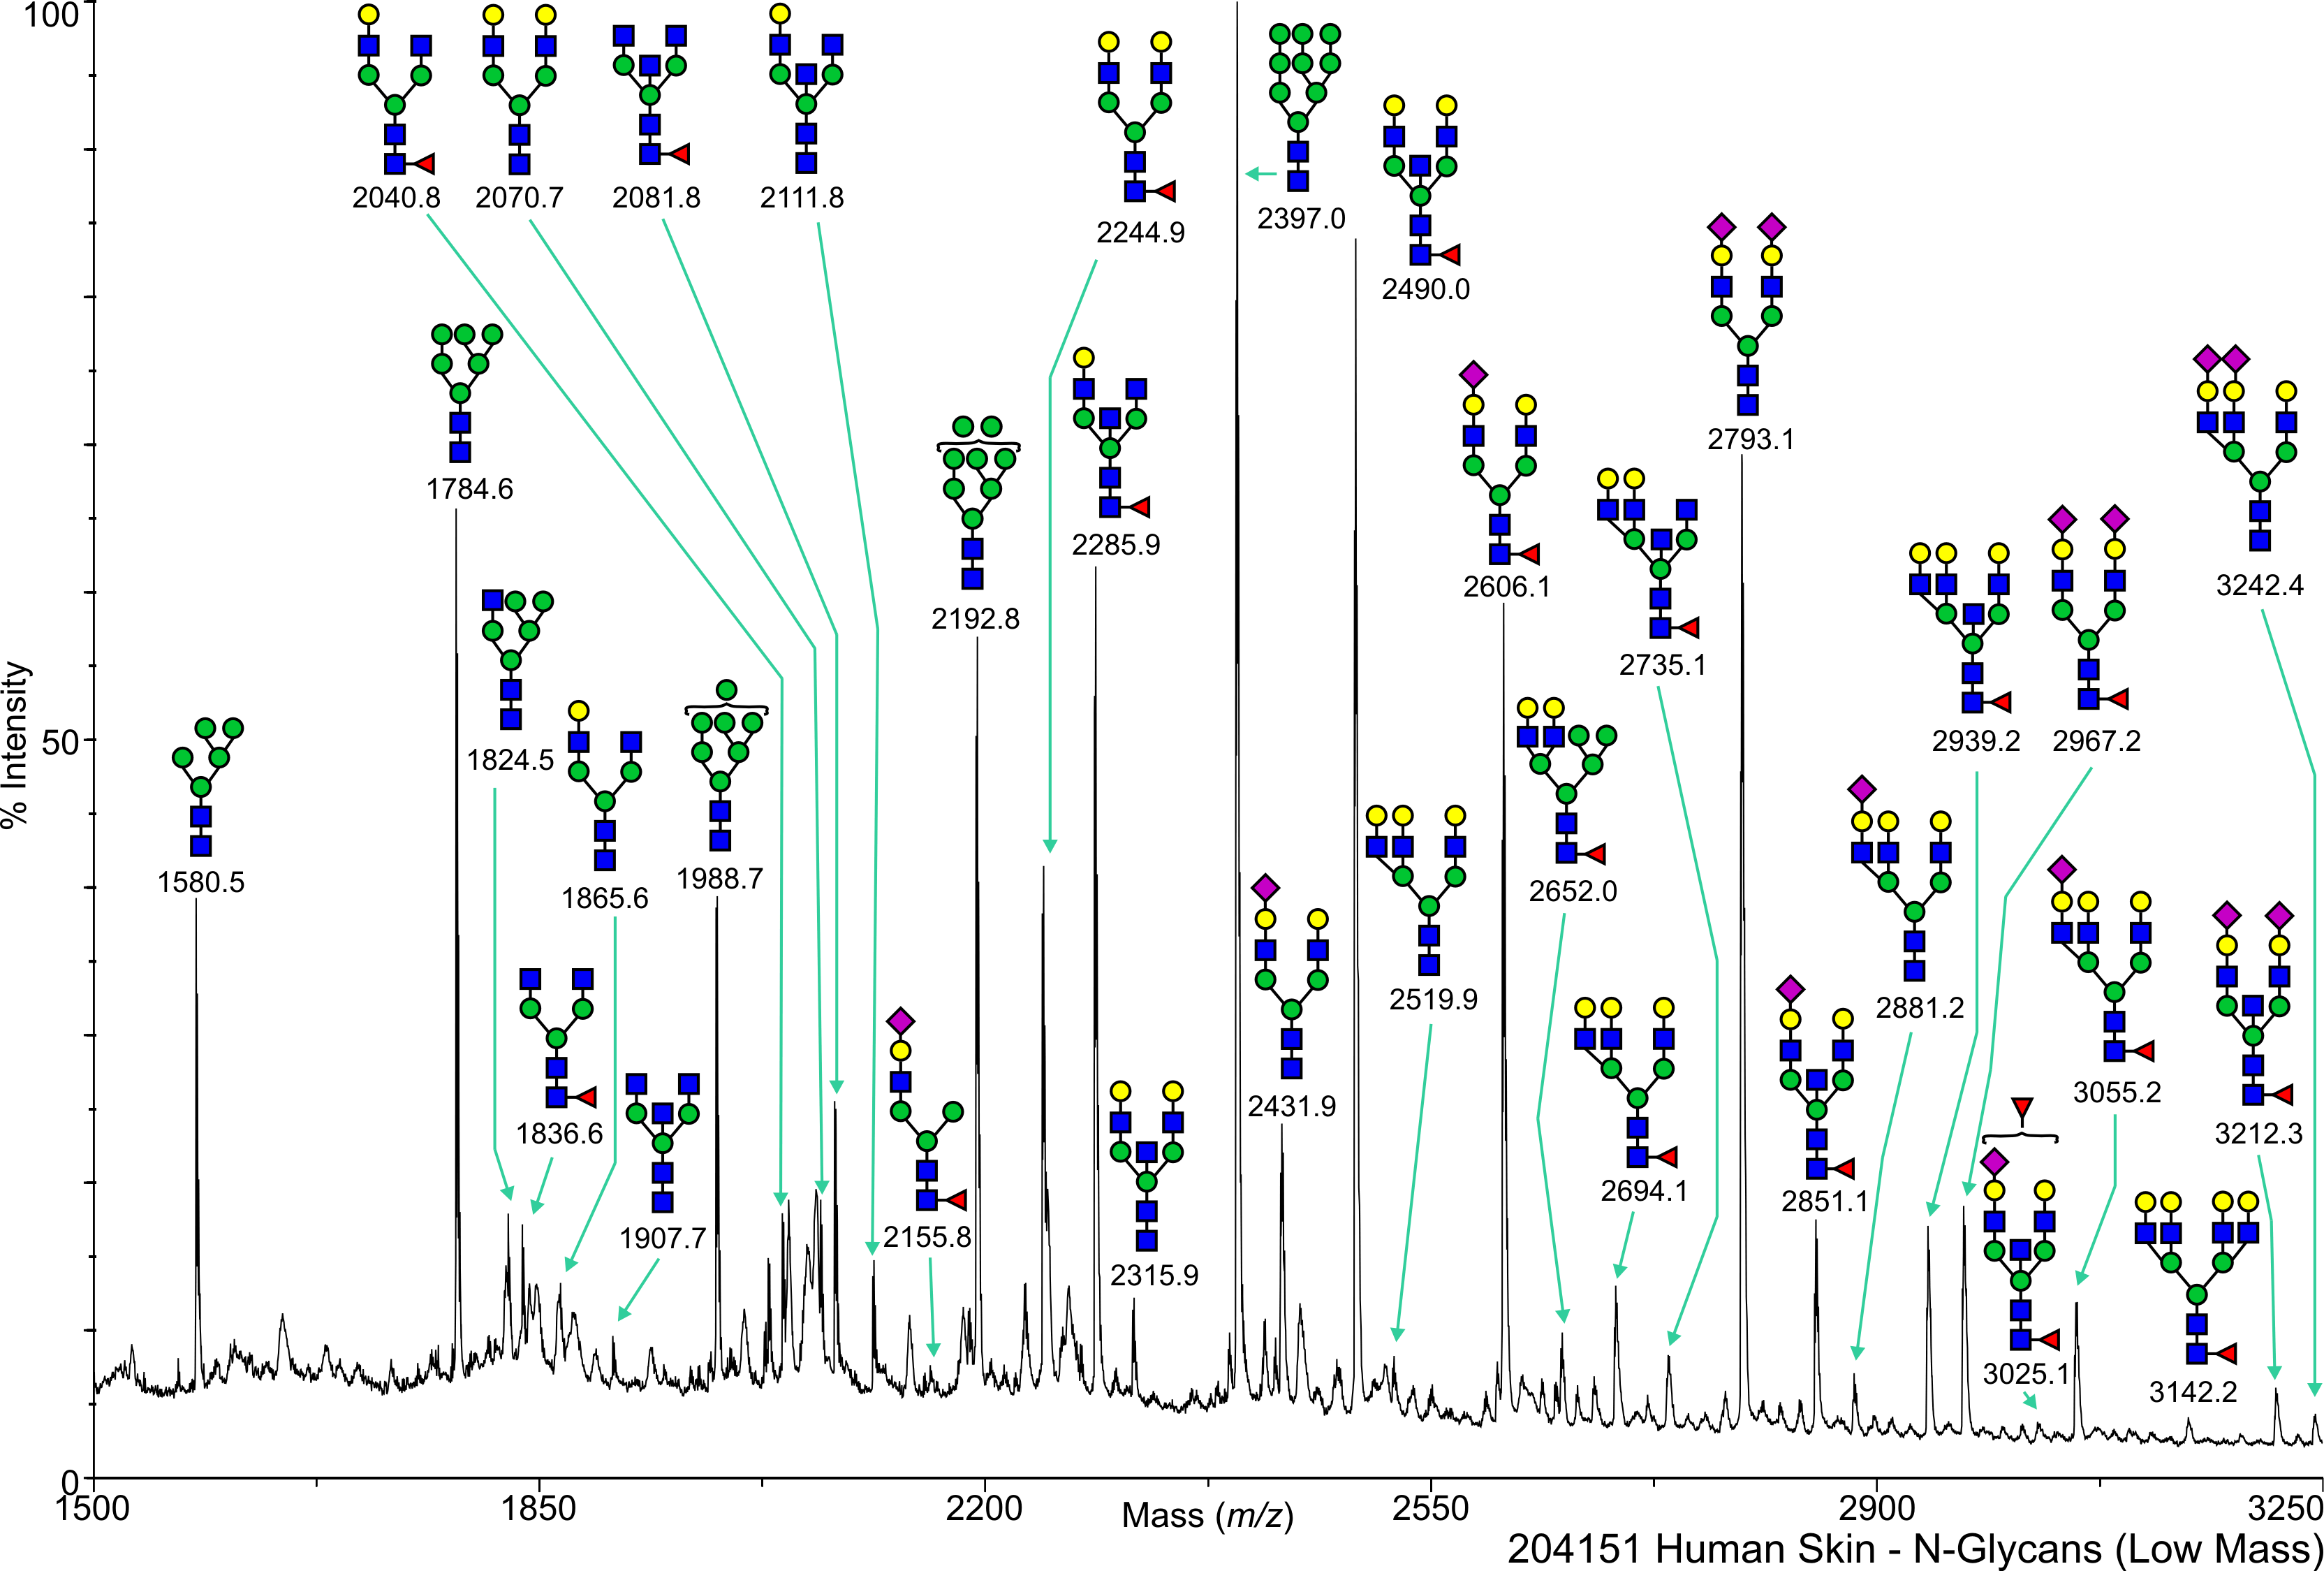
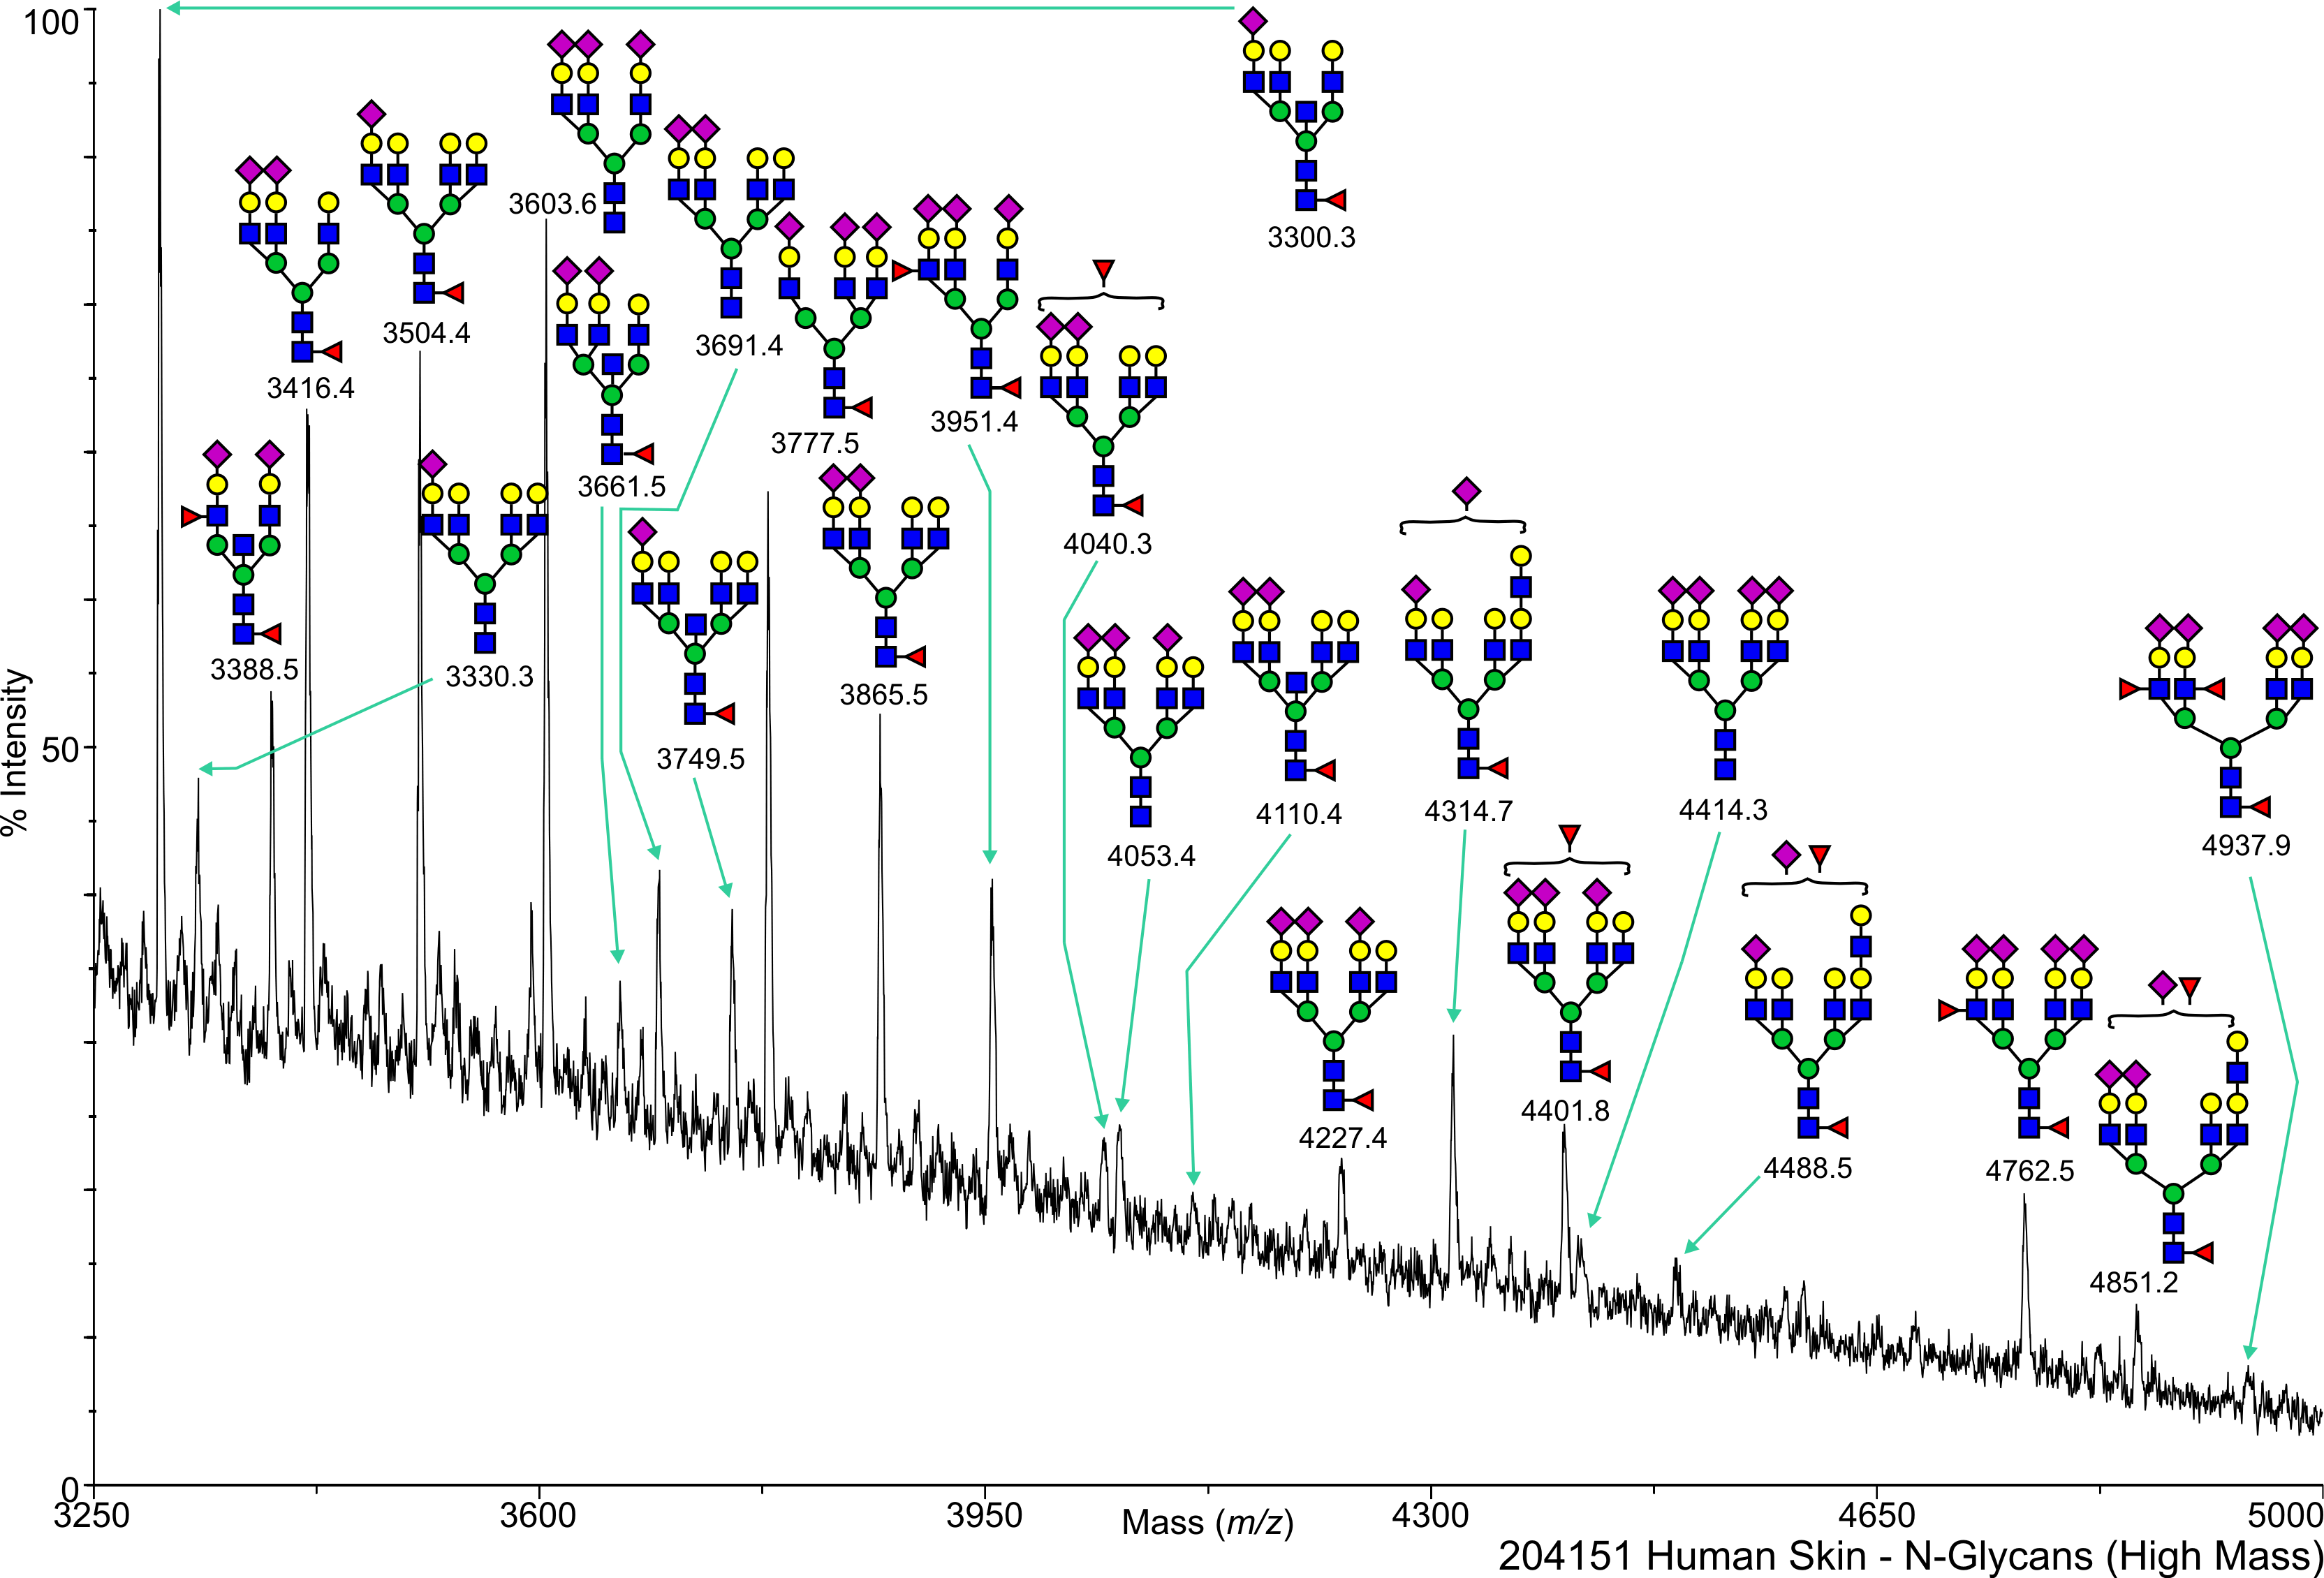
Human Skin N-Linked 204151 Salomon,Daniel View experimental details      
Annotated file for lower mass range in JPG formatAnnotated file for higher mass range in JPG format Annotated file for lower mass range in PDF formatAnnotated file for higher mass range in PDF format
         
cfg_rRequest_1691
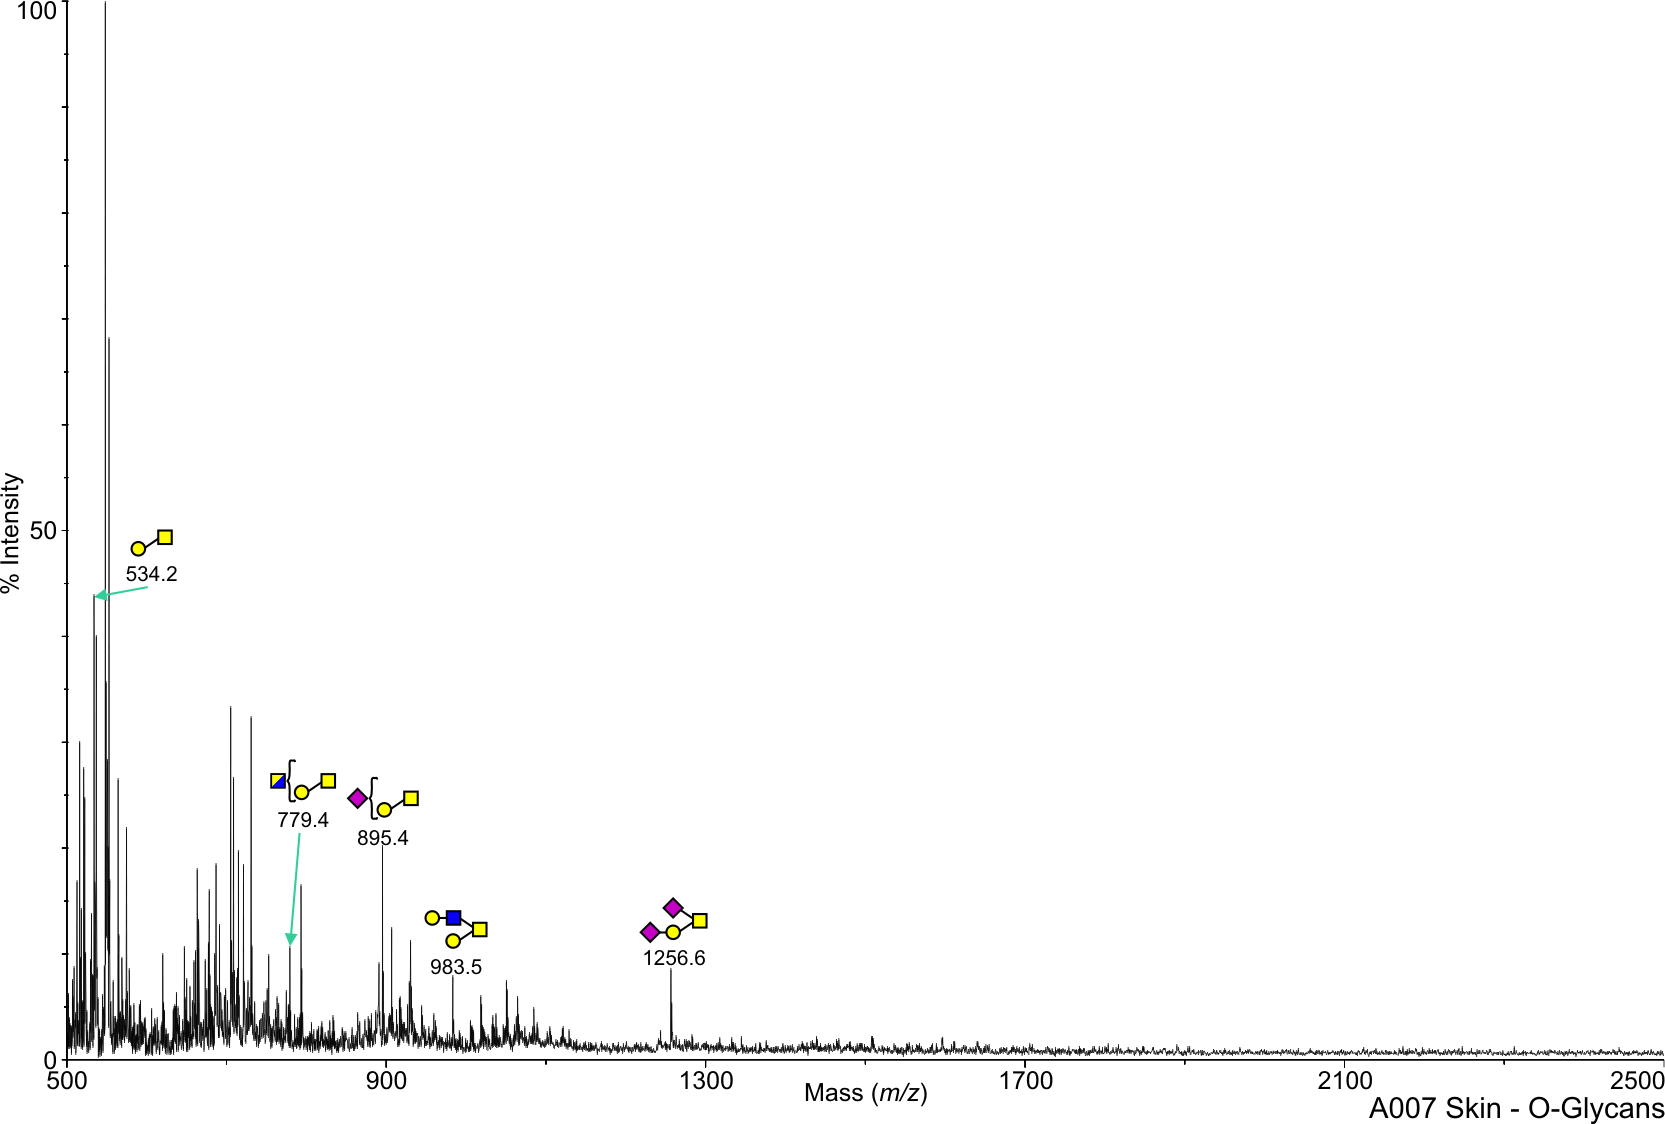
Human Skin N-Linked A007 Salomon,Daniel View experimental details      
Annotated file for lower mass range in JPG formatAnnotated file for higher mass range in JPG format Annotated file for lower mass range in PDF formatAnnotated file for higher mass range in PDF format
View Mass Spectrum data as text View Mass Peak file   Interactive Mass Spectrum Viewer
cfg_rRequest_1691
Human Skin N-Linked A008 Salomon,Daniel View experimental details      
Annotated file for lower mass range in JPG formatAnnotated file for higher mass range in JPG format Annotated file for lower mass range in PDF formatAnnotated file for higher mass range in PDF format
View Mass Spectrum data as text View Mass Peak file   Interactive Mass Spectrum Viewer
cfg_rRequest_1691
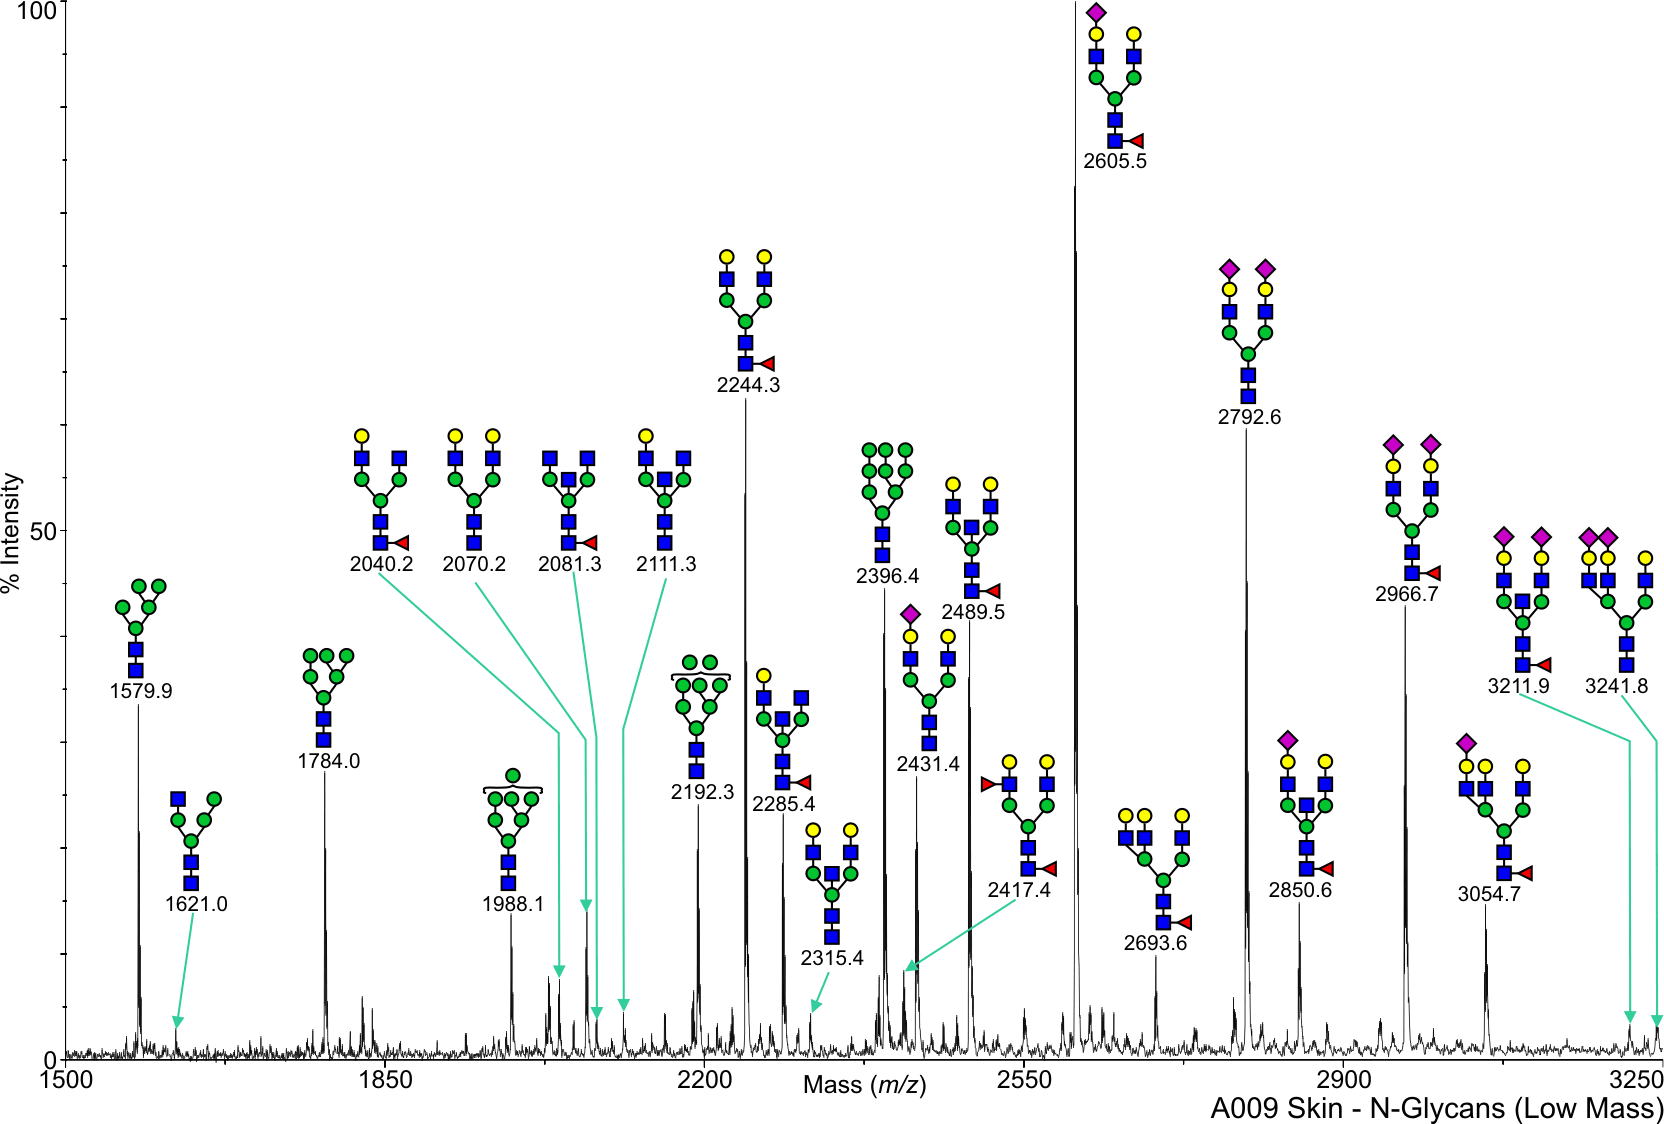
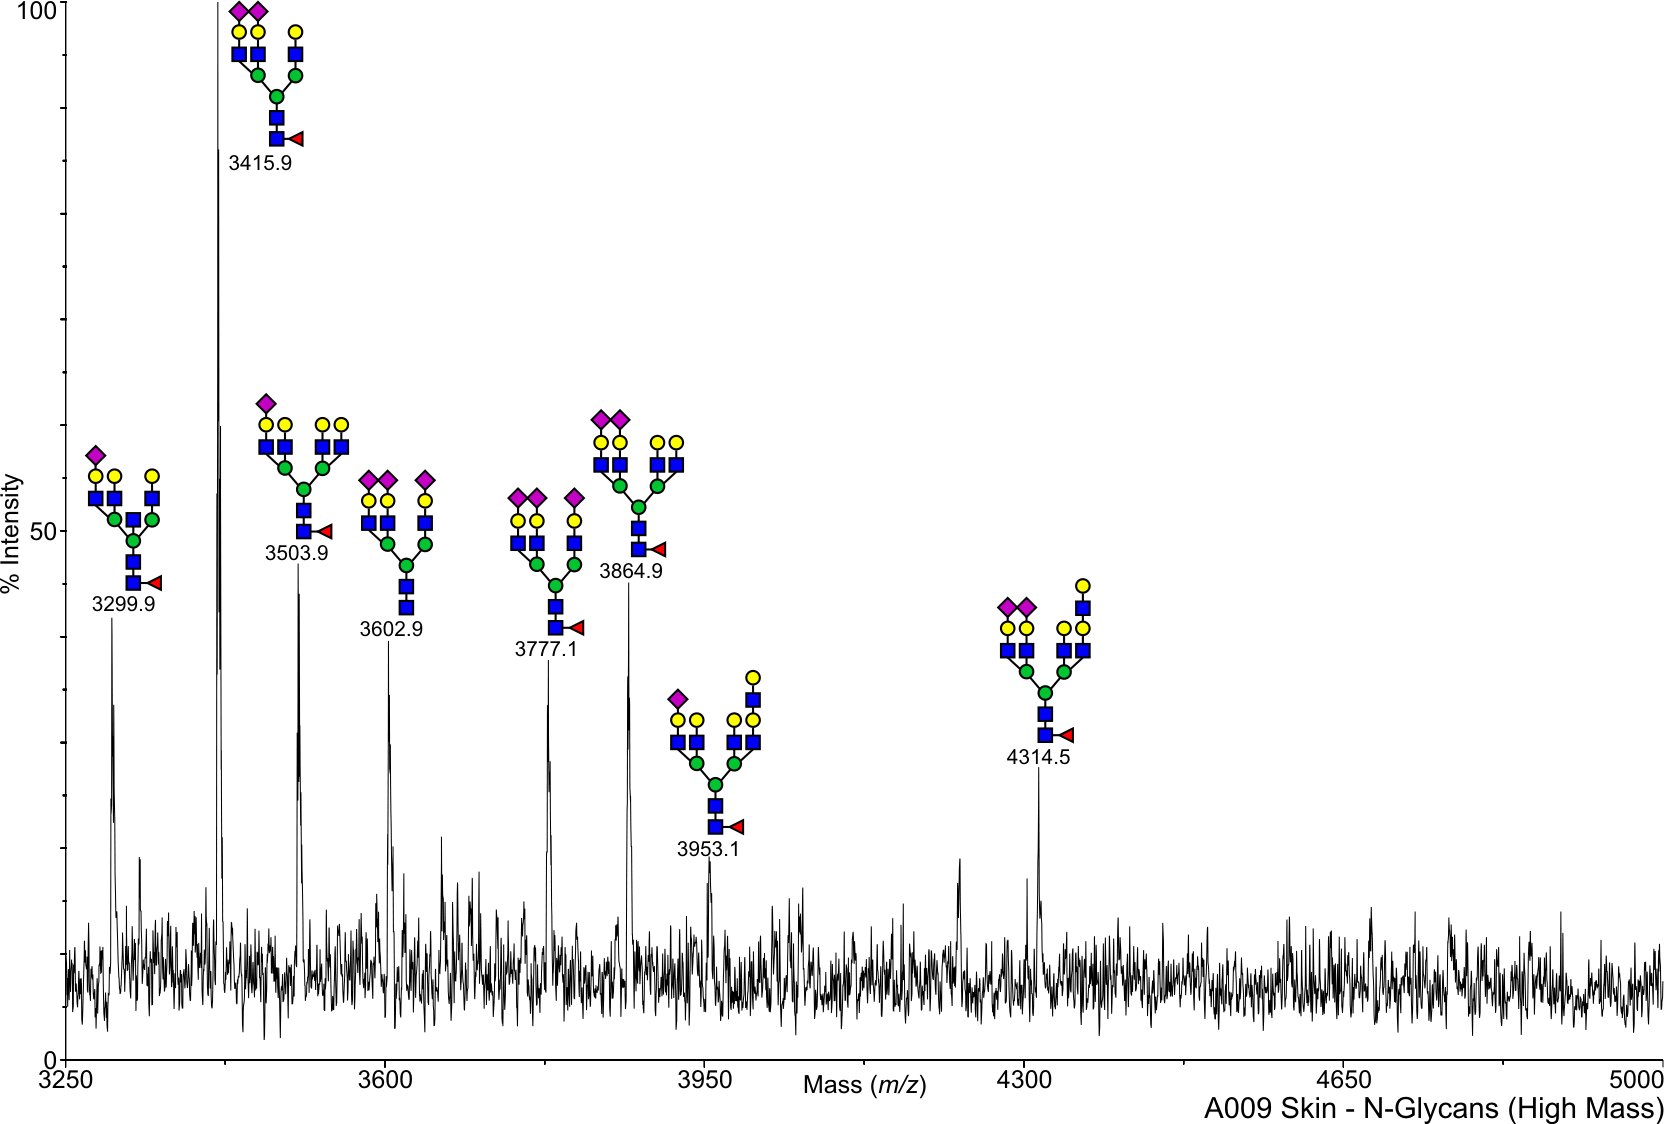
Human Skin N-Linked A009 Salomon,Daniel View experimental details      
Annotated file for lower mass range in JPG formatAnnotated file for higher mass range in JPG format Annotated file for lower mass range in PDF formatAnnotated file for higher mass range in PDF format
View Mass Spectrum data as text View Mass Peak file   Interactive Mass Spectrum Viewer
cfg_rRequest_1691
Human Skin O-Linked A007 Salomon,Daniel View experimental details      
Annotated file in JPG format Annotated file in PDF format
View Mass Spectrum data as text View Mass Peak file   Interactive Mass Spectrum Viewer
cfg_rRequest_1691
Human Skin O-Linked A008 Salomon,Daniel View experimental details      
   
View Mass Spectrum data as text      
cfg_rRequest_1691
Human Skin O-Linked A009 Salomon,Daniel View experimental details      
   
View Mass Spectrum data as text      
cfg_rRequest_1691
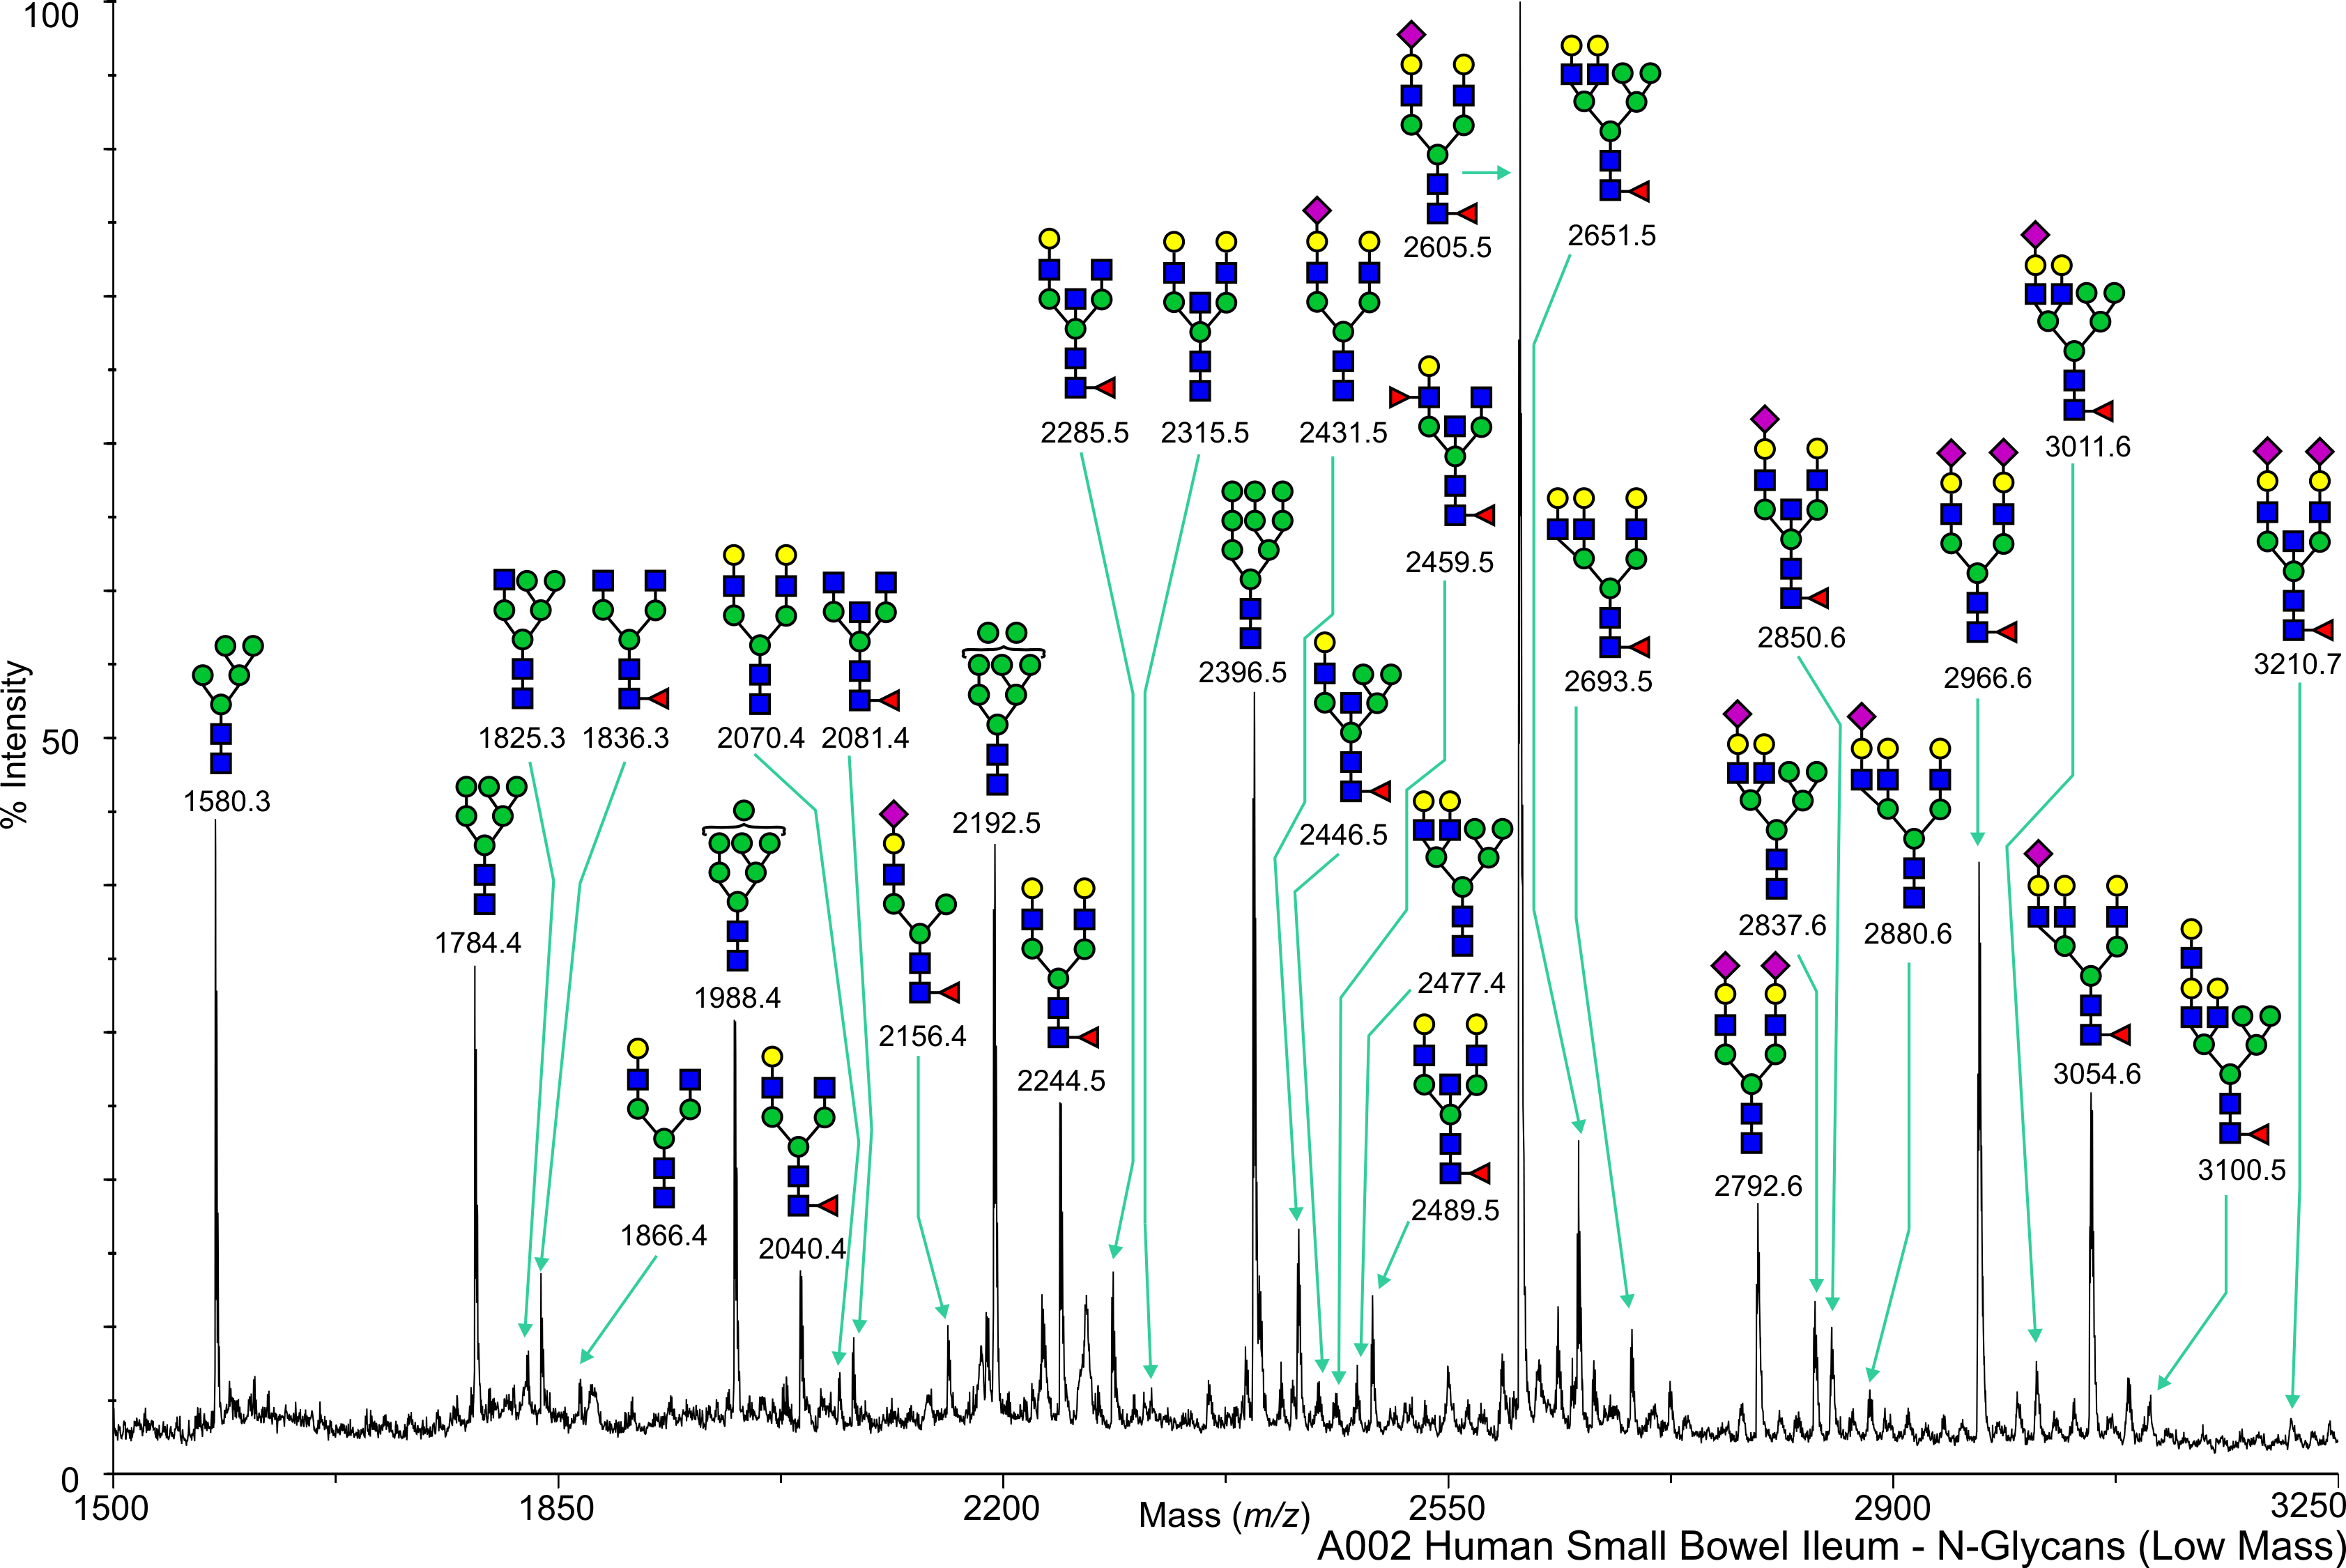
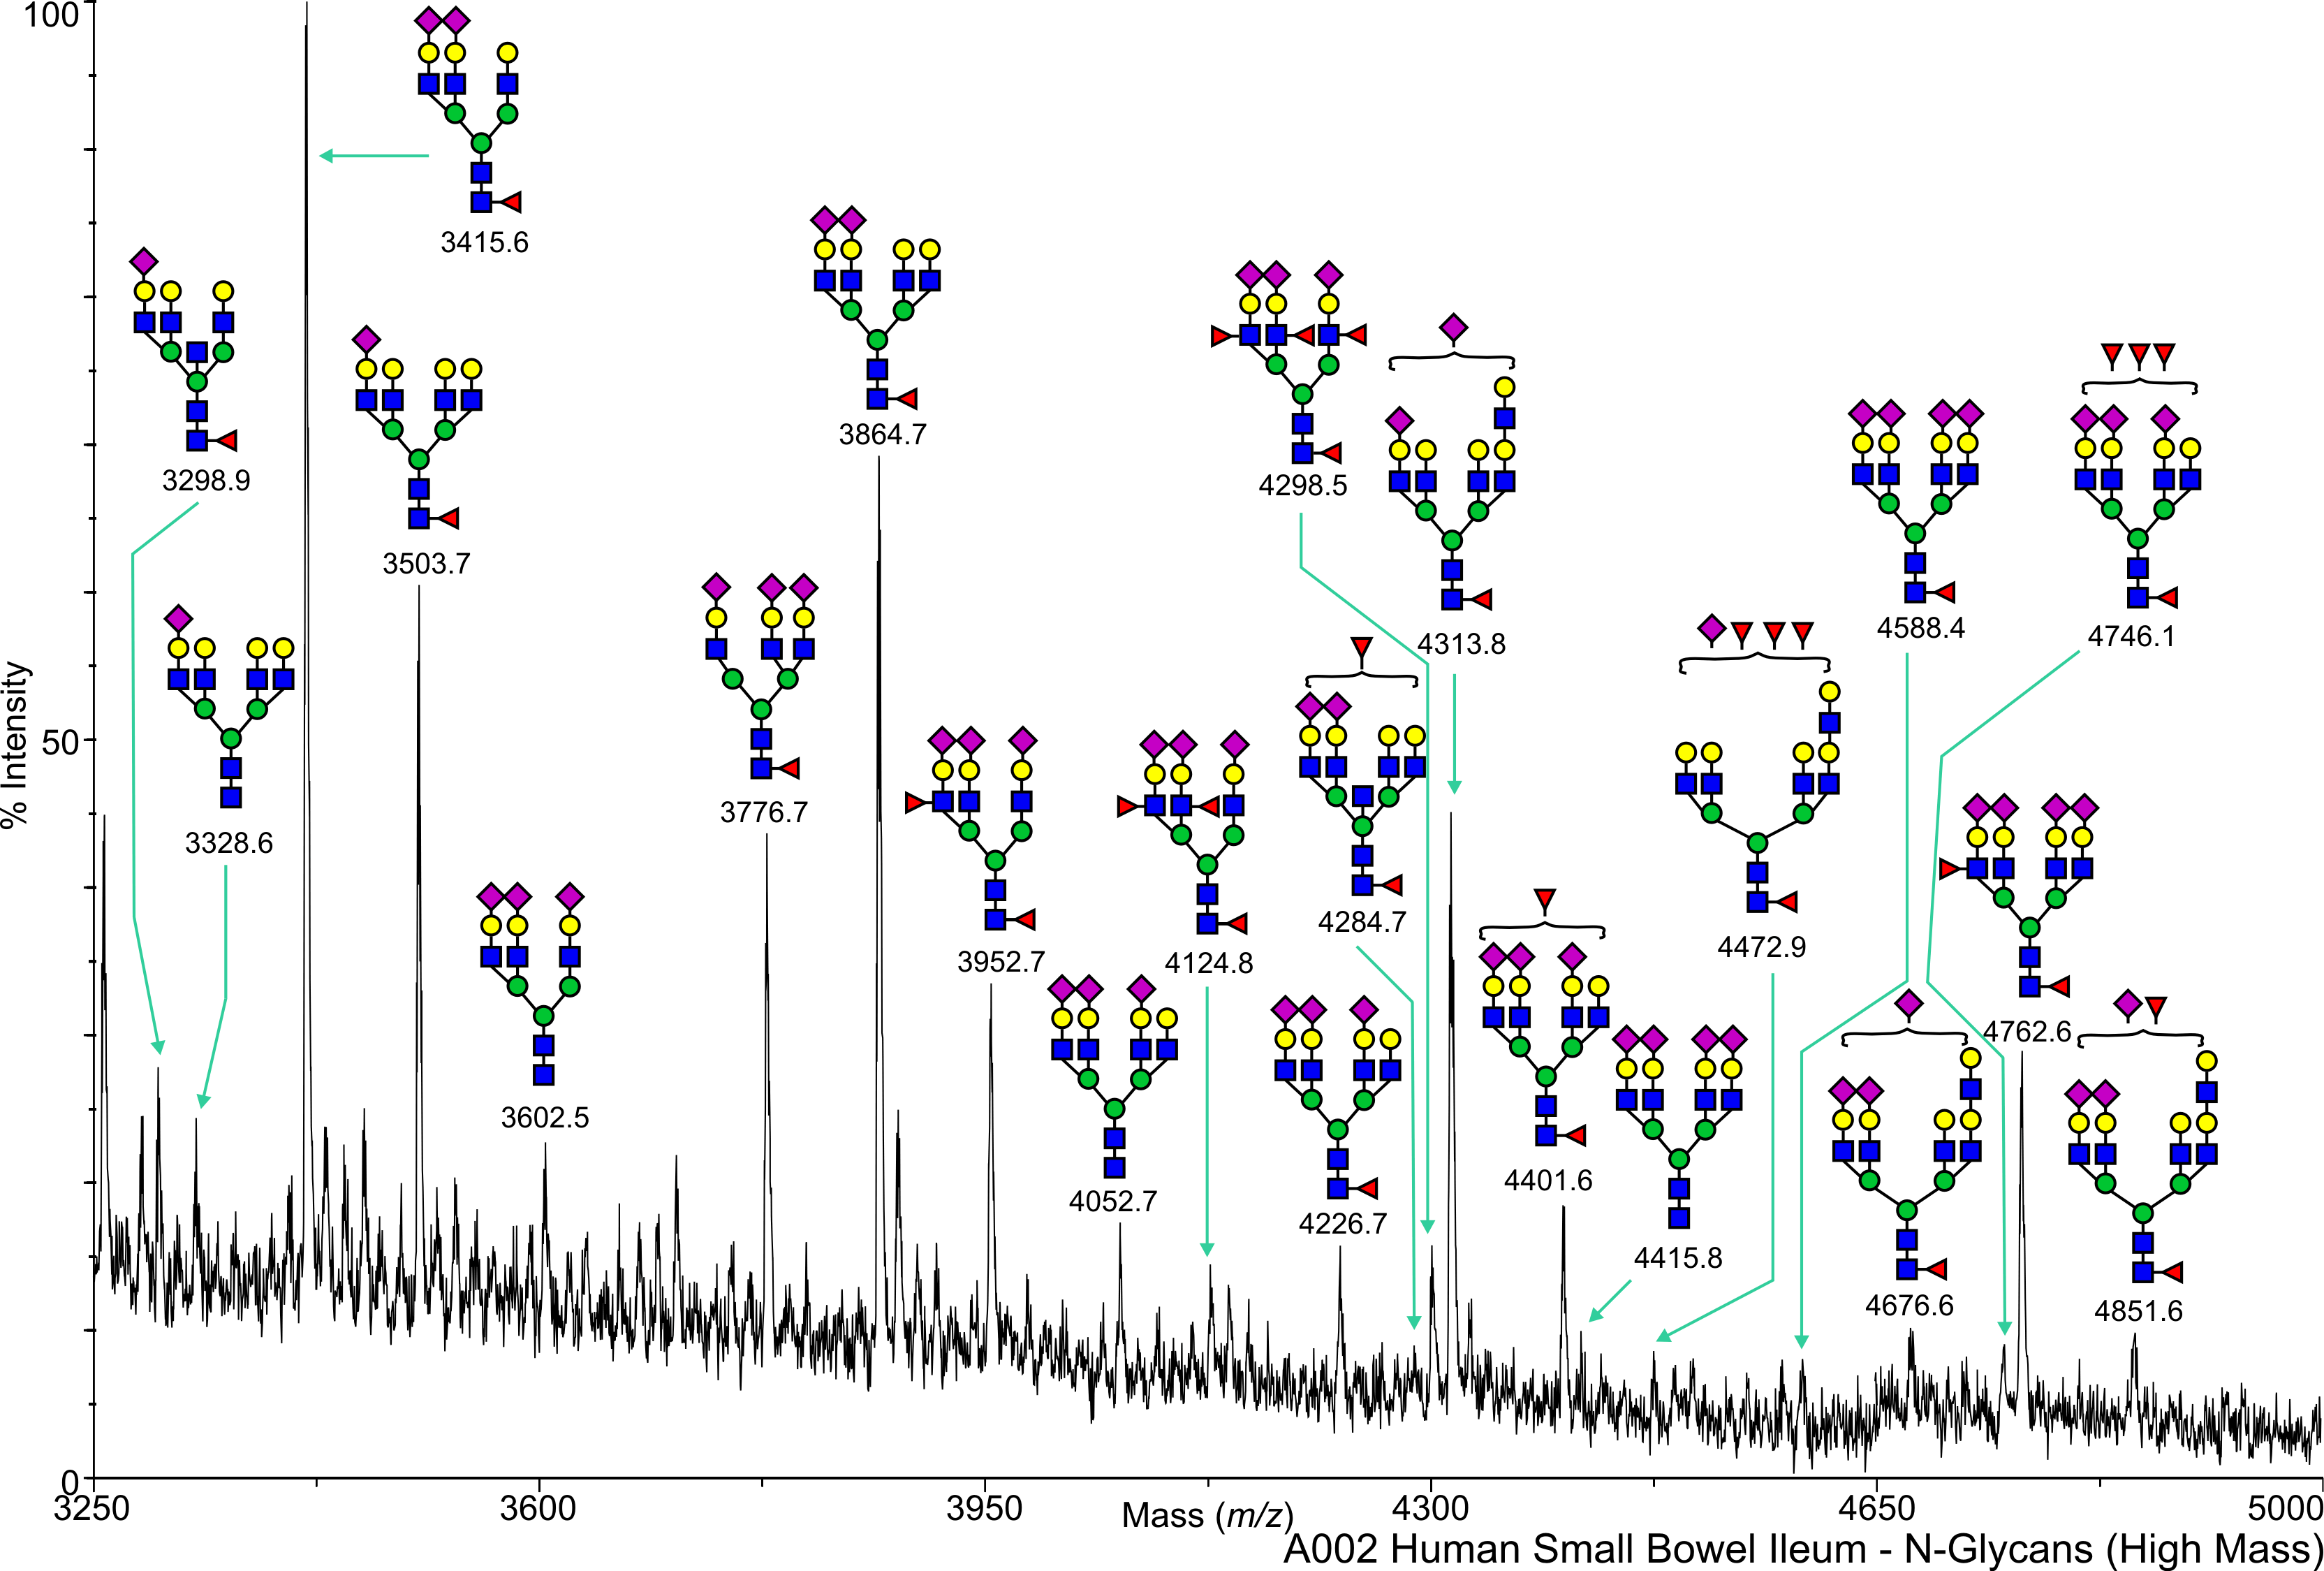
Human Small Bowel N-Linked A002 - illeum Salomon,Daniel View experimental details      
Annotated file for lower mass range in JPG formatAnnotated file for higher mass range in JPG format Annotated file for lower mass range in PDF formatAnnotated file for higher mass range in PDF format
         
cfg_rRequest_1691
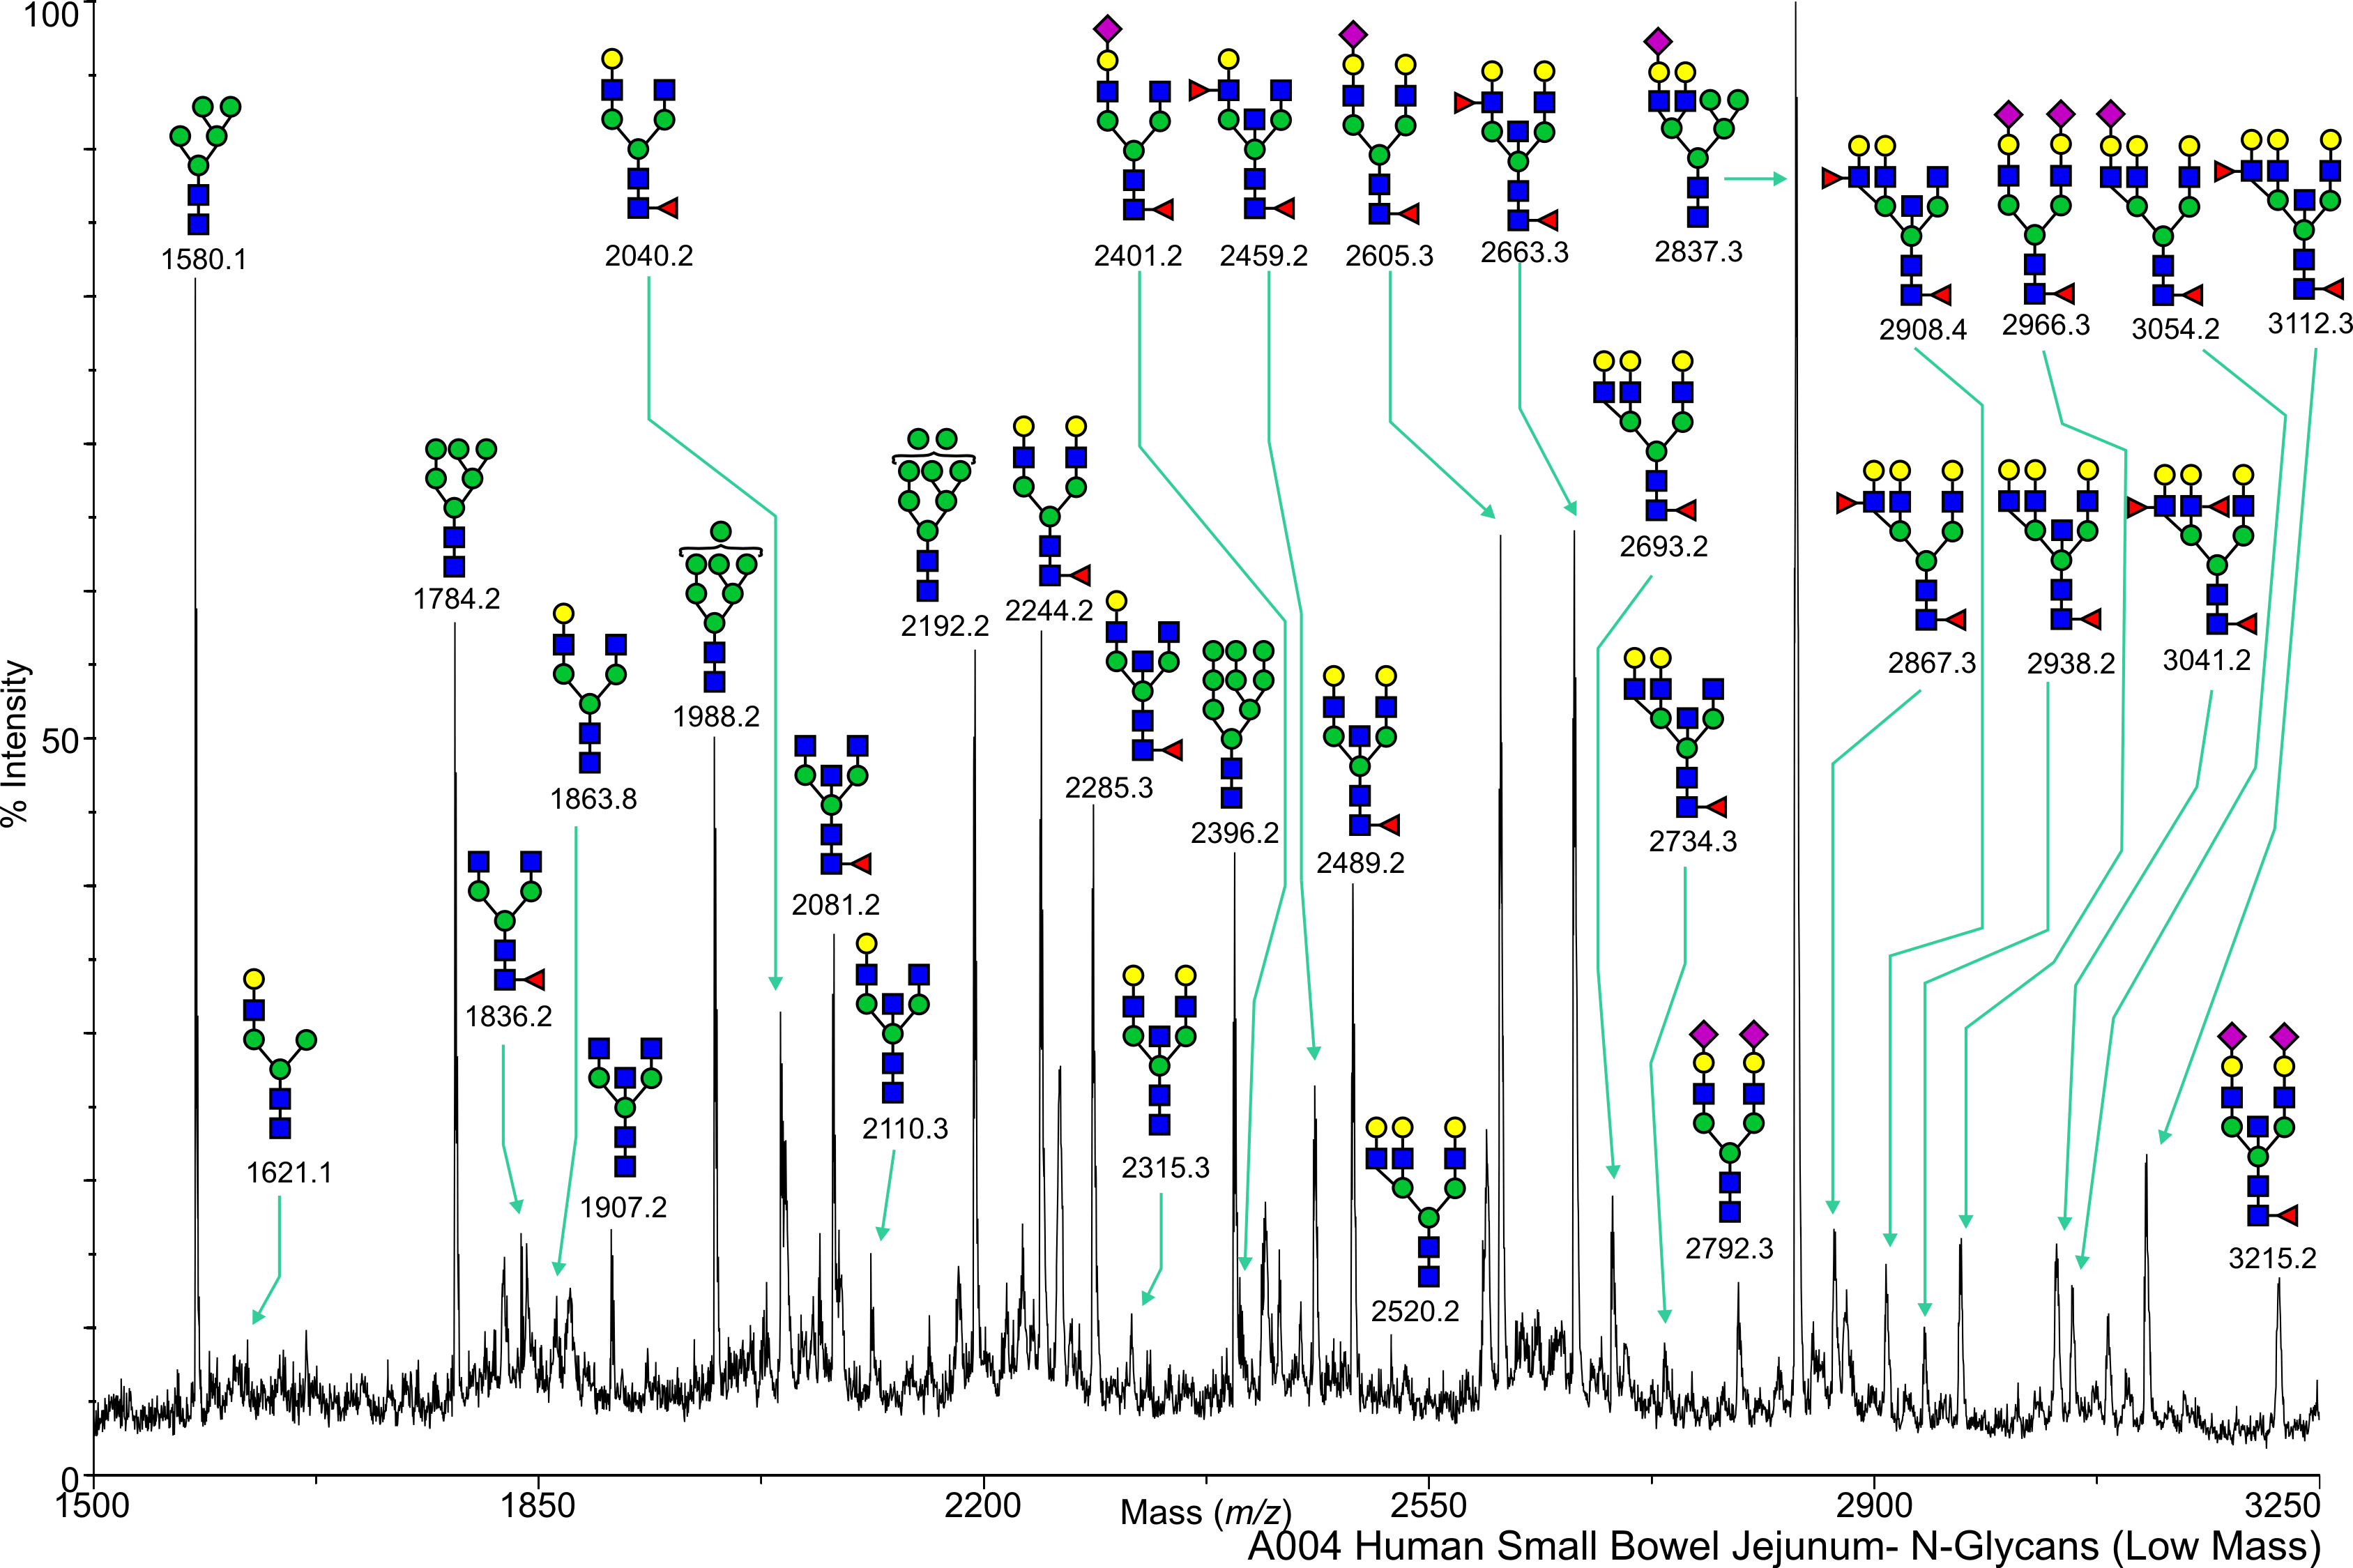
Human Small Bowel N-Linked A002 - jejunum Salomon,Daniel View experimental details      
   
         
cfg_rRequest_1691
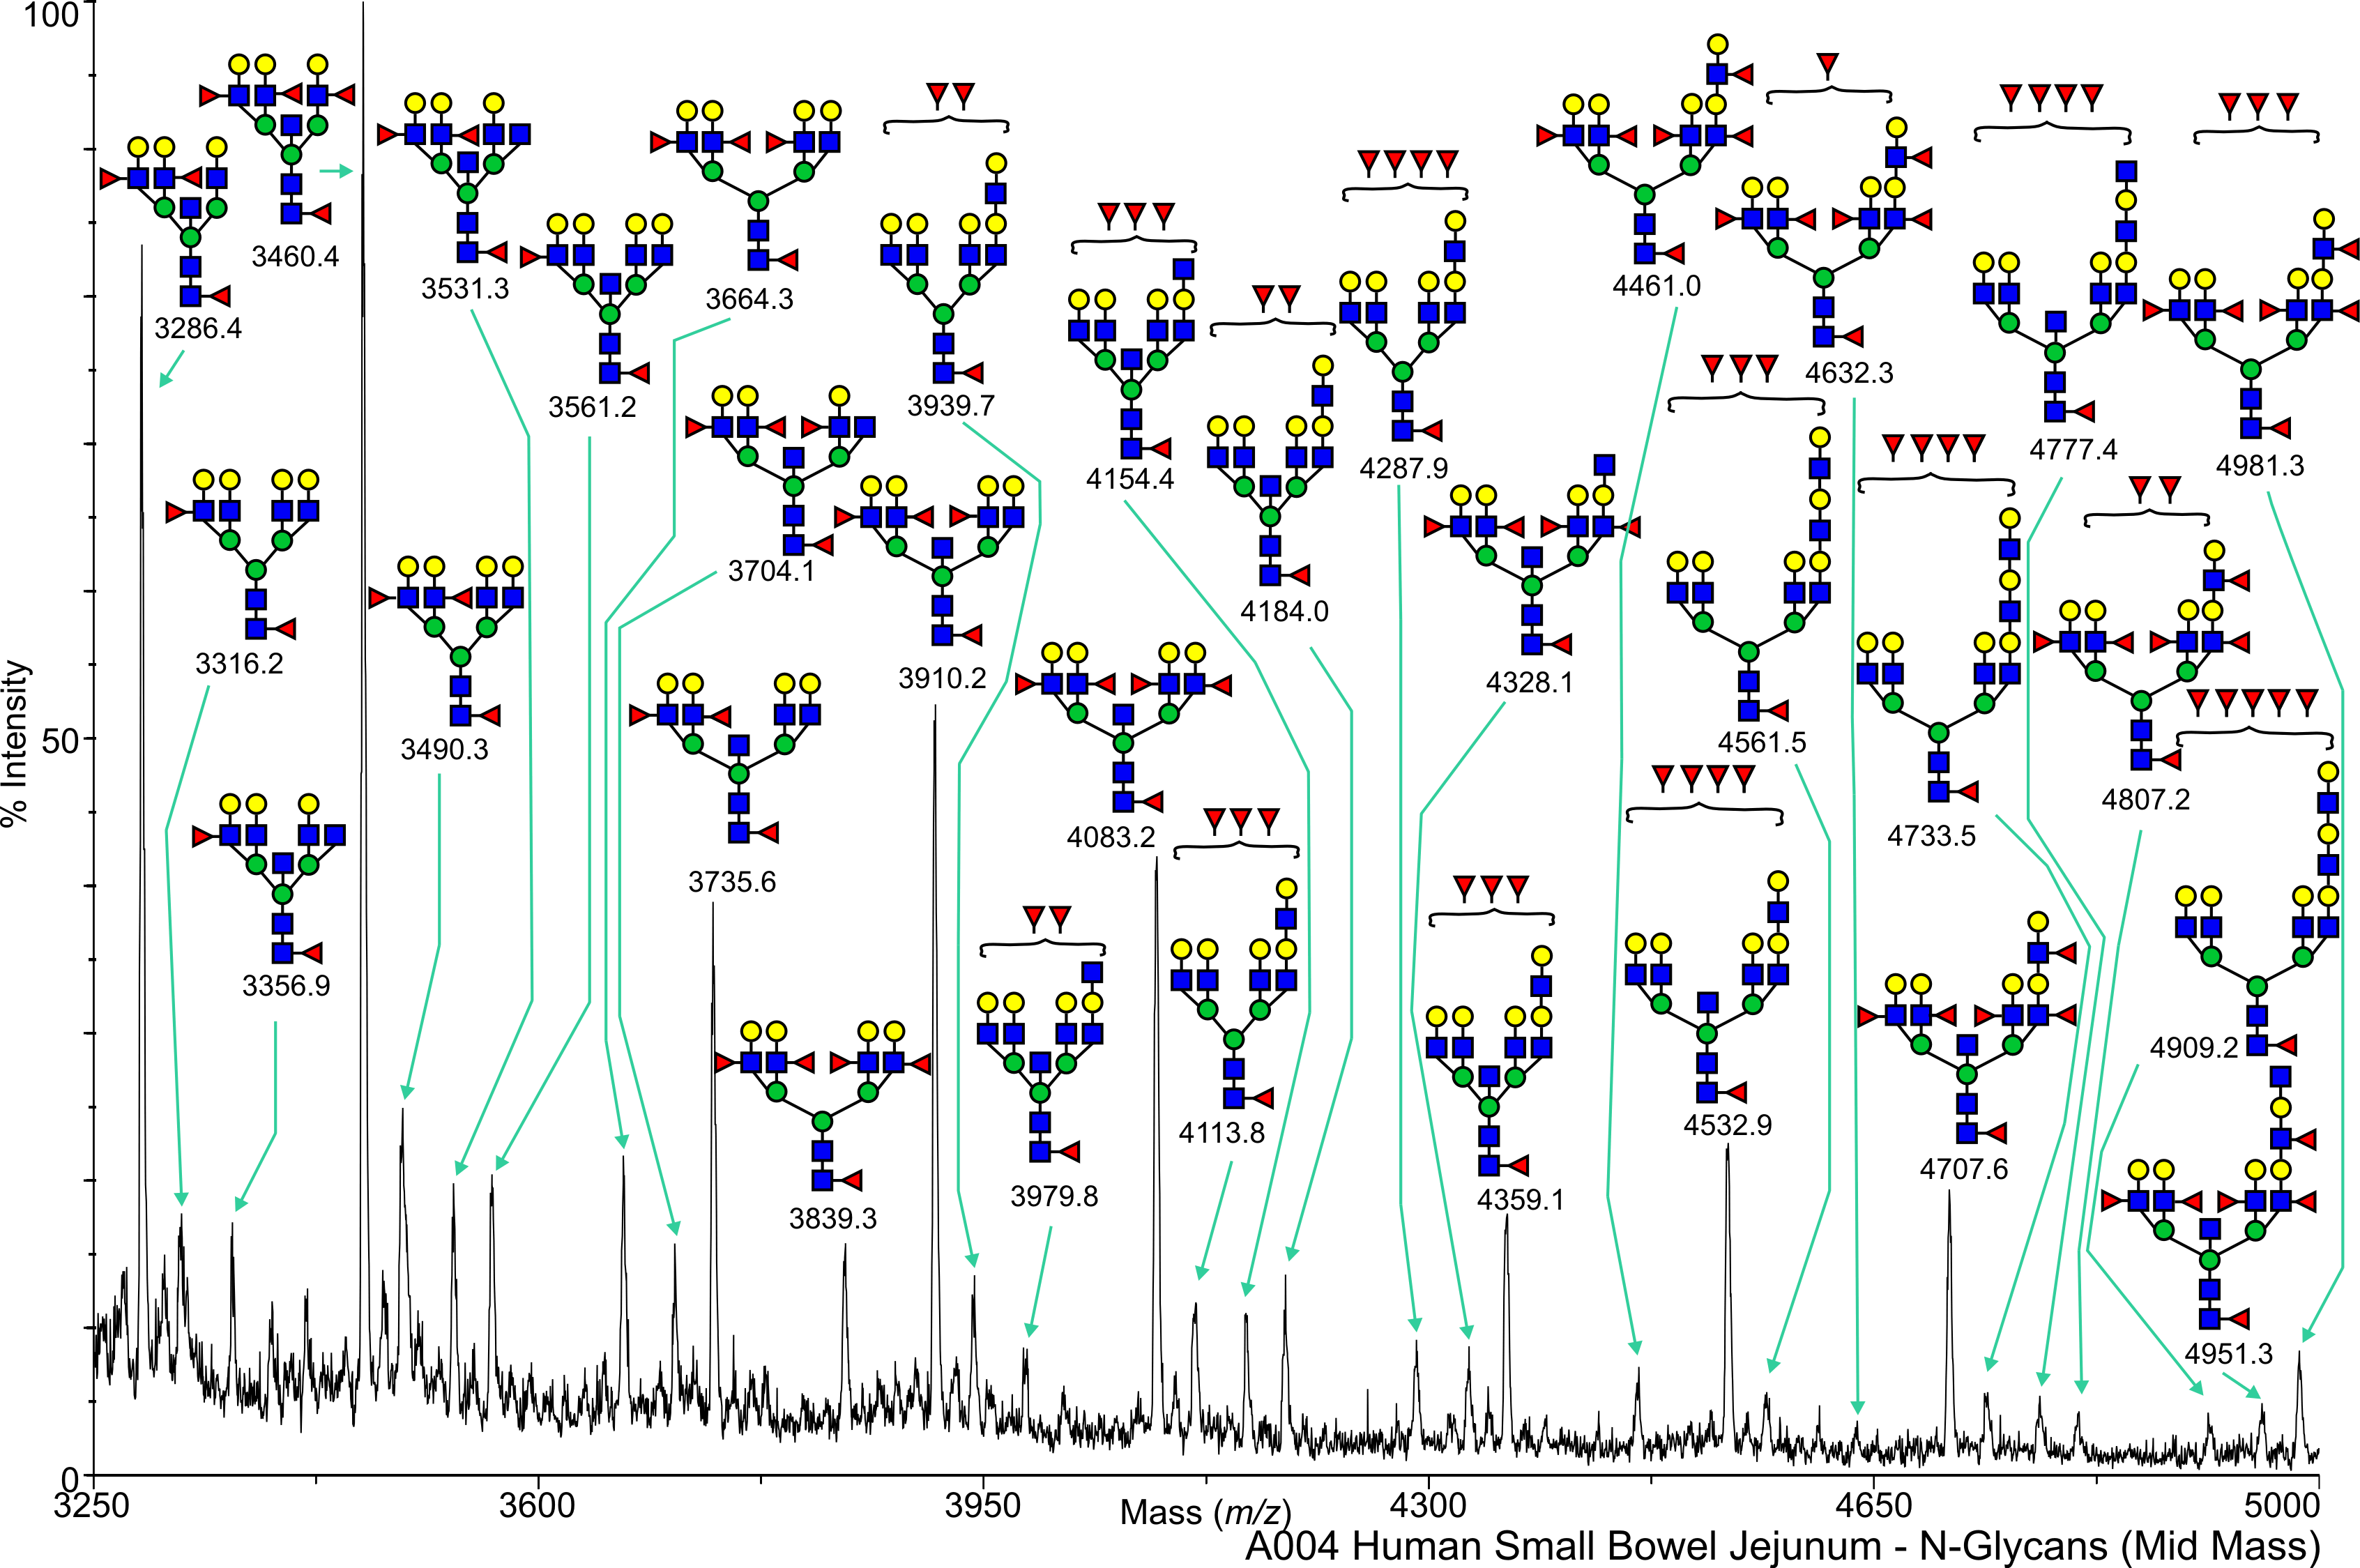
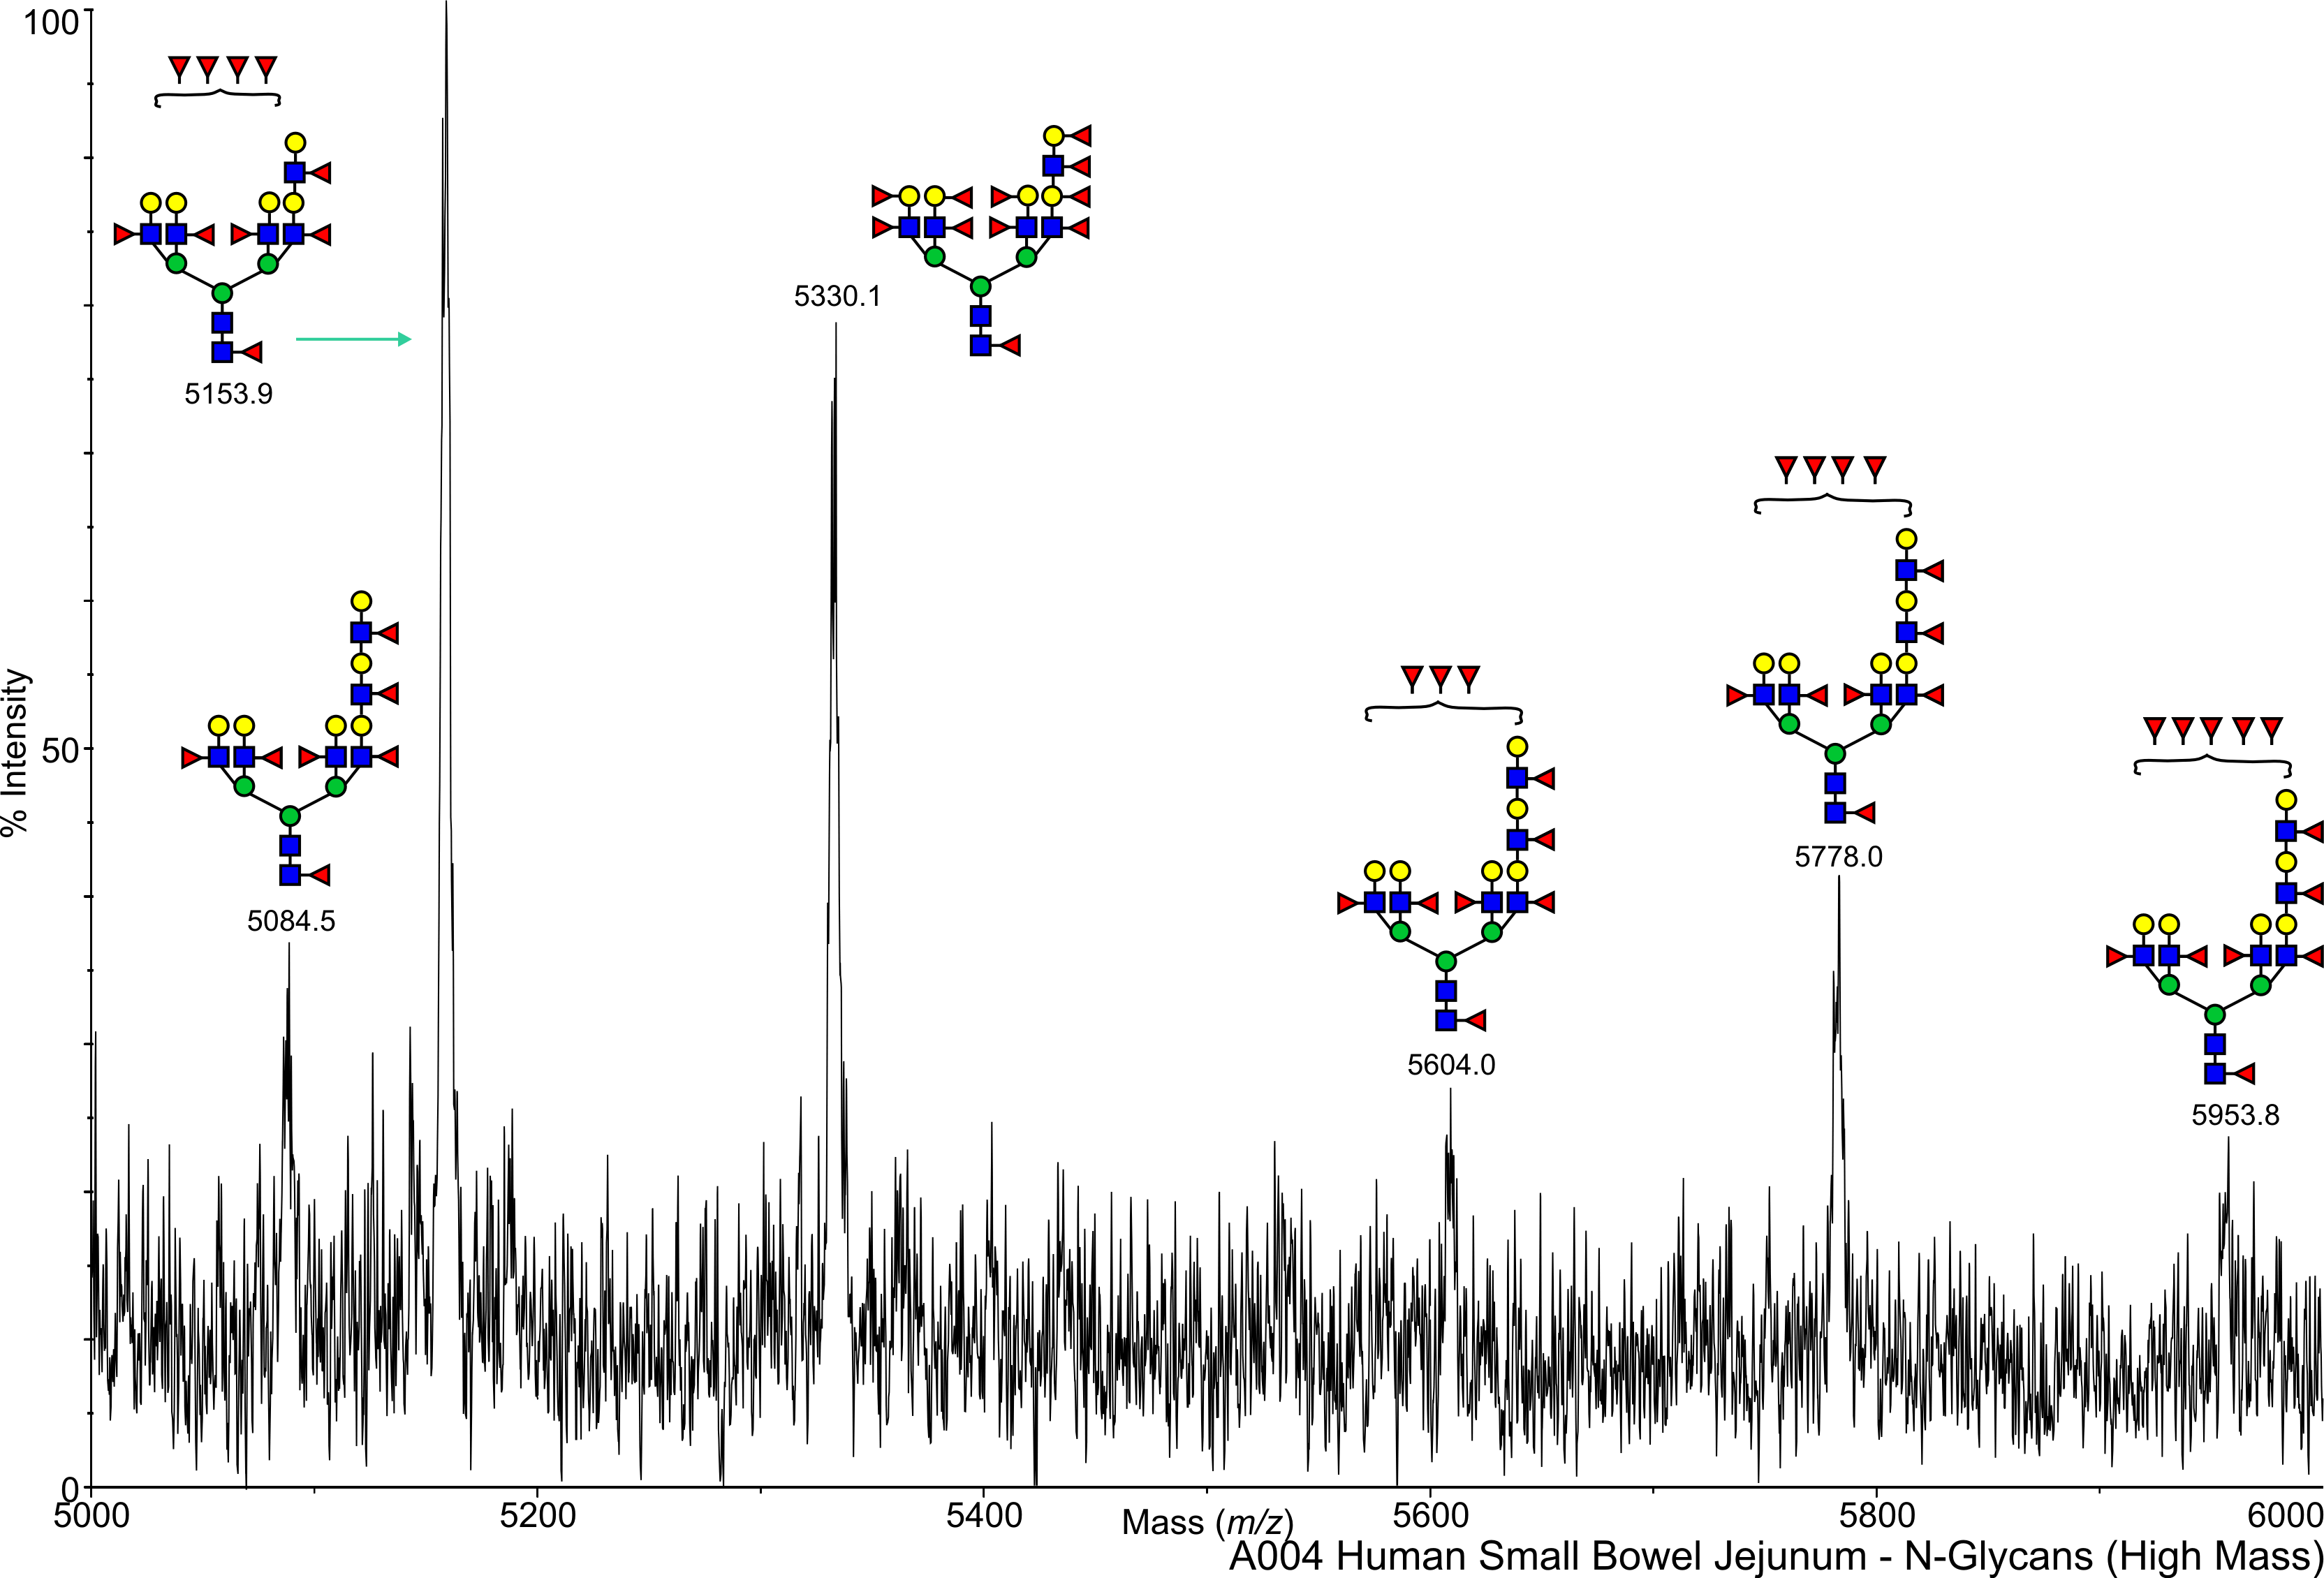
Human Small Bowel N-Linked A004 - jejunum Salomon,Daniel View experimental details      
Annotated file for lower mass range in JPG formatAnnotated file for medium mass range in JPG formatAnnotated file for high mass range in JPG format Annotated file for lower mass range in PDF formatAnnotated file for medium mass range in PDF formatAnnotated file for high mass range in PDF format
         
cfg_rRequest_1691
Human Small Bowel N-Linked A007 Salomon,Daniel View experimental details      
   
View Mass Spectrum data as text      
cfg_rRequest_1691
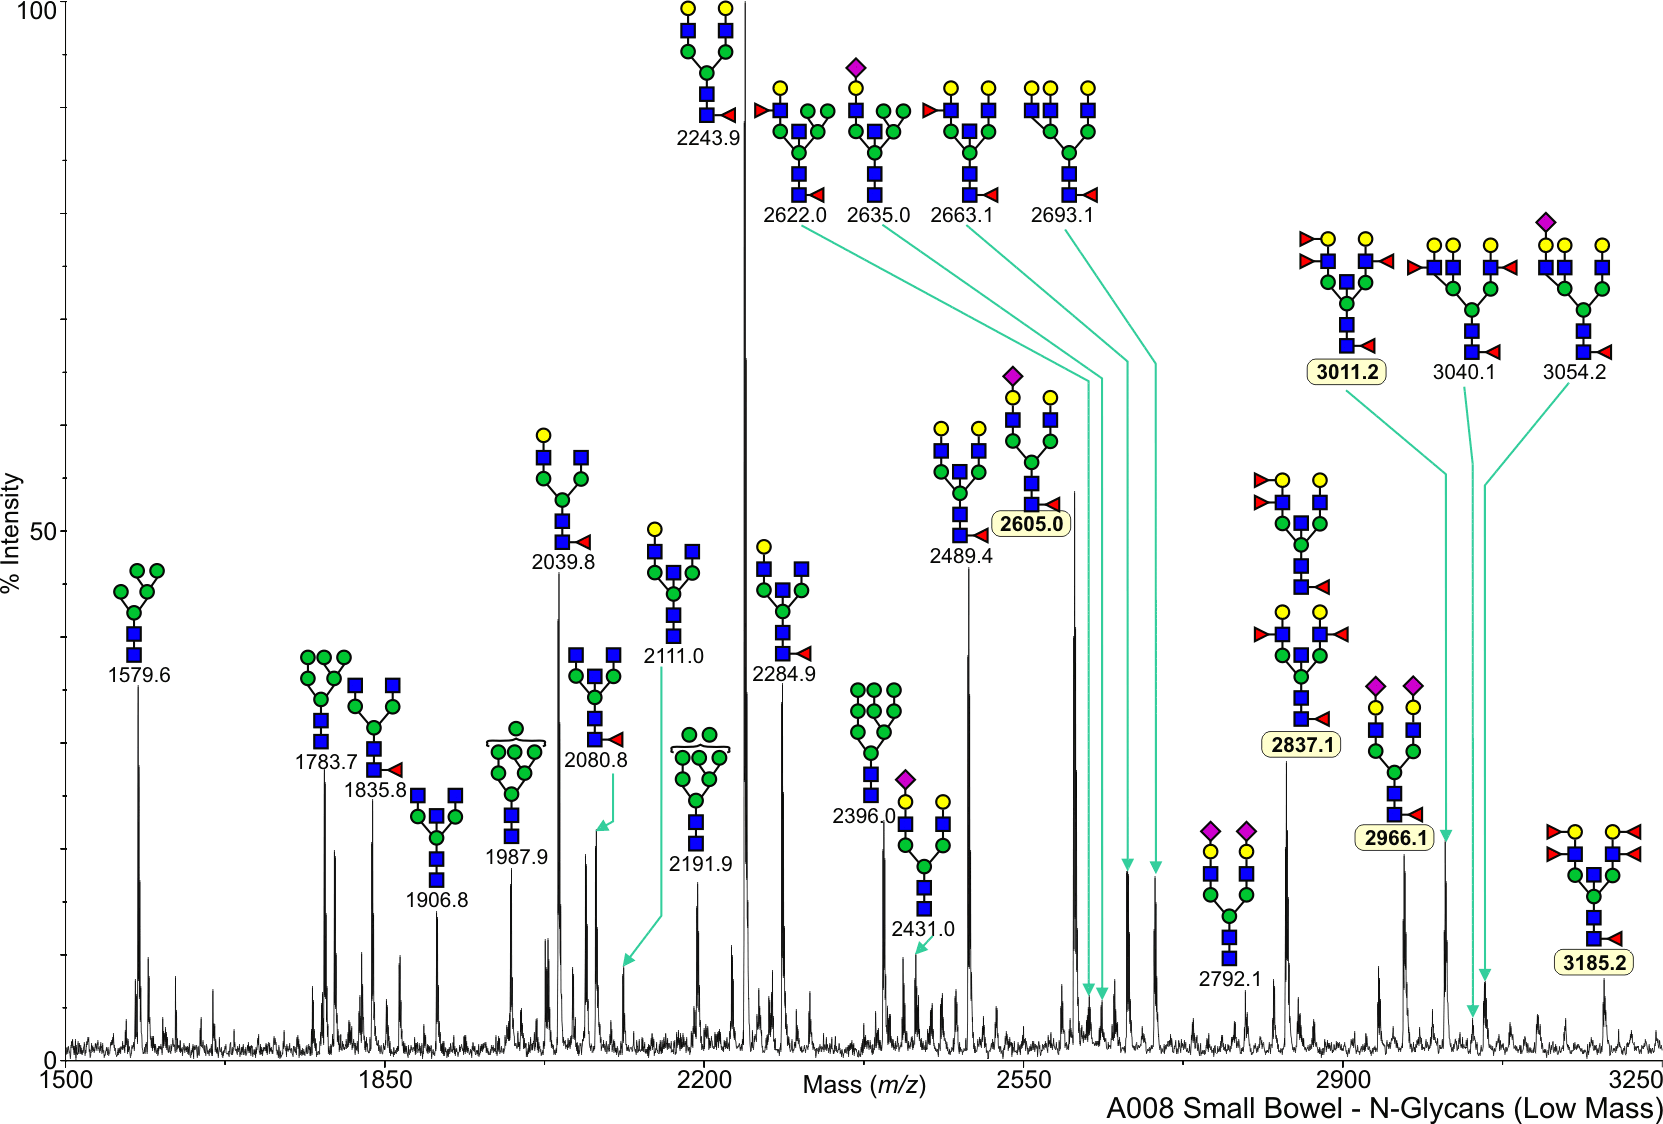
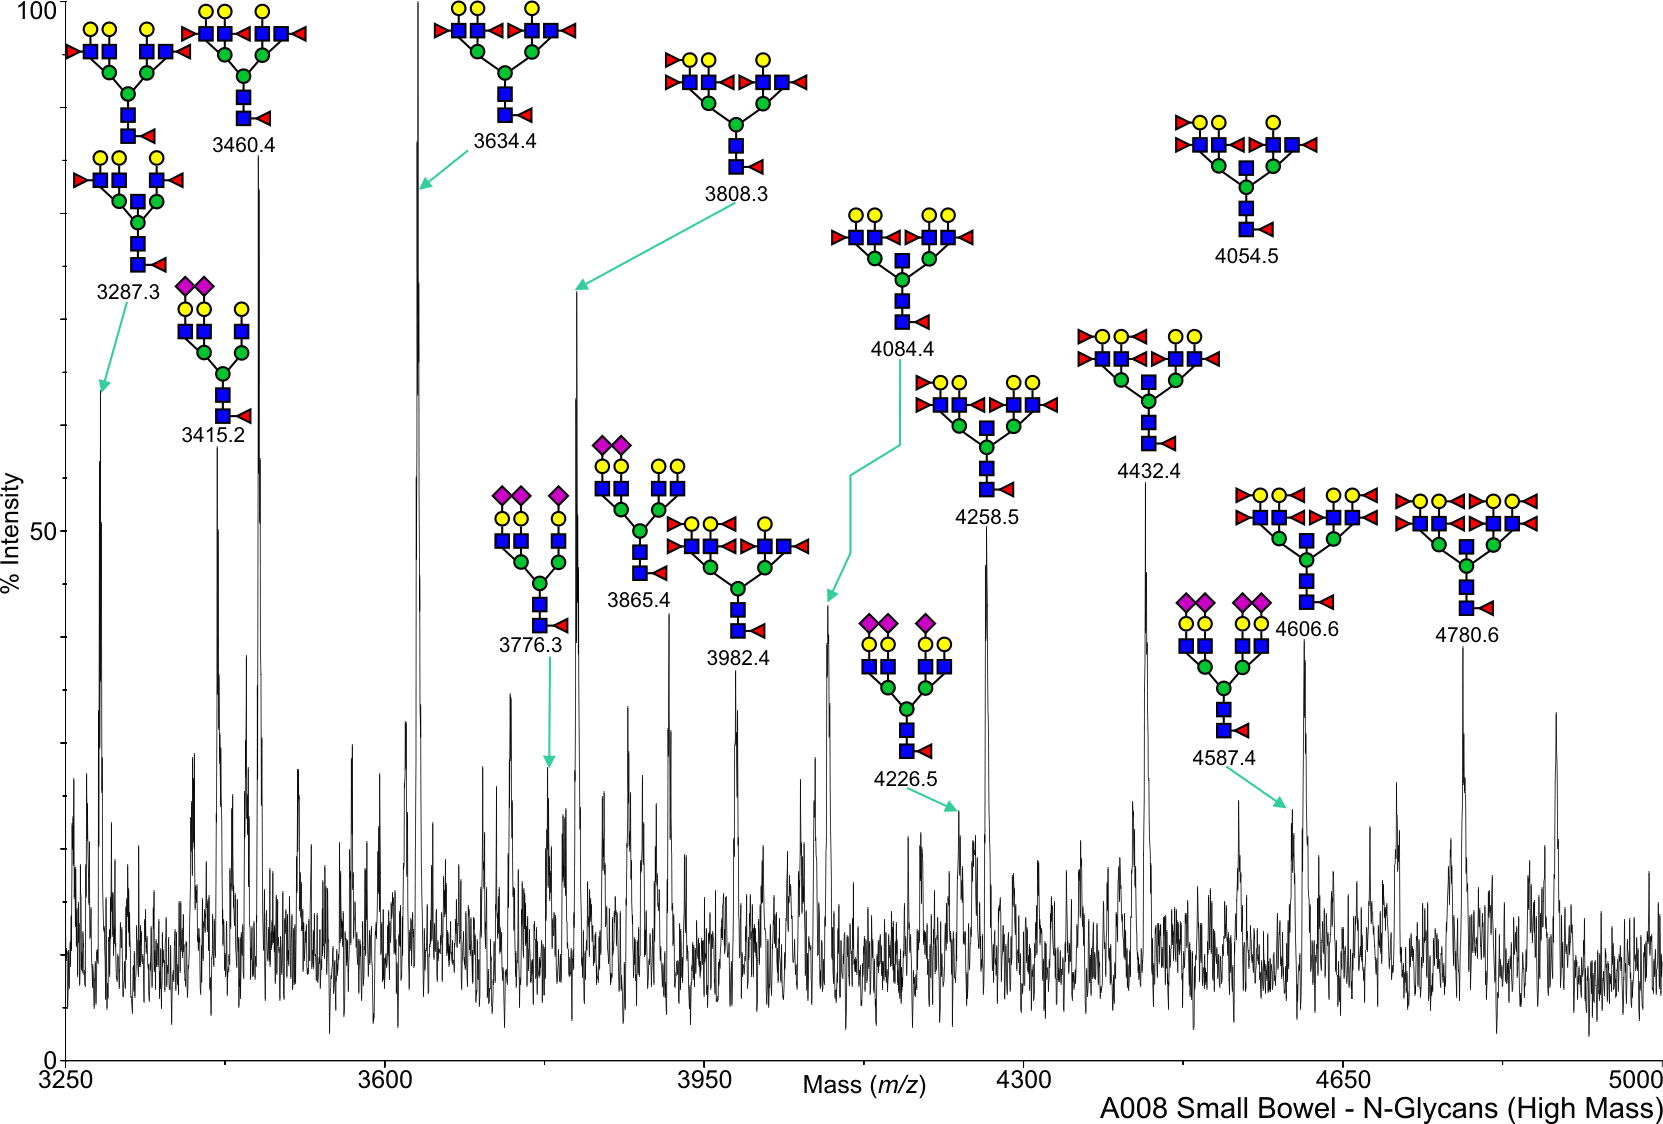
Human Small Bowel N-Linked A008 Salomon,Daniel View experimental details      
Annotated file for lower mass range in JPG formatAnnotated file for higher mass range in JPG format Annotated file for lower mass range in PDF formatAnnotated file for higher mass range in PDF format
View Mass Spectrum data as text View Mass Peak file   Interactive Mass Spectrum Viewer
cfg_rRequest_1691
Human Small Bowel N-Linked A009 Salomon,Daniel View experimental details      
   
View Mass Spectrum data as text      
cfg_rRequest_1691
Human Small Bowel O-Linked A002 - illeum Salomon,Daniel View experimental details      
   
         
cfg_rRequest_1691
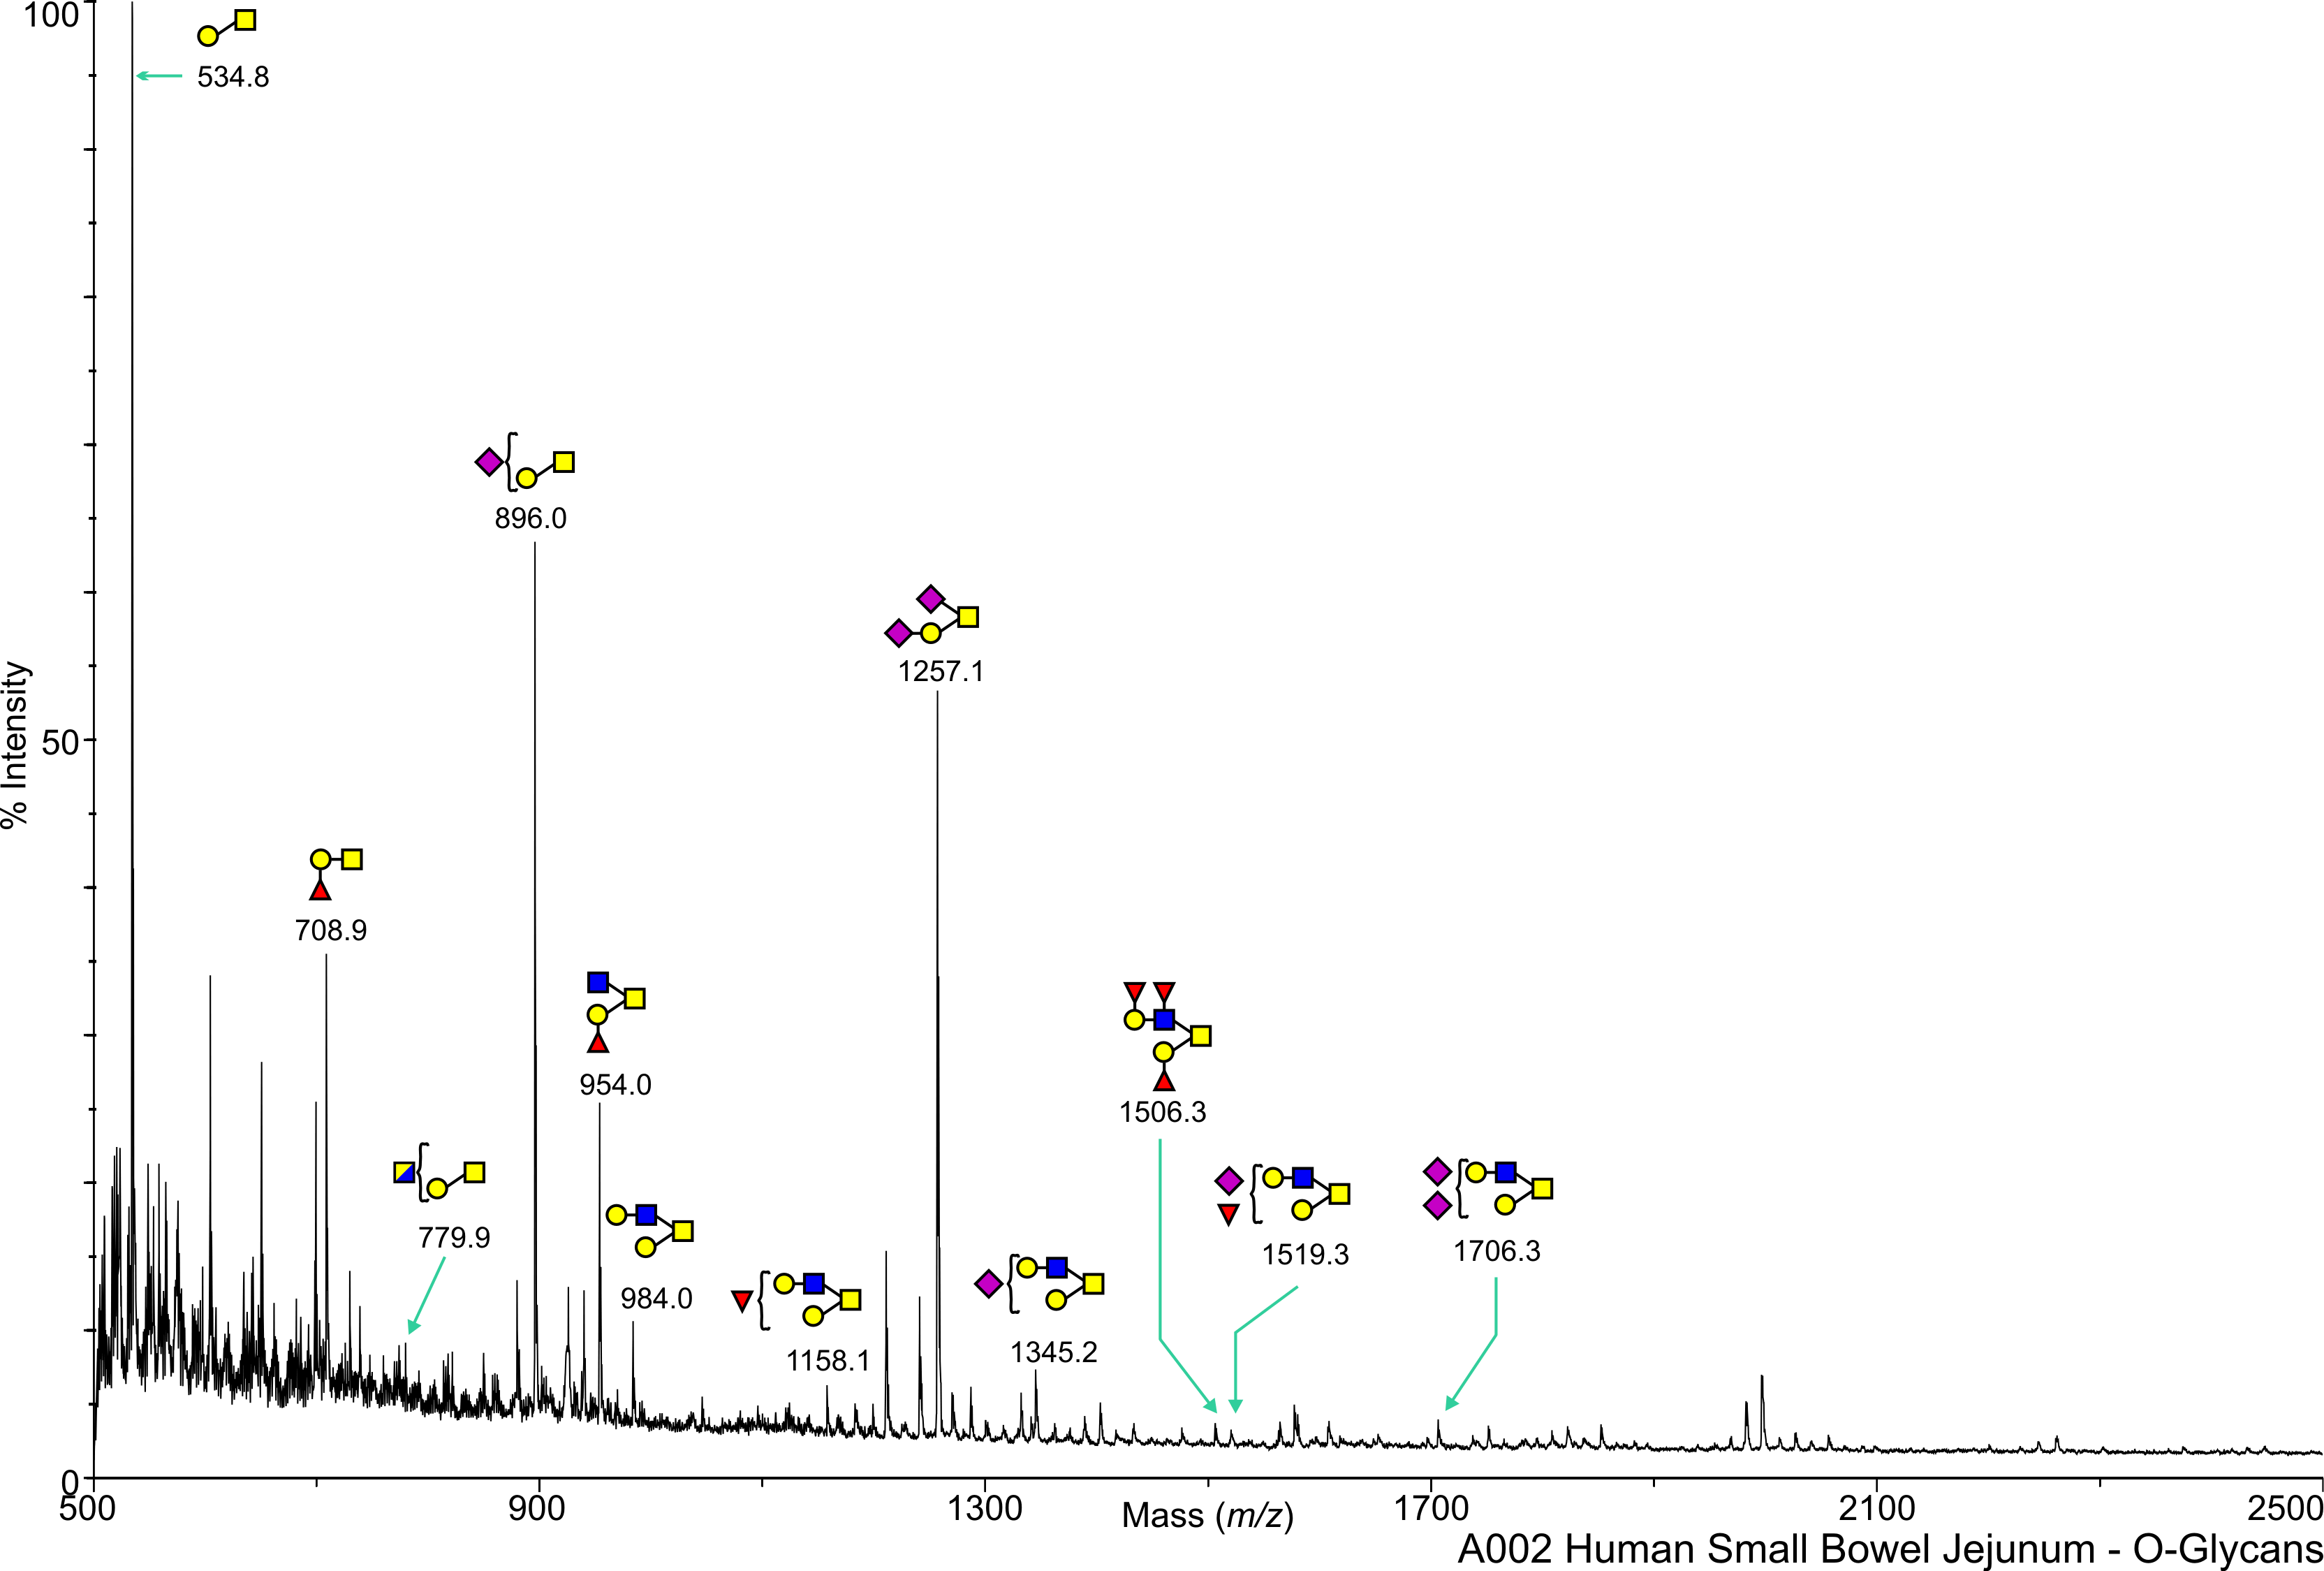
Human Small Bowel O-Linked A002 - jejunum Salomon,Daniel View experimental details      
Annotated file in JPG format Annotated file in PDF format
         
cfg_rRequest_1691
Human Small Bowel O-Linked A004 - jejunum Salomon,Daniel View experimental details      
   
         
cfg_rRequest_1691
Human Small Bowel O-Linked A007 Salomon,Daniel View experimental details      
   
View Mass Spectrum data as text      
cfg_rRequest_1691
Human Small Bowel O-Linked A008 Salomon,Daniel View experimental details      
   
View Mass Spectrum data as text      
cfg_rRequest_1691
Human Small Bowel O-Linked A009 Salomon,Daniel View experimental details      
   
View Mass Spectrum data as text      
cfg_rRequest_1691
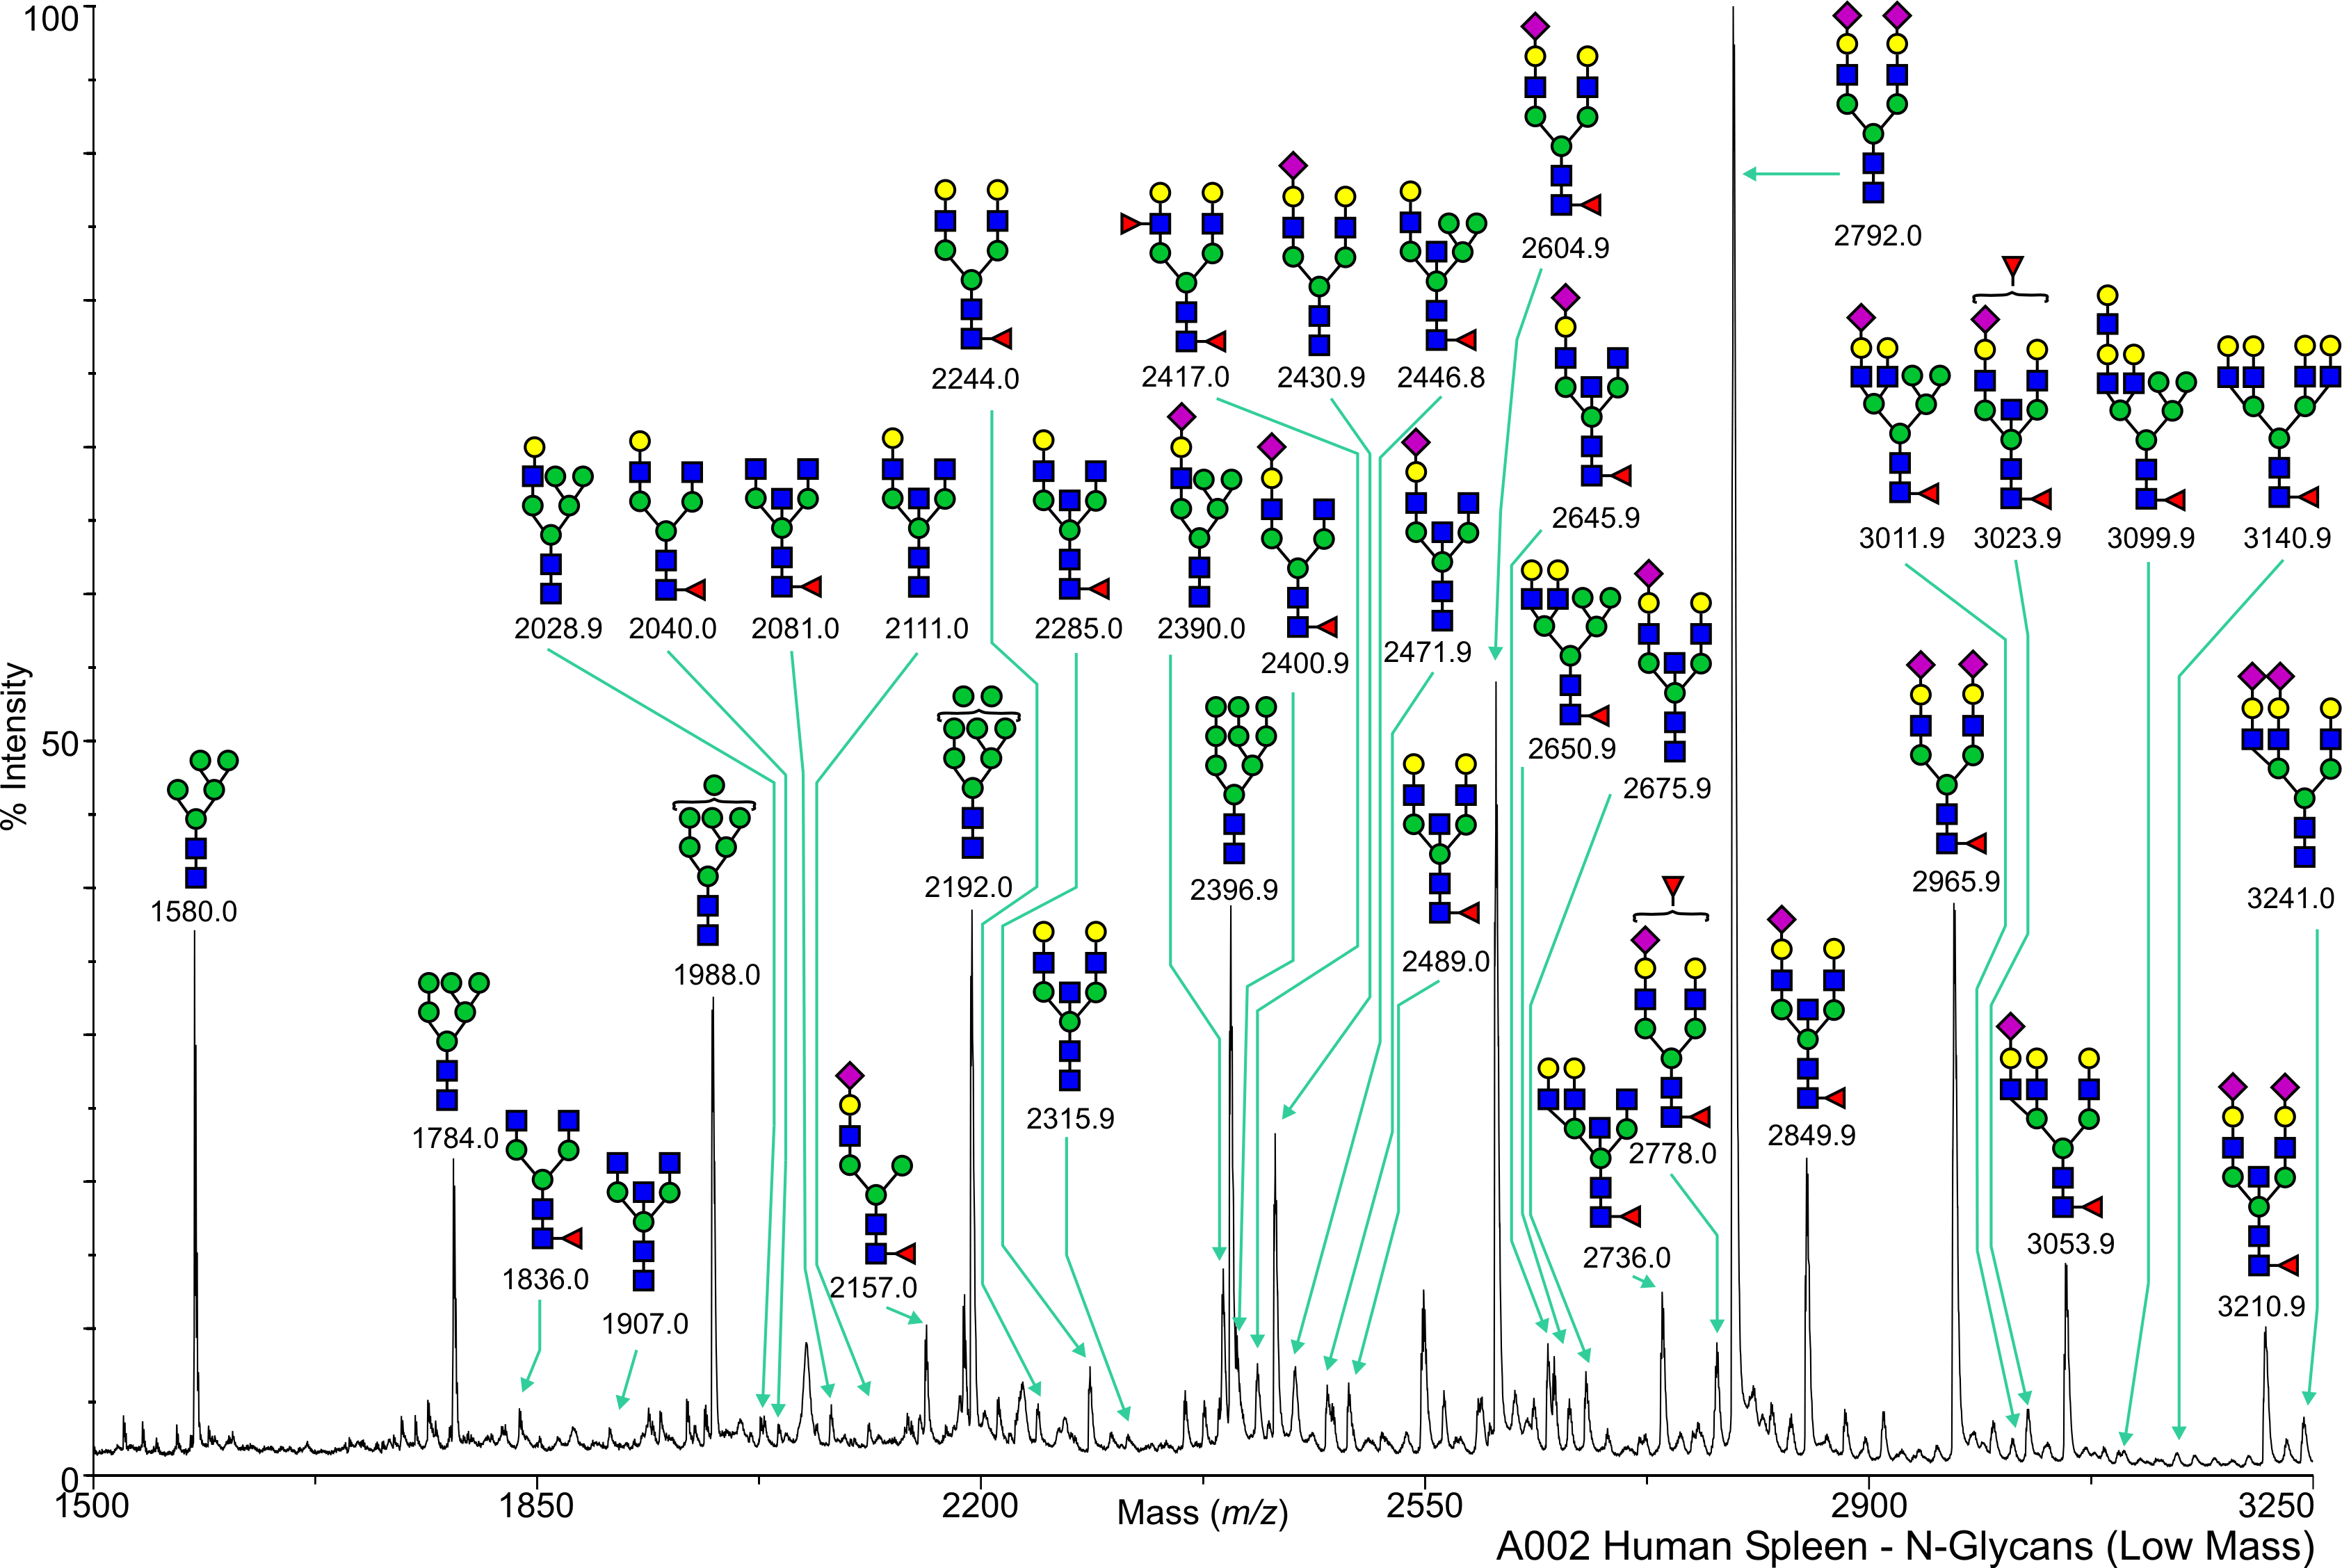
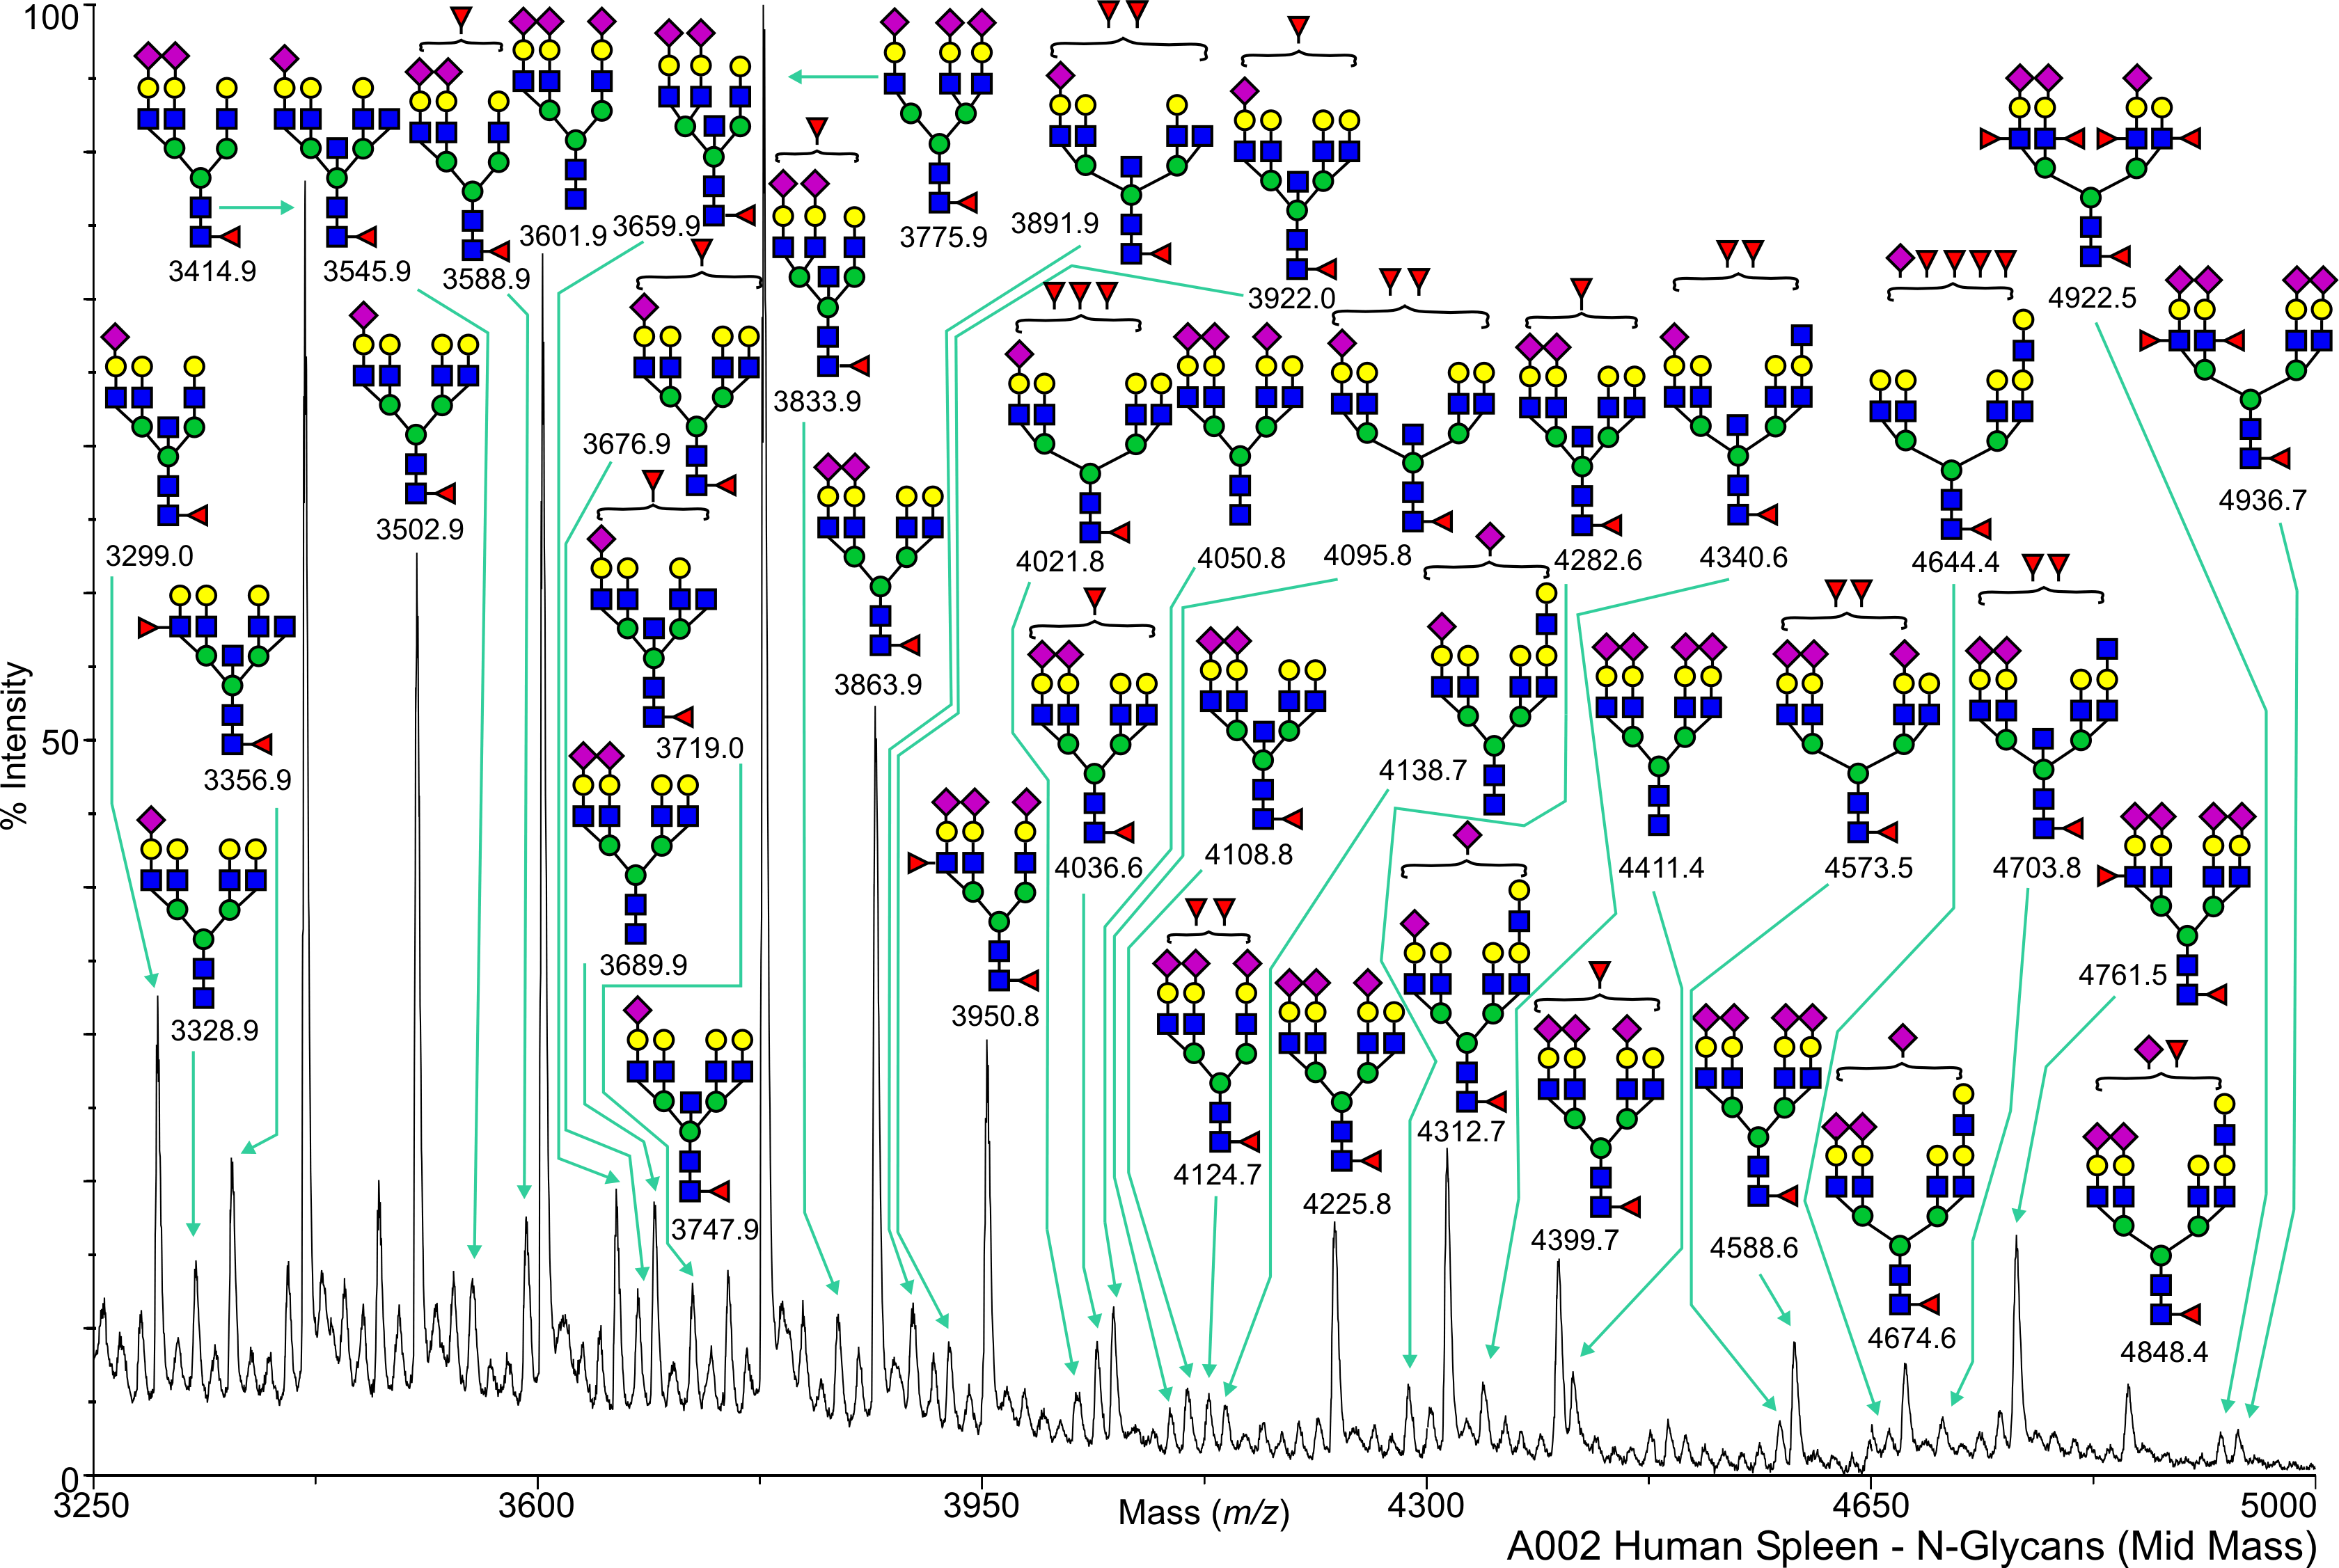
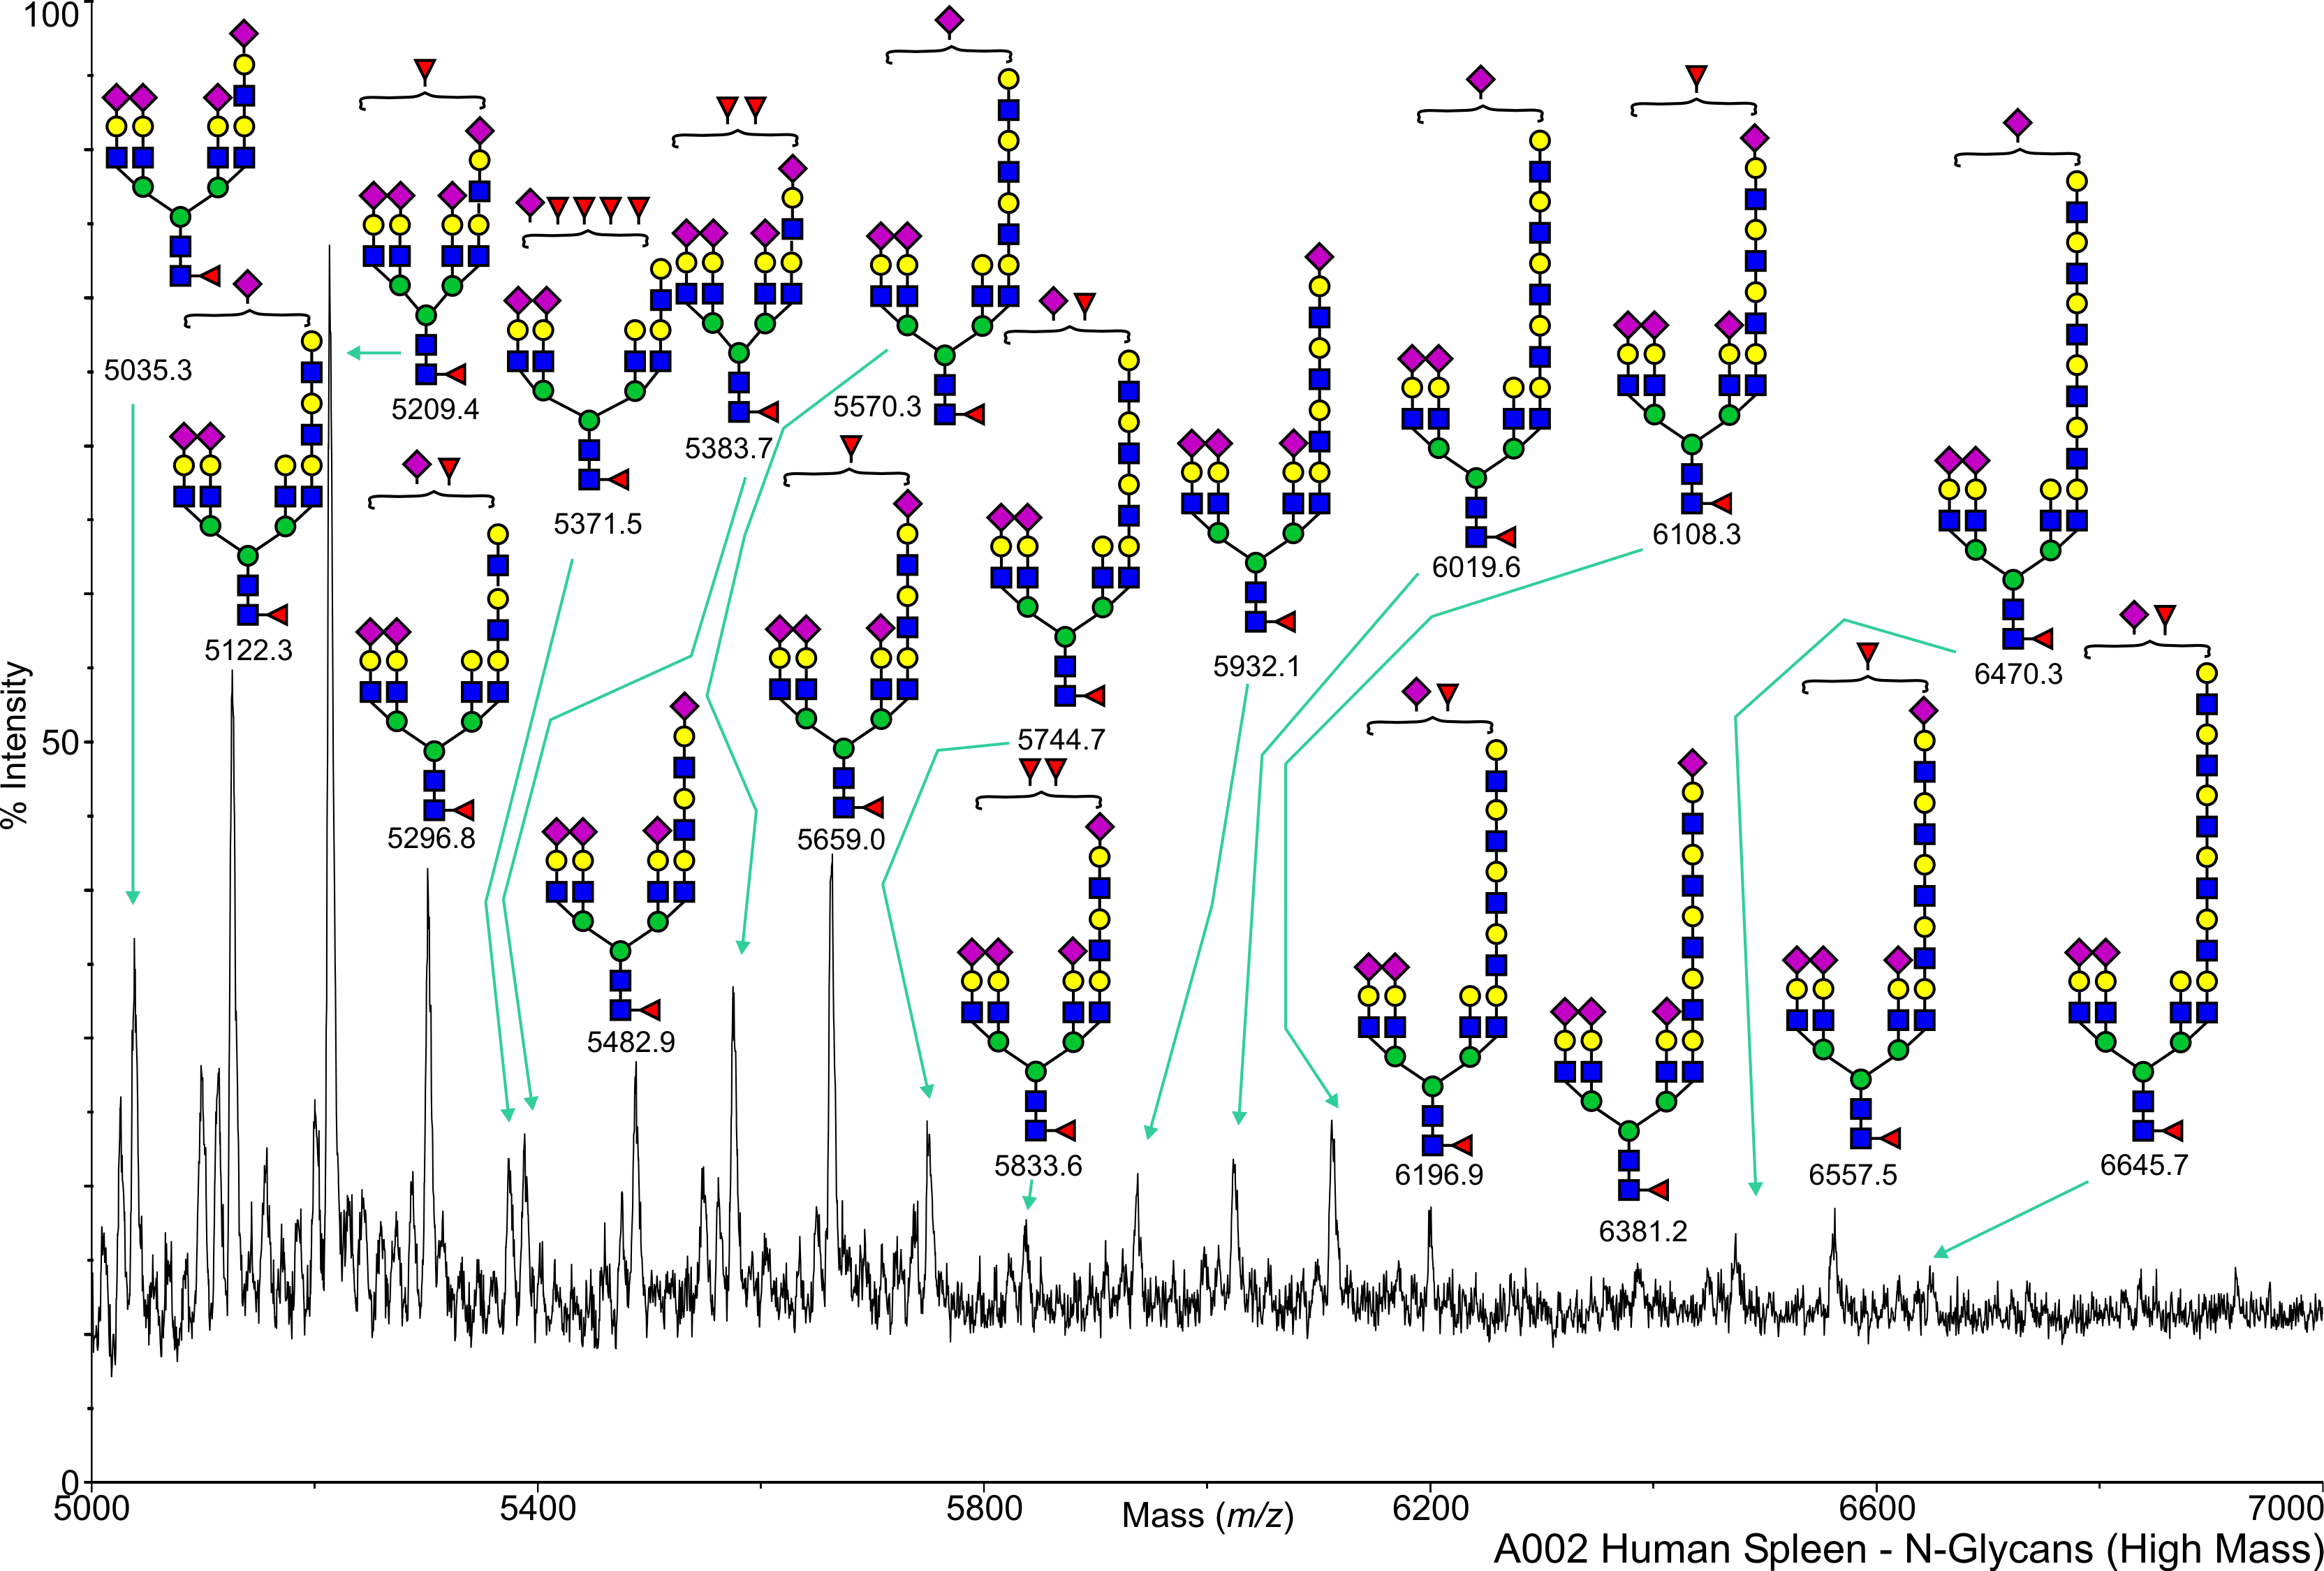
Human Spleen N-Linked A002 Salomon,Daniel View experimental details      
Annotated file for lower mass range in JPG formatAnnotated file for medium mass range in JPG formatAnnotated file for high mass range in JPG format Annotated file for lower mass range in PDF formatAnnotated file for medium mass range in PDF formatAnnotated file for high mass range in PDF format
         
cfg_rRequest_1691
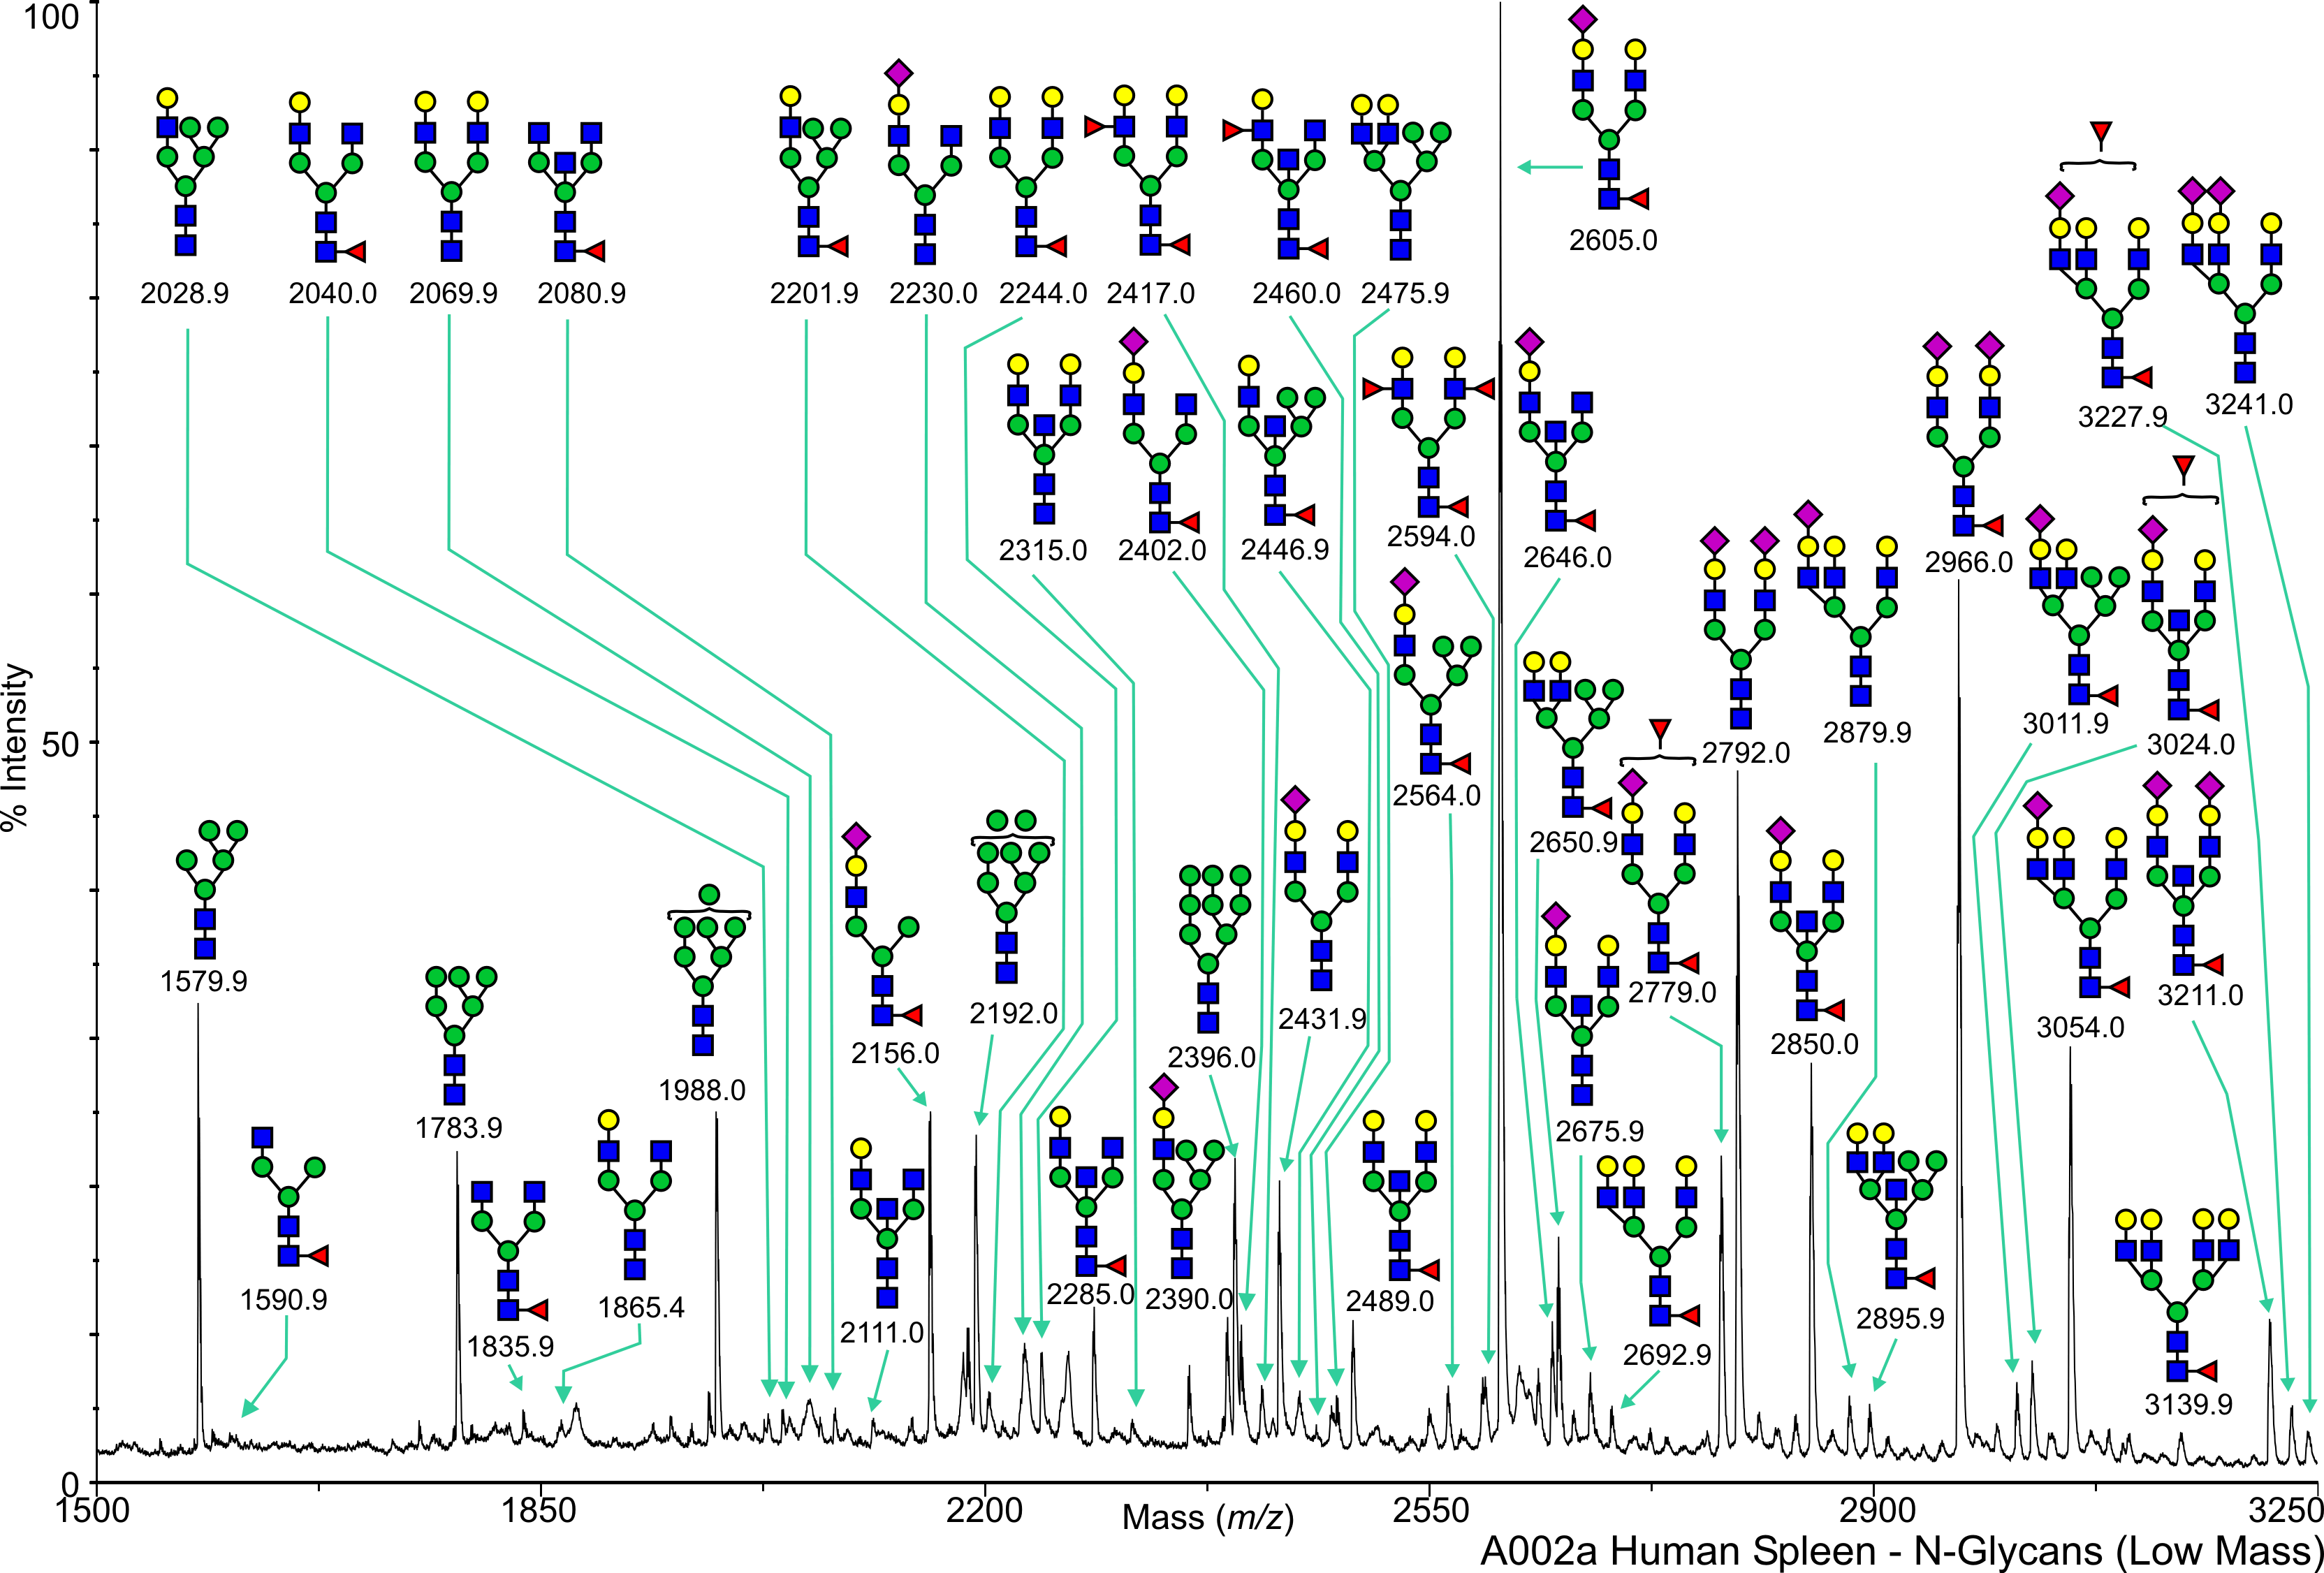
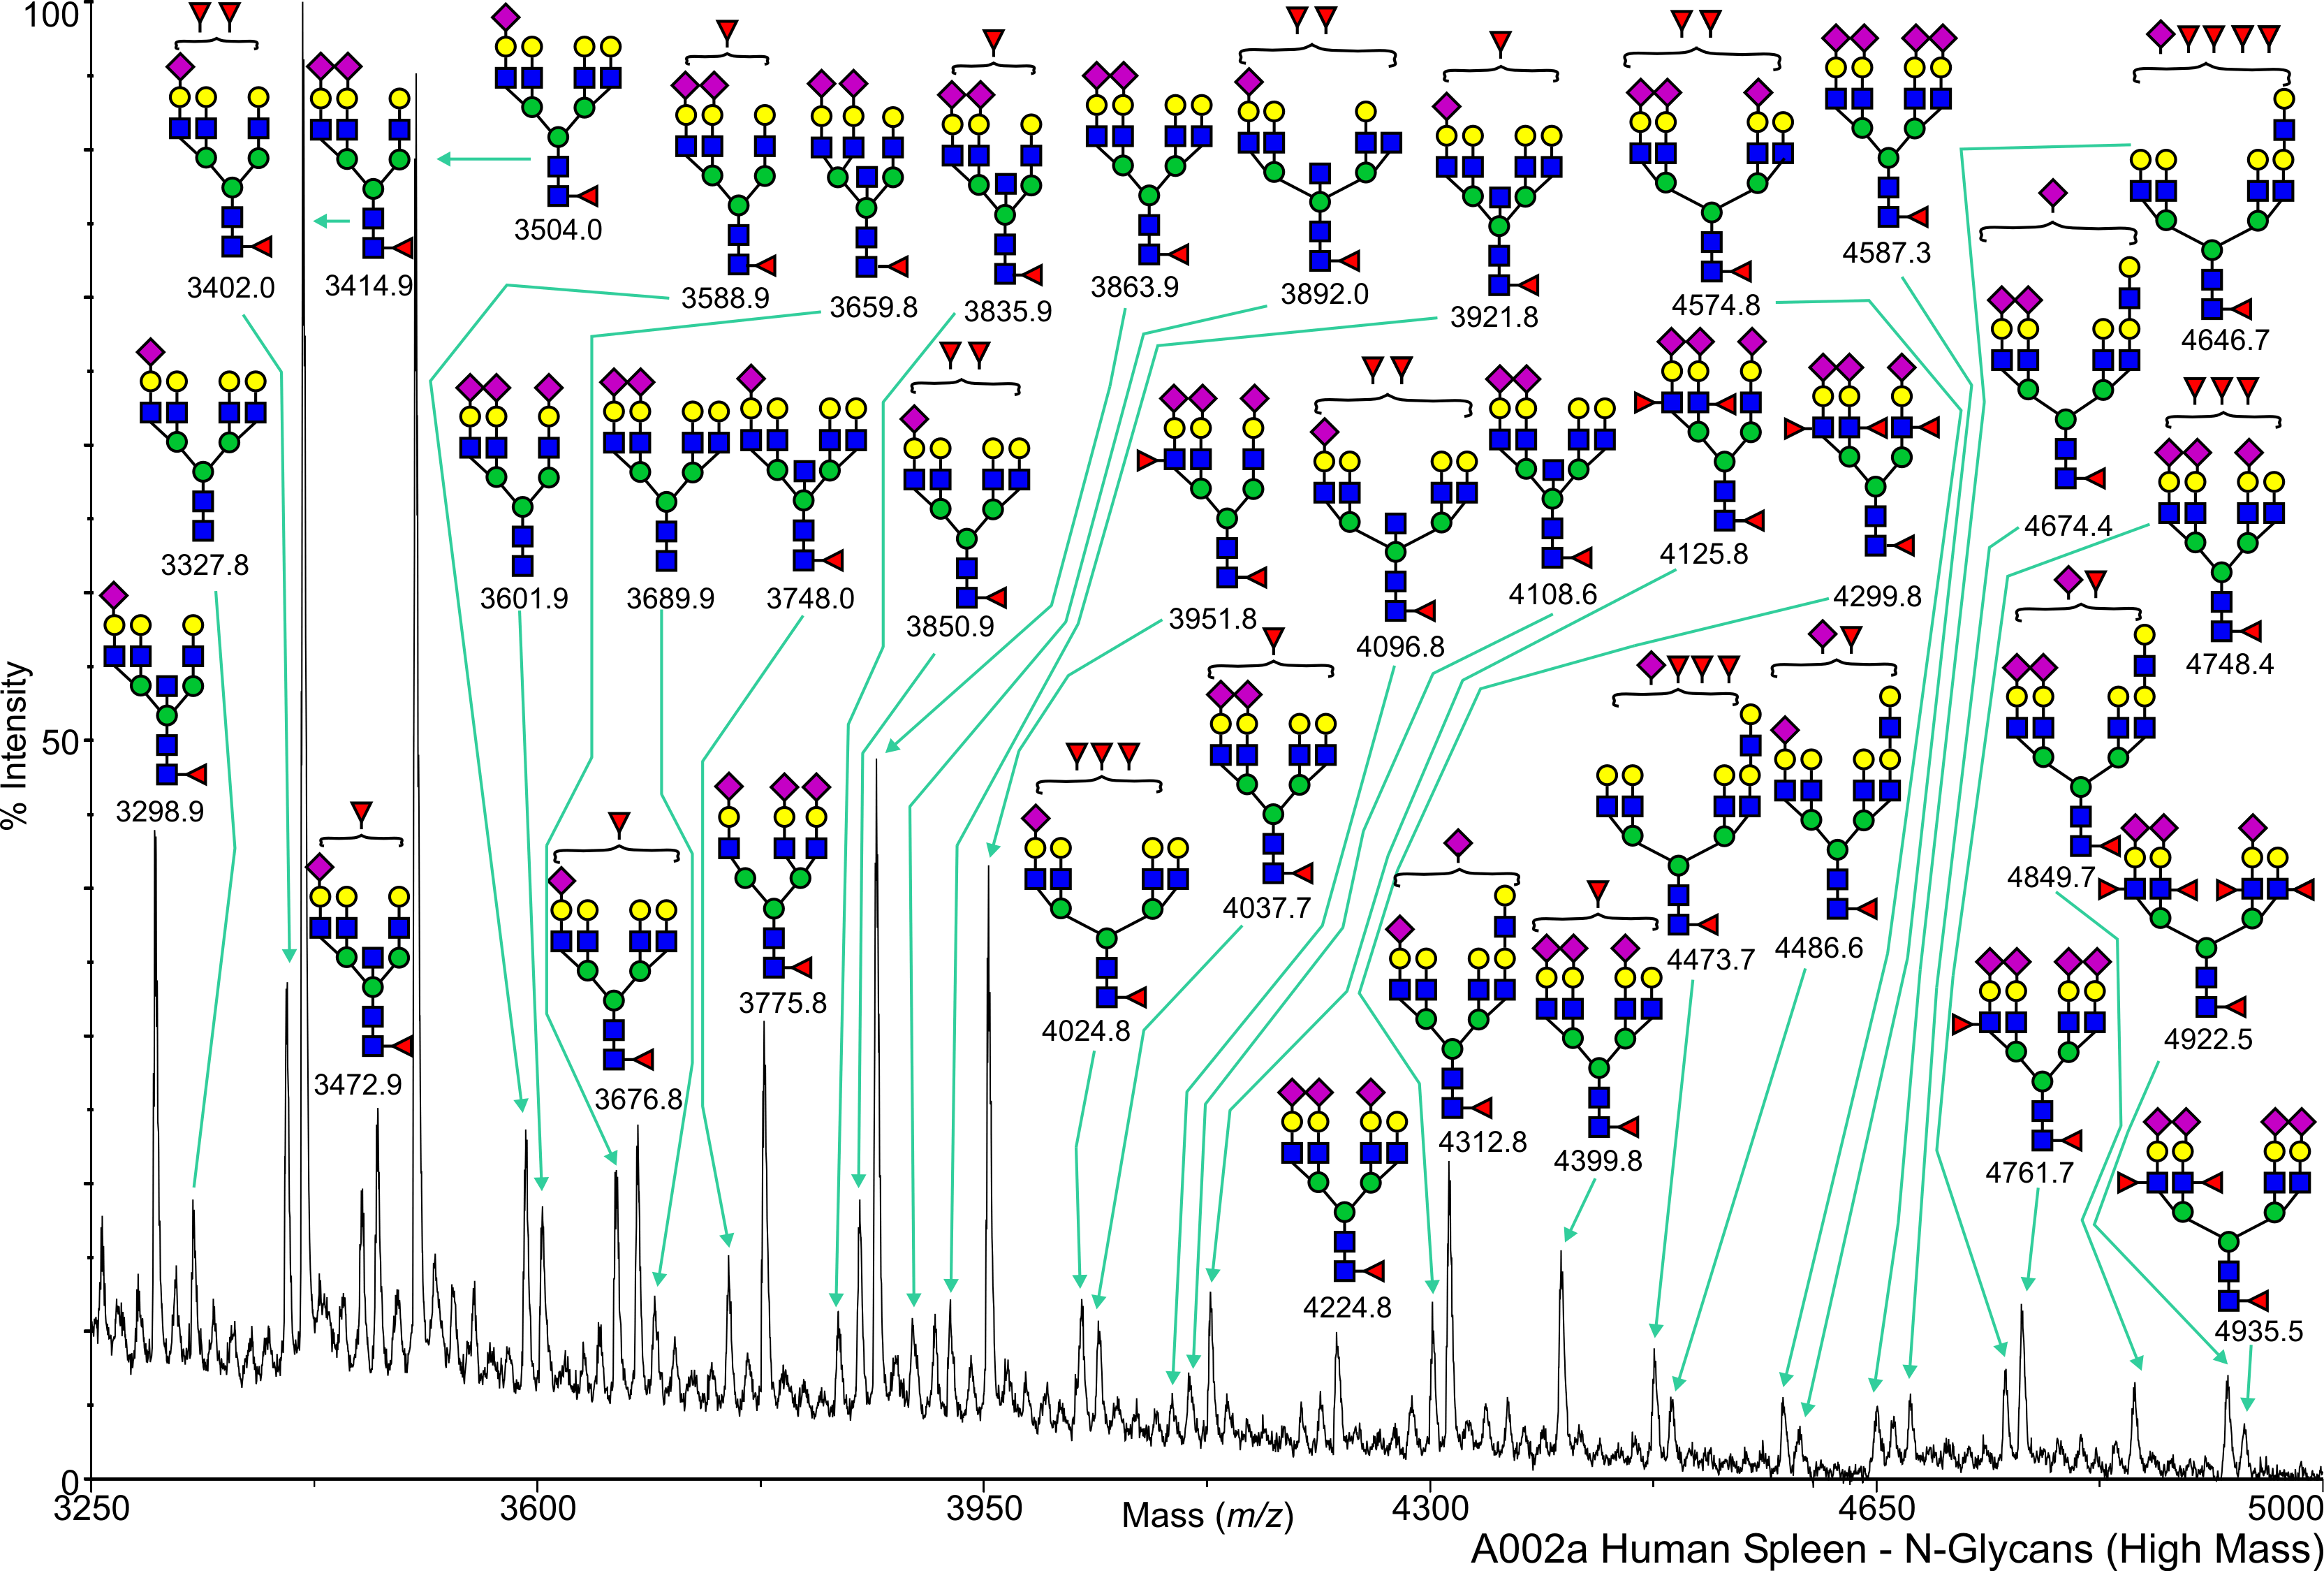
Human Spleen N-Linked A002a Salomon,Daniel View experimental details      
Annotated file for lower mass range in JPG formatAnnotated file for higher mass range in JPG format Annotated file for lower mass range in PDF formatAnnotated file for higher mass range in PDF format
         
cfg_rRequest_1691
Human Spleen N-Linked A007 Salomon,Daniel View experimental details      
Annotated file for lower mass range in JPG formatAnnotated file for higher mass range in JPG format Annotated file for lower mass range in PDF formatAnnotated file for higher mass range in PDF format
View Mass Spectrum data as text View Mass Peak file   Interactive Mass Spectrum Viewer
cfg_rRequest_1691
Human Spleen N-Linked A008 Salomon,Daniel View experimental details      
Annotated file for lower mass range in JPG formatAnnotated file for higher mass range in JPG format Annotated file for lower mass range in PDF formatAnnotated file for higher mass range in PDF format
View Mass Spectrum data as text View Mass Peak file   Interactive Mass Spectrum Viewer
cfg_rRequest_1691
Human Spleen N-Linked A009 Salomon,Daniel View experimental details      
Annotated file for lower mass range in JPG formatAnnotated file for higher mass range in JPG format Annotated file for lower mass range in PDF formatAnnotated file for higher mass range in PDF format
View Mass Spectrum data as text View Mass Peak file   Interactive Mass Spectrum Viewer
cfg_rRequest_1691
Human Spleen O-Linked A007 Salomon,Daniel View experimental details      
Annotated file in JPG format Annotated file in PDF format
View Mass Spectrum data as text View Mass Peak file   Interactive Mass Spectrum Viewer
cfg_rRequest_1691
Human Spleen O-Linked A008 Salomon,Daniel View experimental details      
Annotated file in JPG format Annotated file in PDF format
View Mass Spectrum data as text View Mass Peak file   Interactive Mass Spectrum Viewer
cfg_rRequest_1691
Human Spleen O-Linked A009 Salomon,Daniel View experimental details      
Annotated file in JPG format Annotated file in PDF format
View Mass Spectrum data as text View Mass Peak file   Interactive Mass Spectrum Viewer
cfg_rRequest_1691
Mouse Postnatal day 9 neurons from WT mice O-Linked Henion, Timothy View experimental details      
Annotated file in JPG format Annotated file in PDF format
View Mass Spectrum data as text View Mass Peak file   Interactive Mass Spectrum Viewer
cfg_rRequest_447
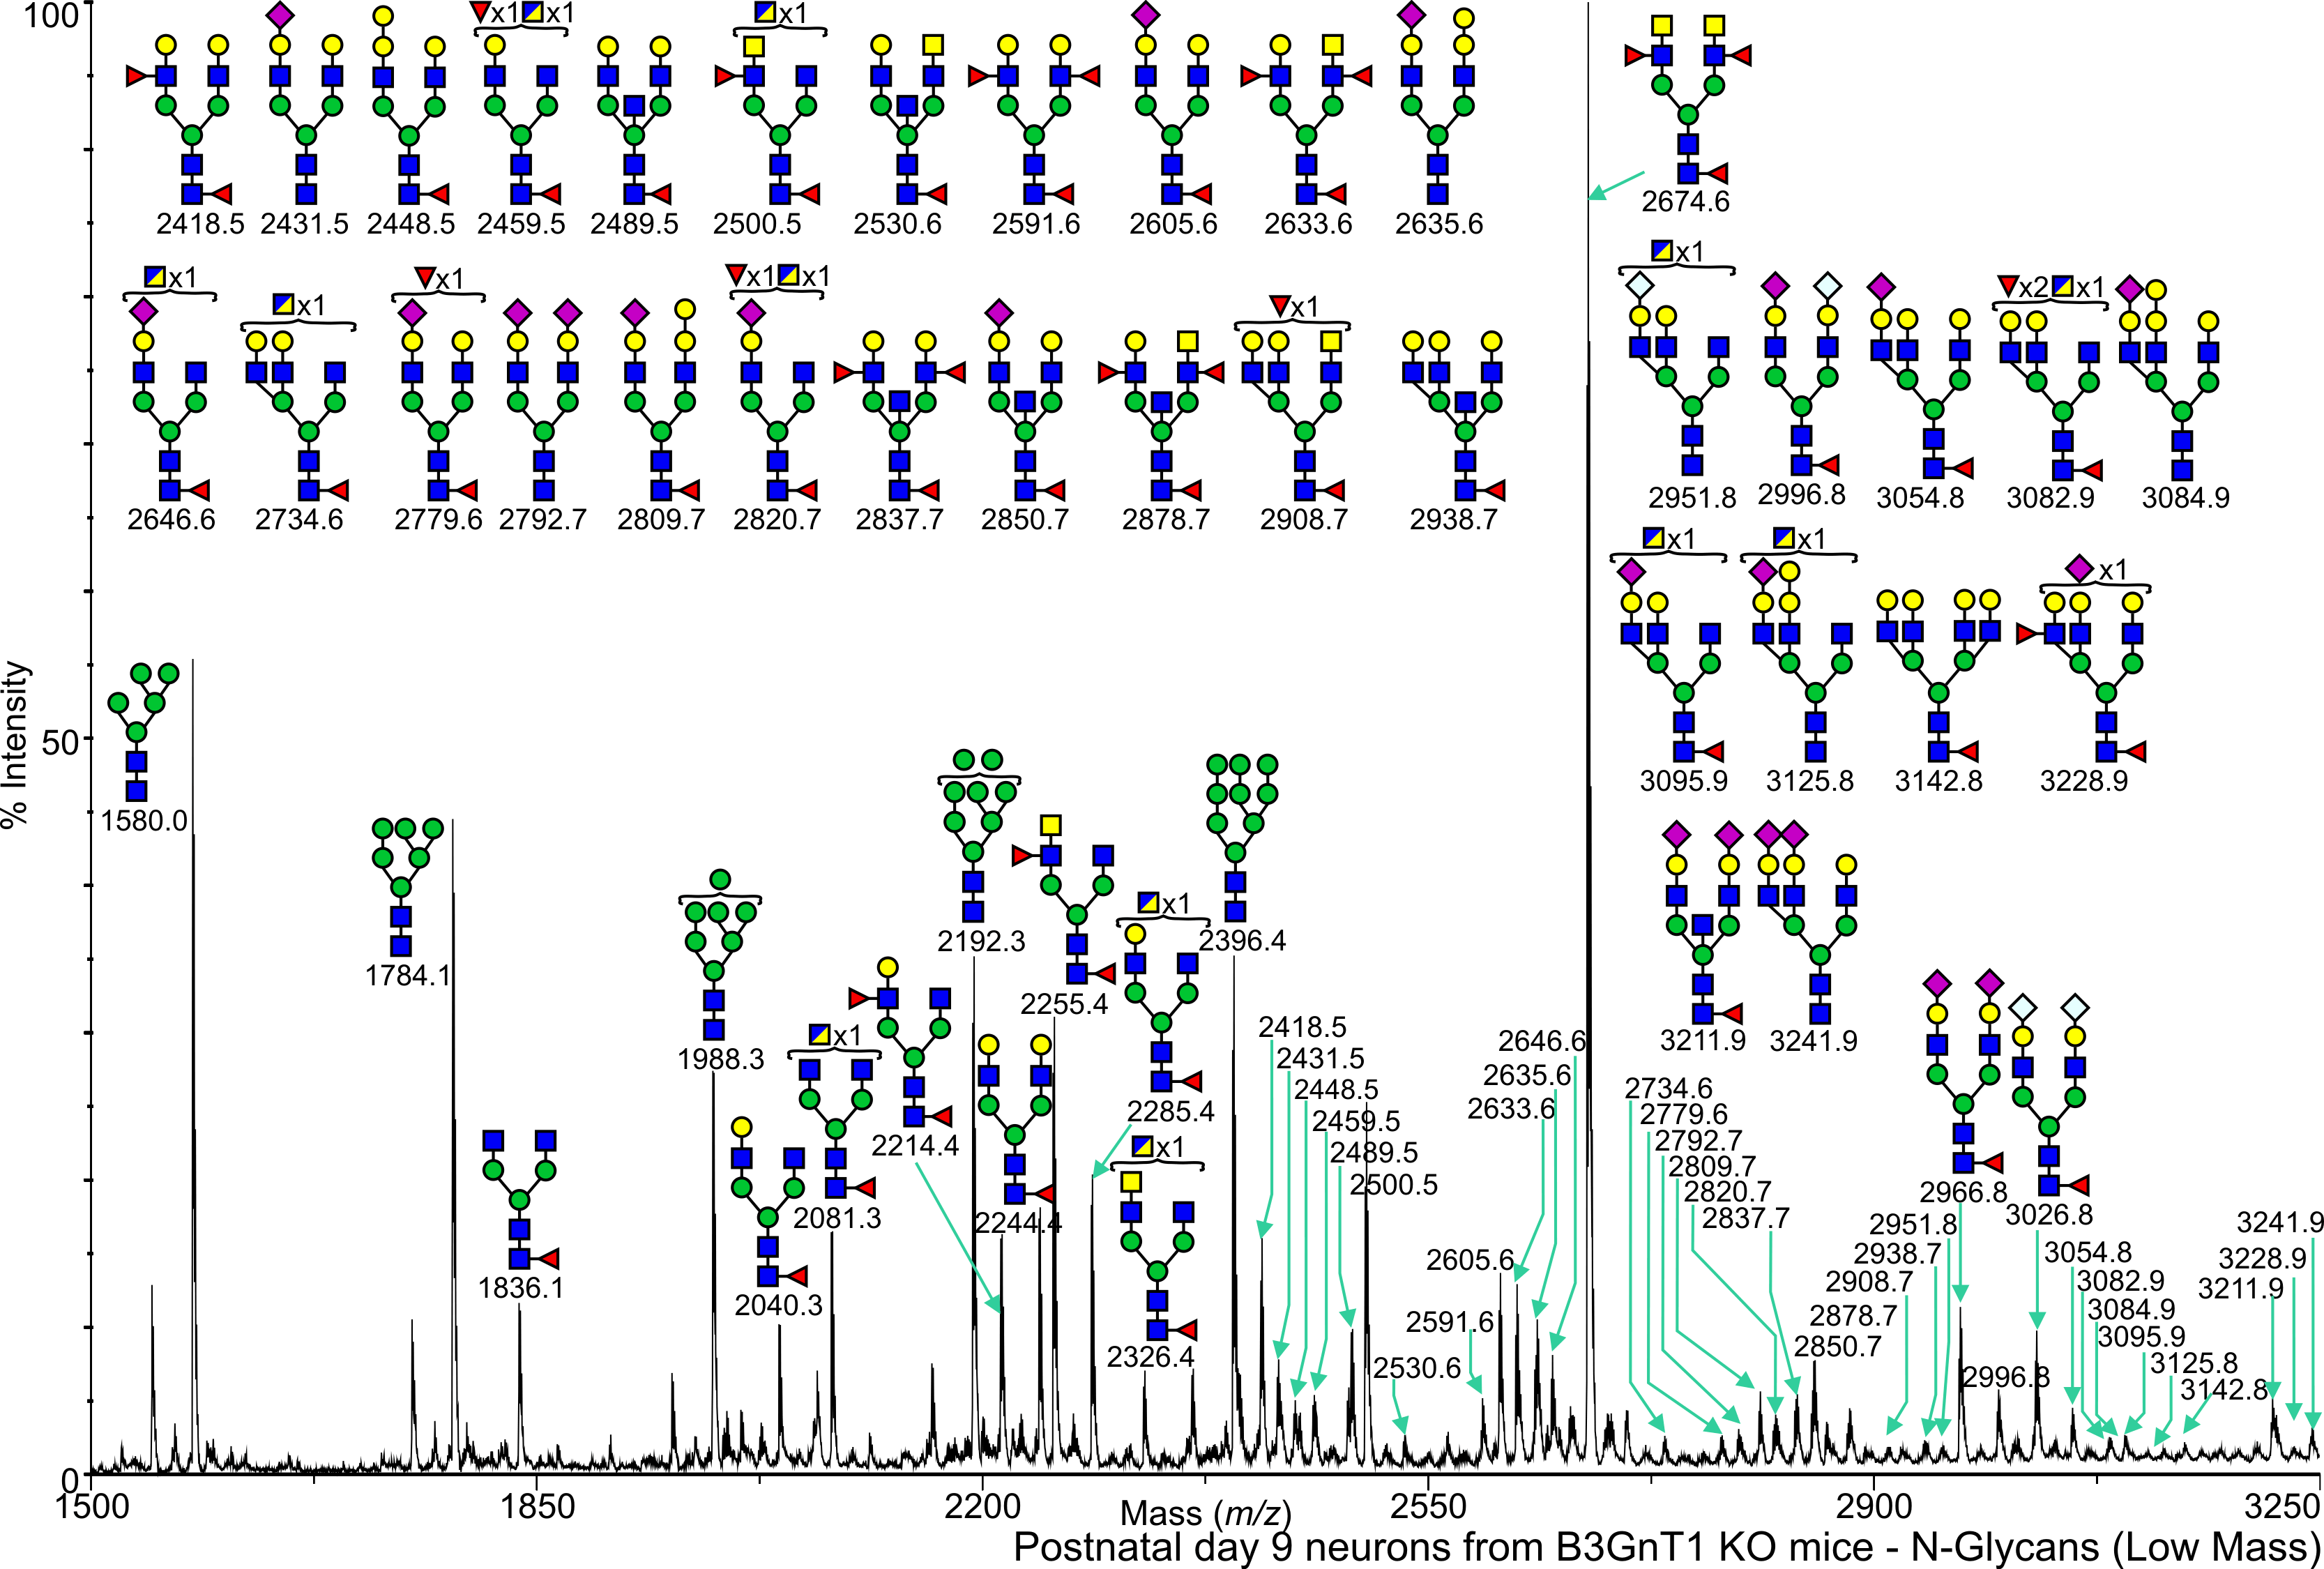
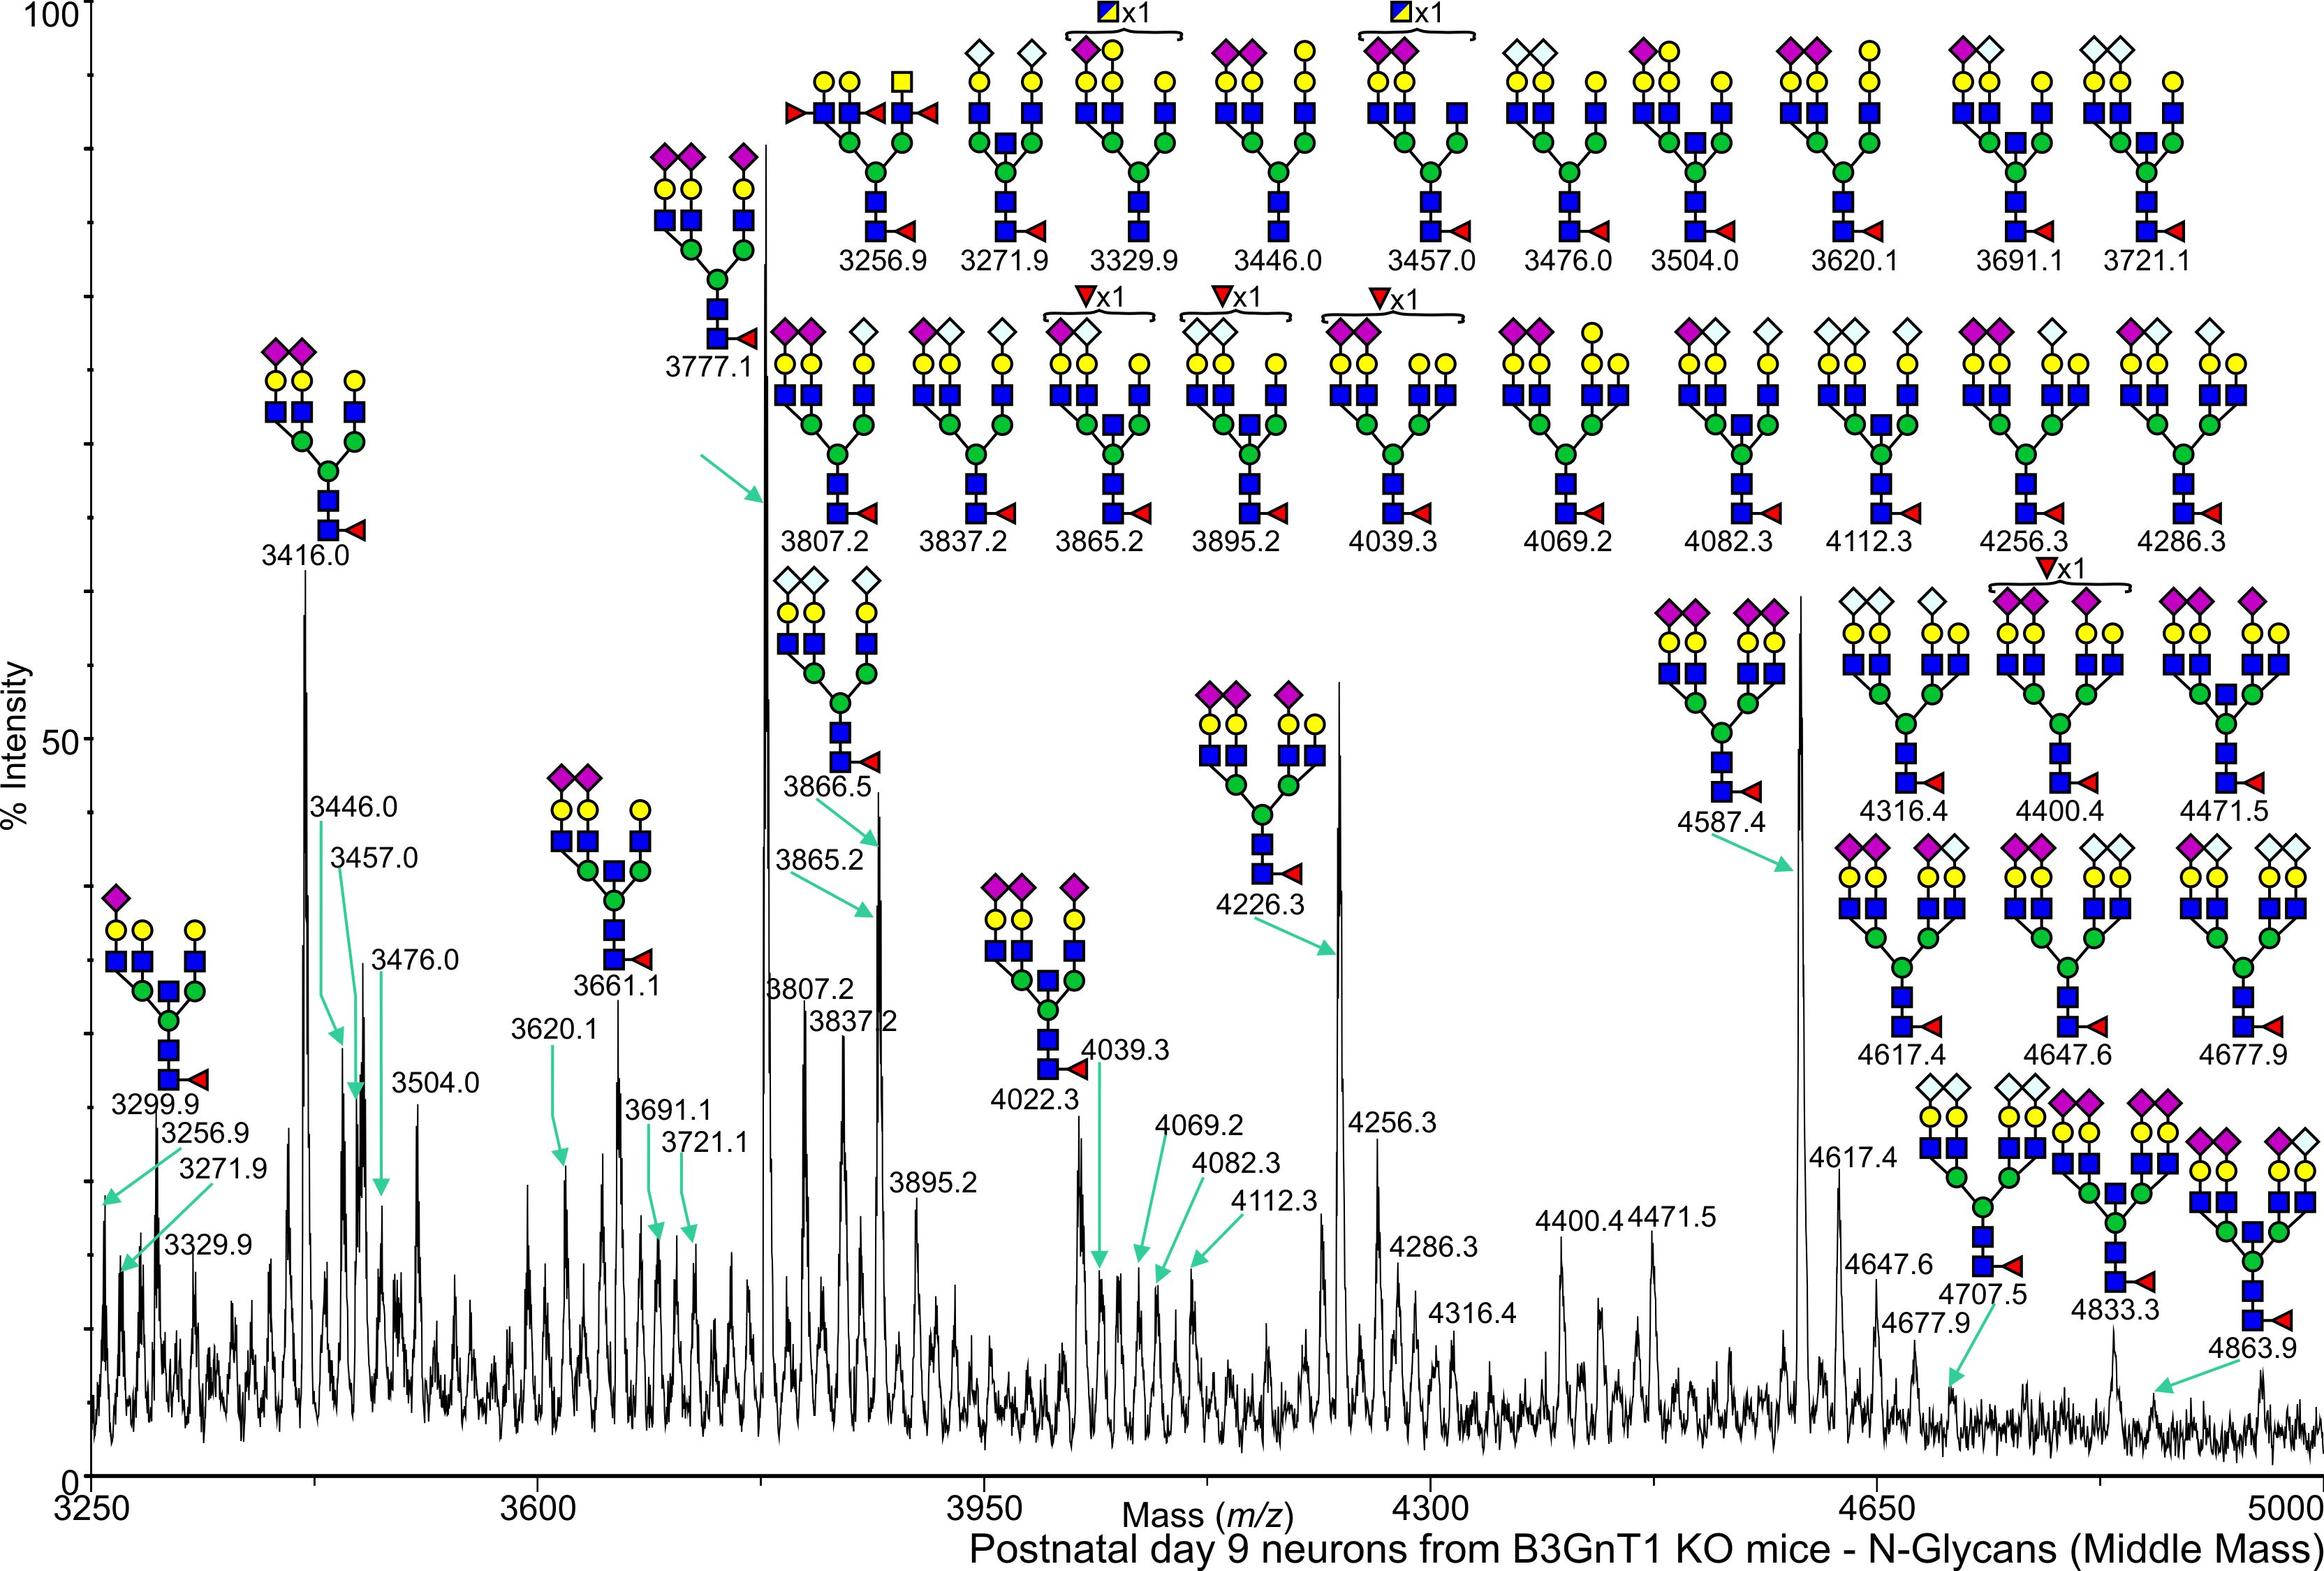
Mouse Postnatal day 9 neurons from B3GnT1 KO mice N-Linked Henion, Timothy View experimental details      
Annotated file for lower mass range in JPG formatAnnotated file for higher mass range in JPG format Annotated file for lower mass range in PDF formatAnnotated file for higher mass range in PDF format
View Mass Spectrum data as text View Mass Peak file   Interactive Mass Spectrum Viewer
cfg_rRequest_447
Mouse Postnatal day 9 neurons from B3GnT1 KO mice O-Linked Henion, Timothy View experimental details      
Annotated file in JPG format Annotated file in PDF format
View Mass Spectrum data as text View Mass Peak file   Interactive Mass Spectrum Viewer
cfg_rRequest_447
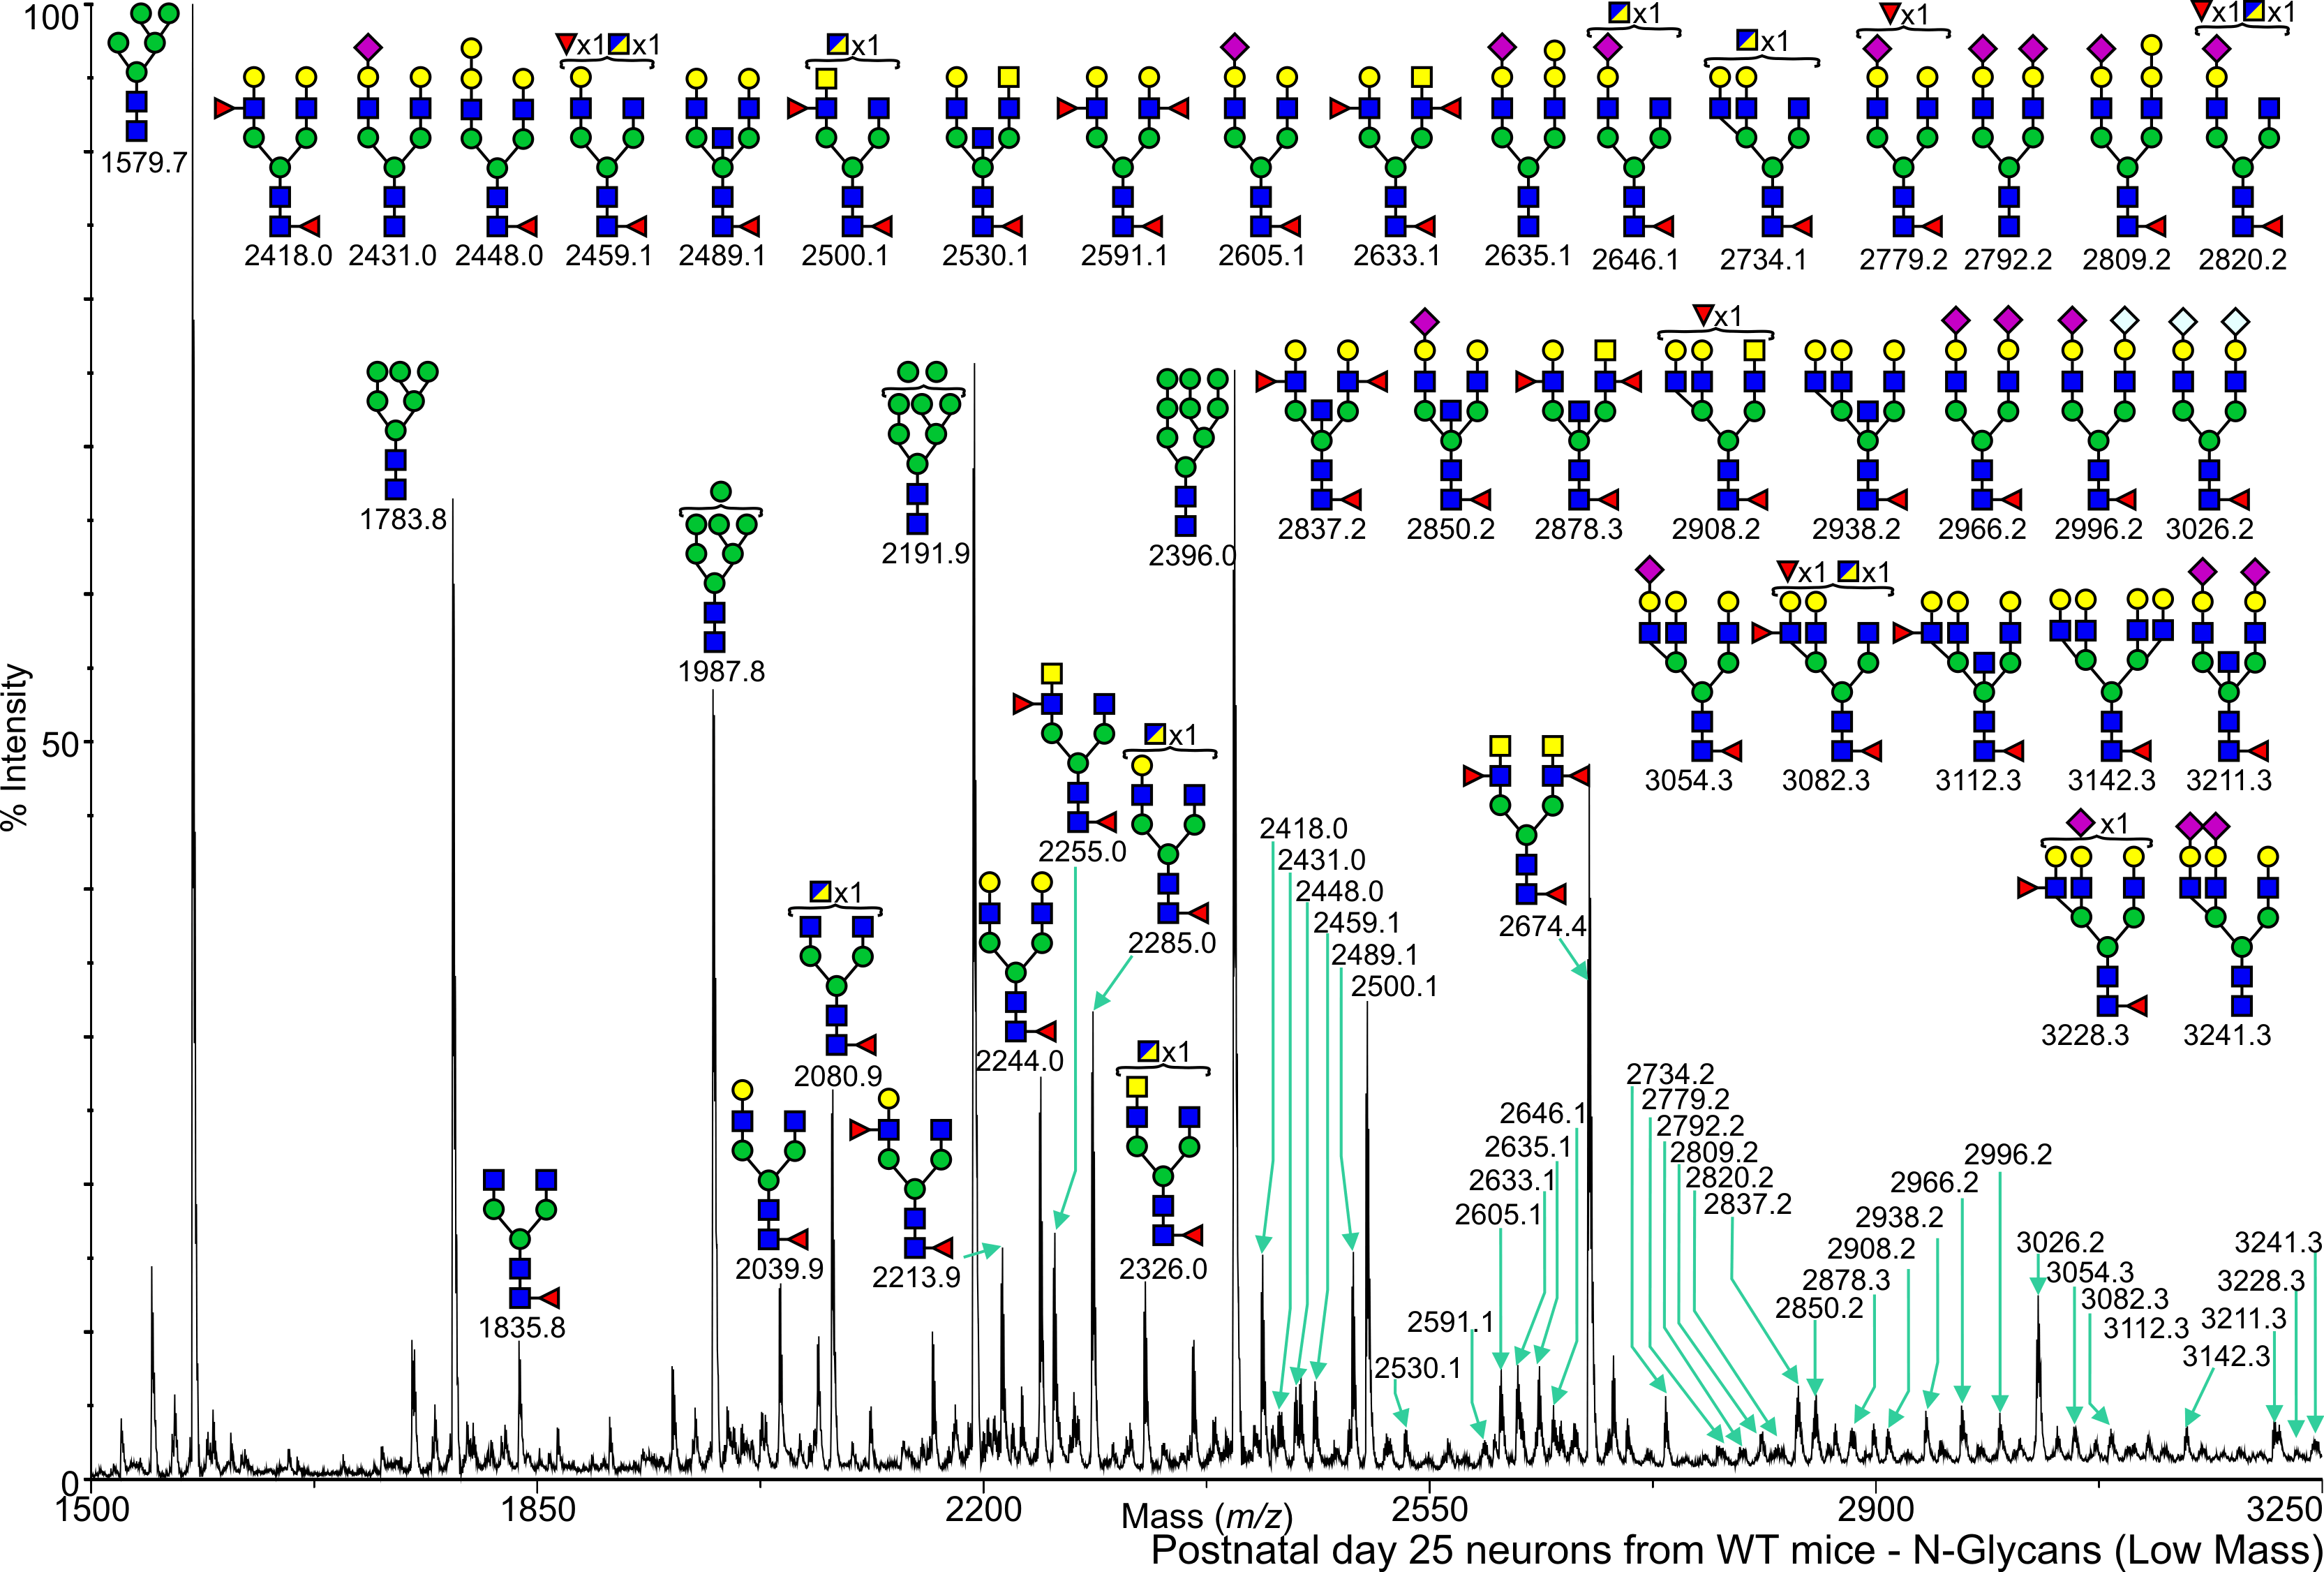
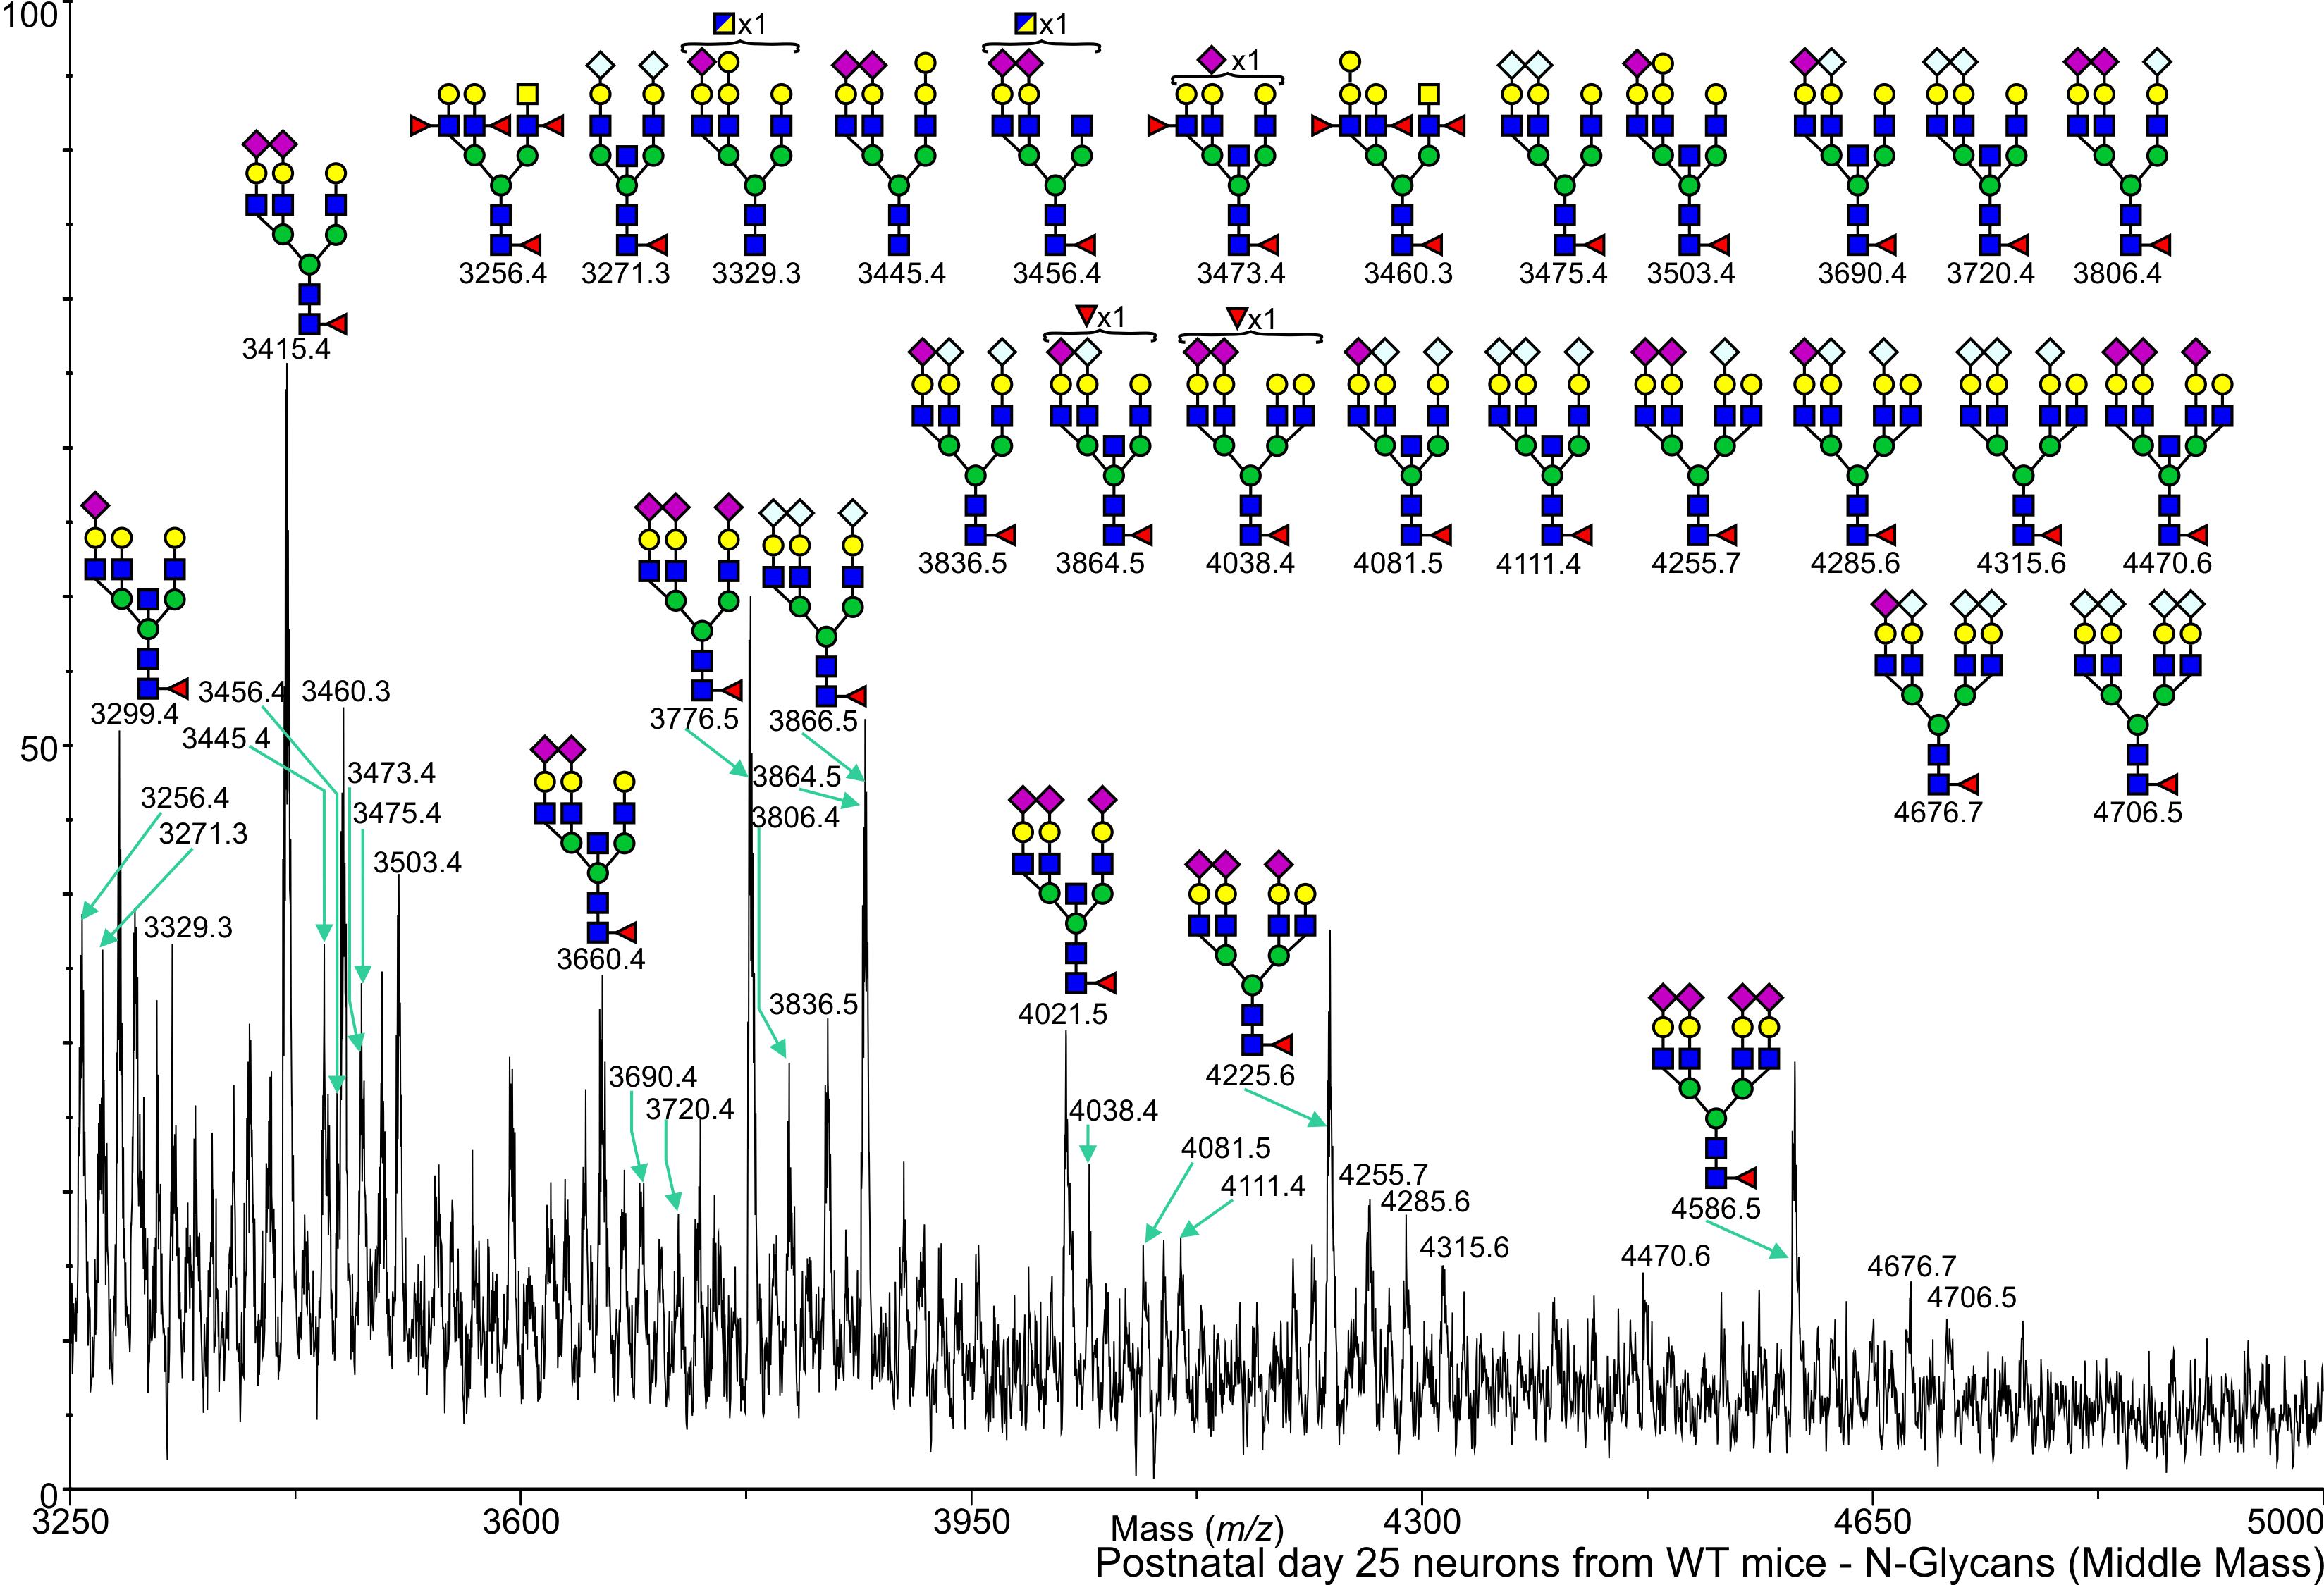
Mouse Postnatal day 25 neurons from WT mice N-Linked Henion, Timothy View experimental details      
Annotated file for lower mass range in JPG formatAnnotated file for higher mass range in JPG format Annotated file for lower mass range in PDF formatAnnotated file for higher mass range in PDF format
View Mass Spectrum data as text View Mass Peak file   Interactive Mass Spectrum Viewer
cfg_rRequest_447
Mouse Postnatal day 25 neurons from WT mice O-Linked Henion, Timothy View experimental details      
Annotated file in JPG format Annotated file in PDF format
View Mass Spectrum data as text      
cfg_rRequest_447
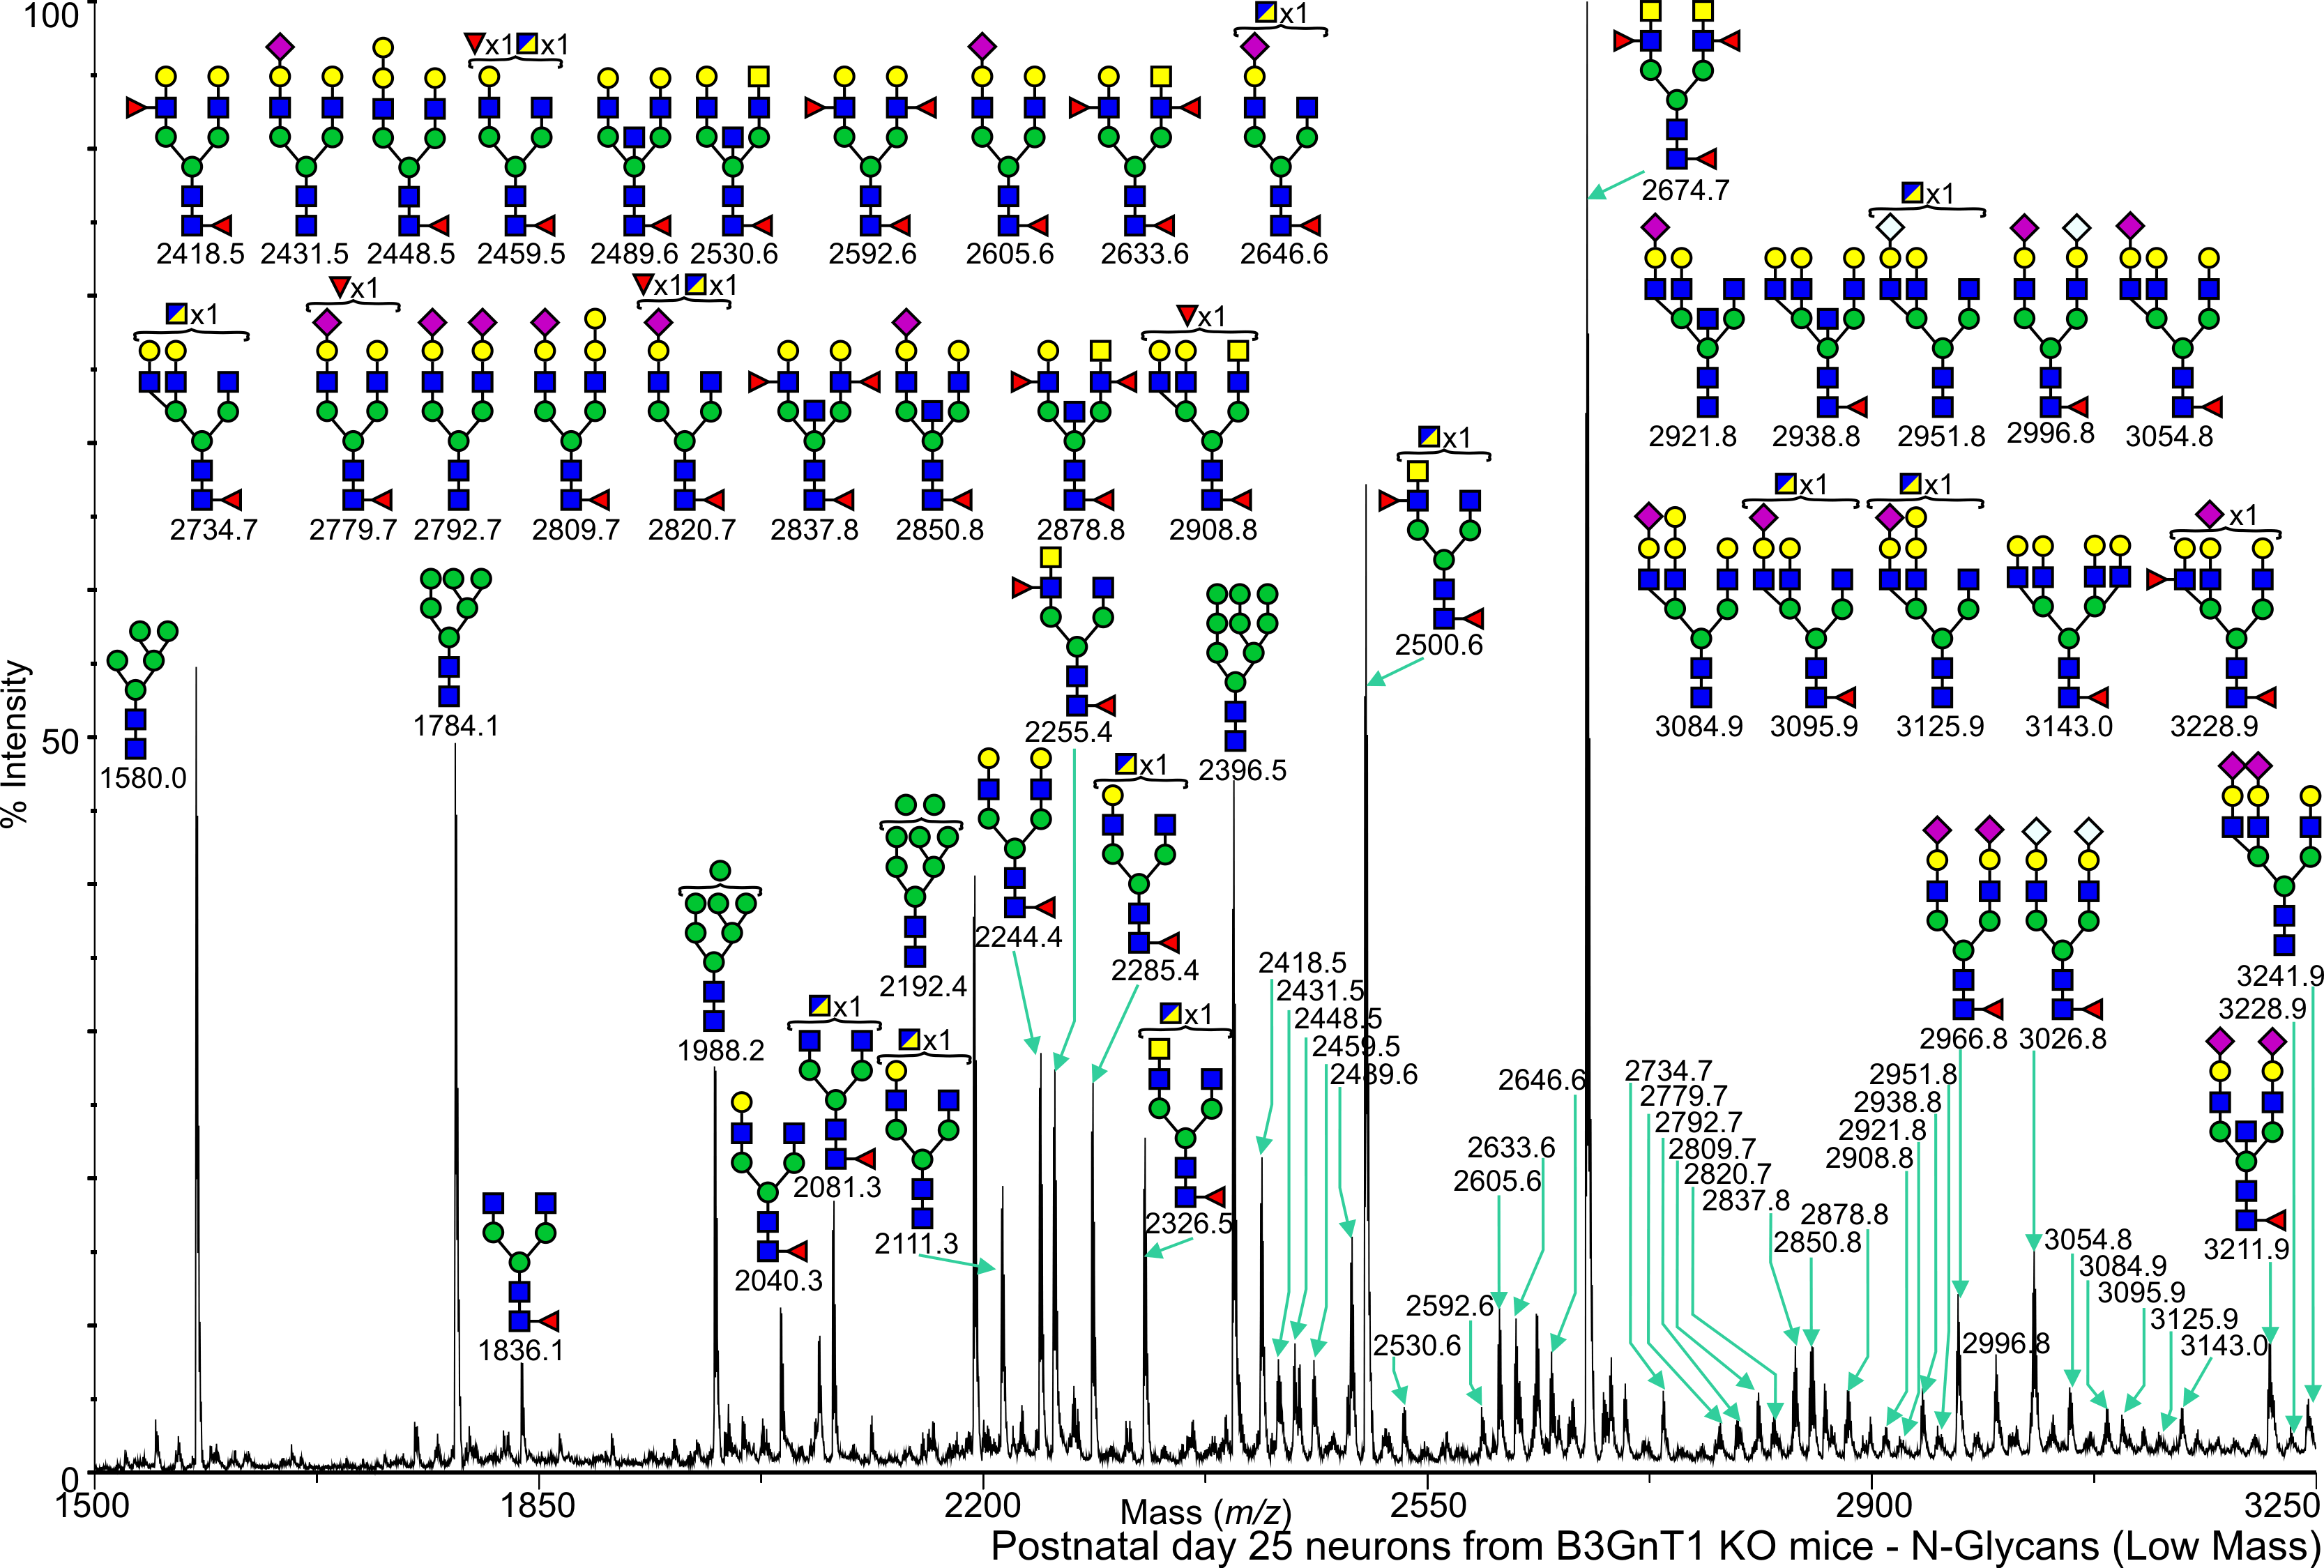
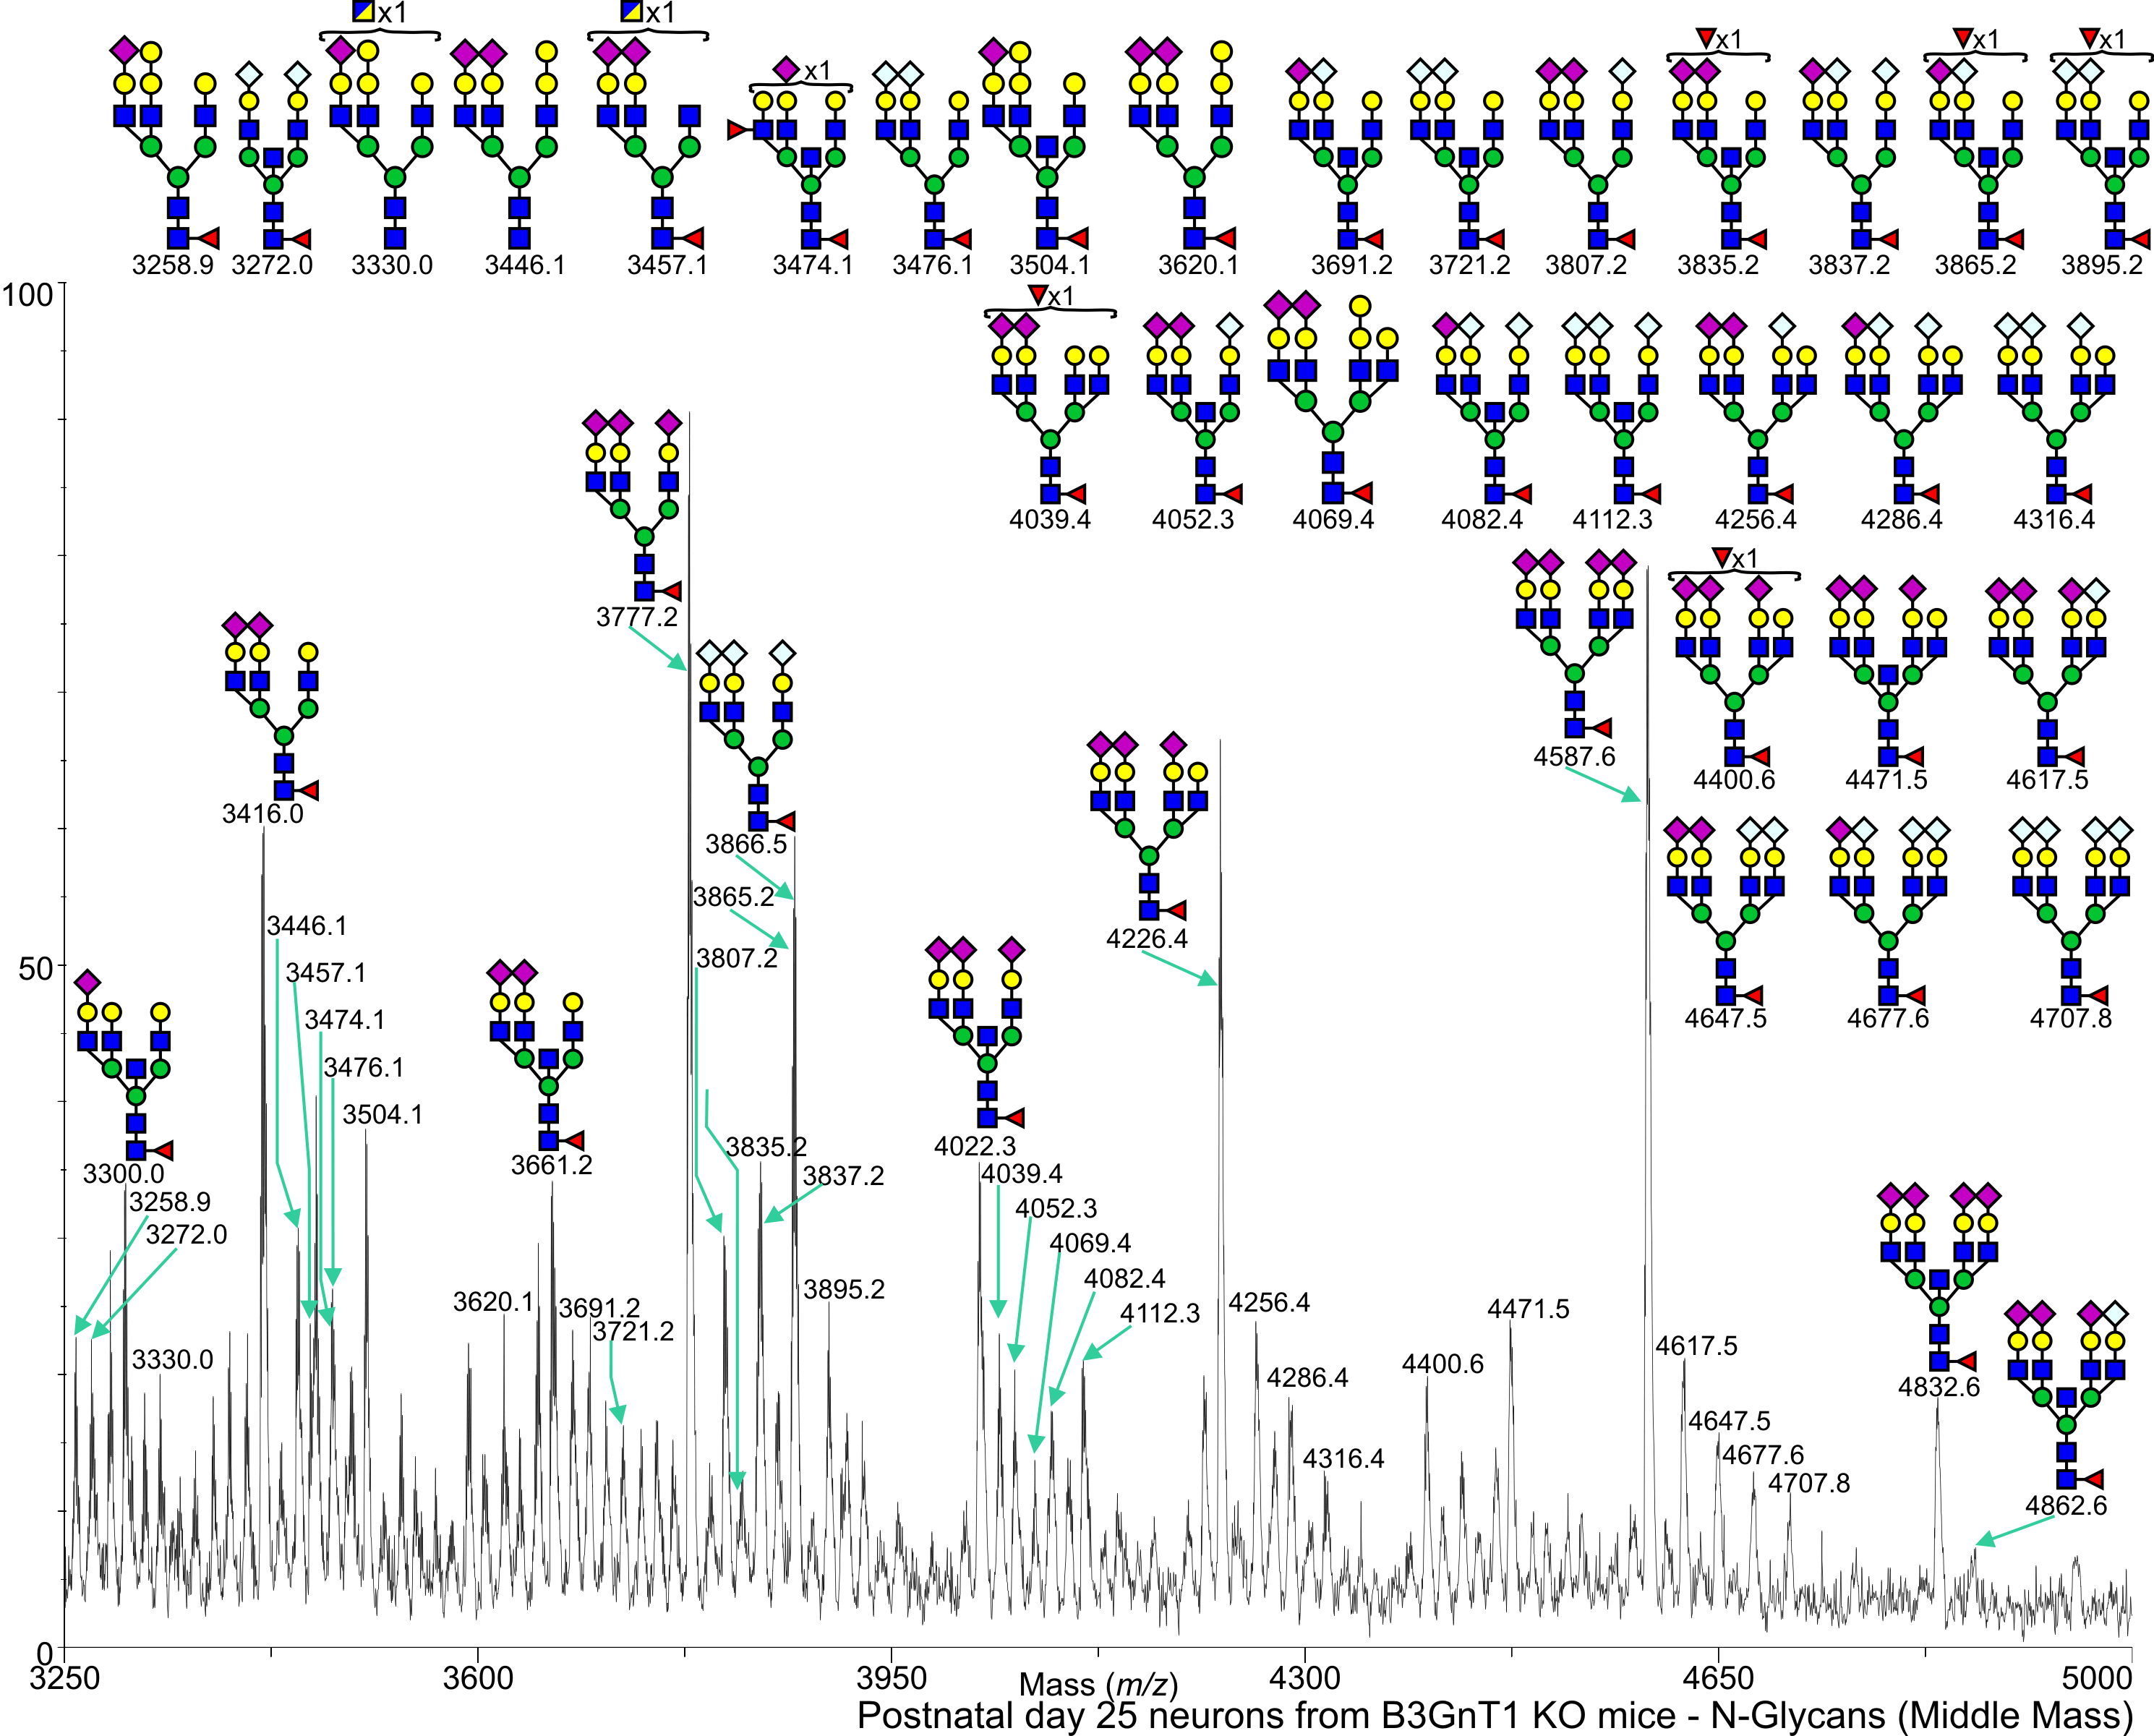
Mouse Postnatal day 25 neurons from B3GnT1 KO mice N-Linked Henion, Timothy View experimental details      
Annotated file for lower mass range in JPG formatAnnotated file for higher mass range in JPG format Annotated file for lower mass range in PDF formatAnnotated file for higher mass range in PDF format
View Mass Spectrum data as text View Mass Peak file   Interactive Mass Spectrum Viewer
cfg_rRequest_447
Mouse Postnatal day 25 neurons from B3GnT1 KO mice O-Linked Henion, Timothy View experimental details      
Annotated file in JPG format Annotated file in PDF format
View Mass Spectrum data as text View Mass Peak file   Interactive Mass Spectrum Viewer
cfg_rRequest_447
Mouse Wild Type Heart (Atrial myocytes) Atrial myocytes of newborn mice (NA) N-Linked C57BL/6 Bennett, Eric View experimental details      
Annotated file for lower mass range in JPG formatAnnotated file for higher mass range in JPG format Annotated file for lower mass range in PDF formatAnnotated file for higher mass range in PDF format
View Mass Spectrum data as text View Mass Peak file   Interactive Mass Spectrum Viewer
cfg_rRequest_279
Mouse Wild Type Heart (Atrial myocytes) Adult murine atrial myocytes (AA) N-Linked C57BL/6 Bennett, Eric View experimental details      
Annotated file for lower mass range in JPG formatAnnotated file for higher mass range in JPG format Annotated file for lower mass range in PDF formatAnnotated file for higher mass range in PDF format
View Mass Spectrum data as text View Mass Peak file View MS-MS files Interactive Mass Spectrum Viewer
cfg_rRequest_279
Mouse Wild Type Heart (ventricular myocytes) Newborn murine ventricular myocytes N-Linked C57BL/6 Bennett, Eric View experimental details      
Annotated file in JPG format Annotated file in PDF format
View Mass Spectrum data as text View Mass Peak file   Interactive Mass Spectrum Viewer
cfg_rRequest_279
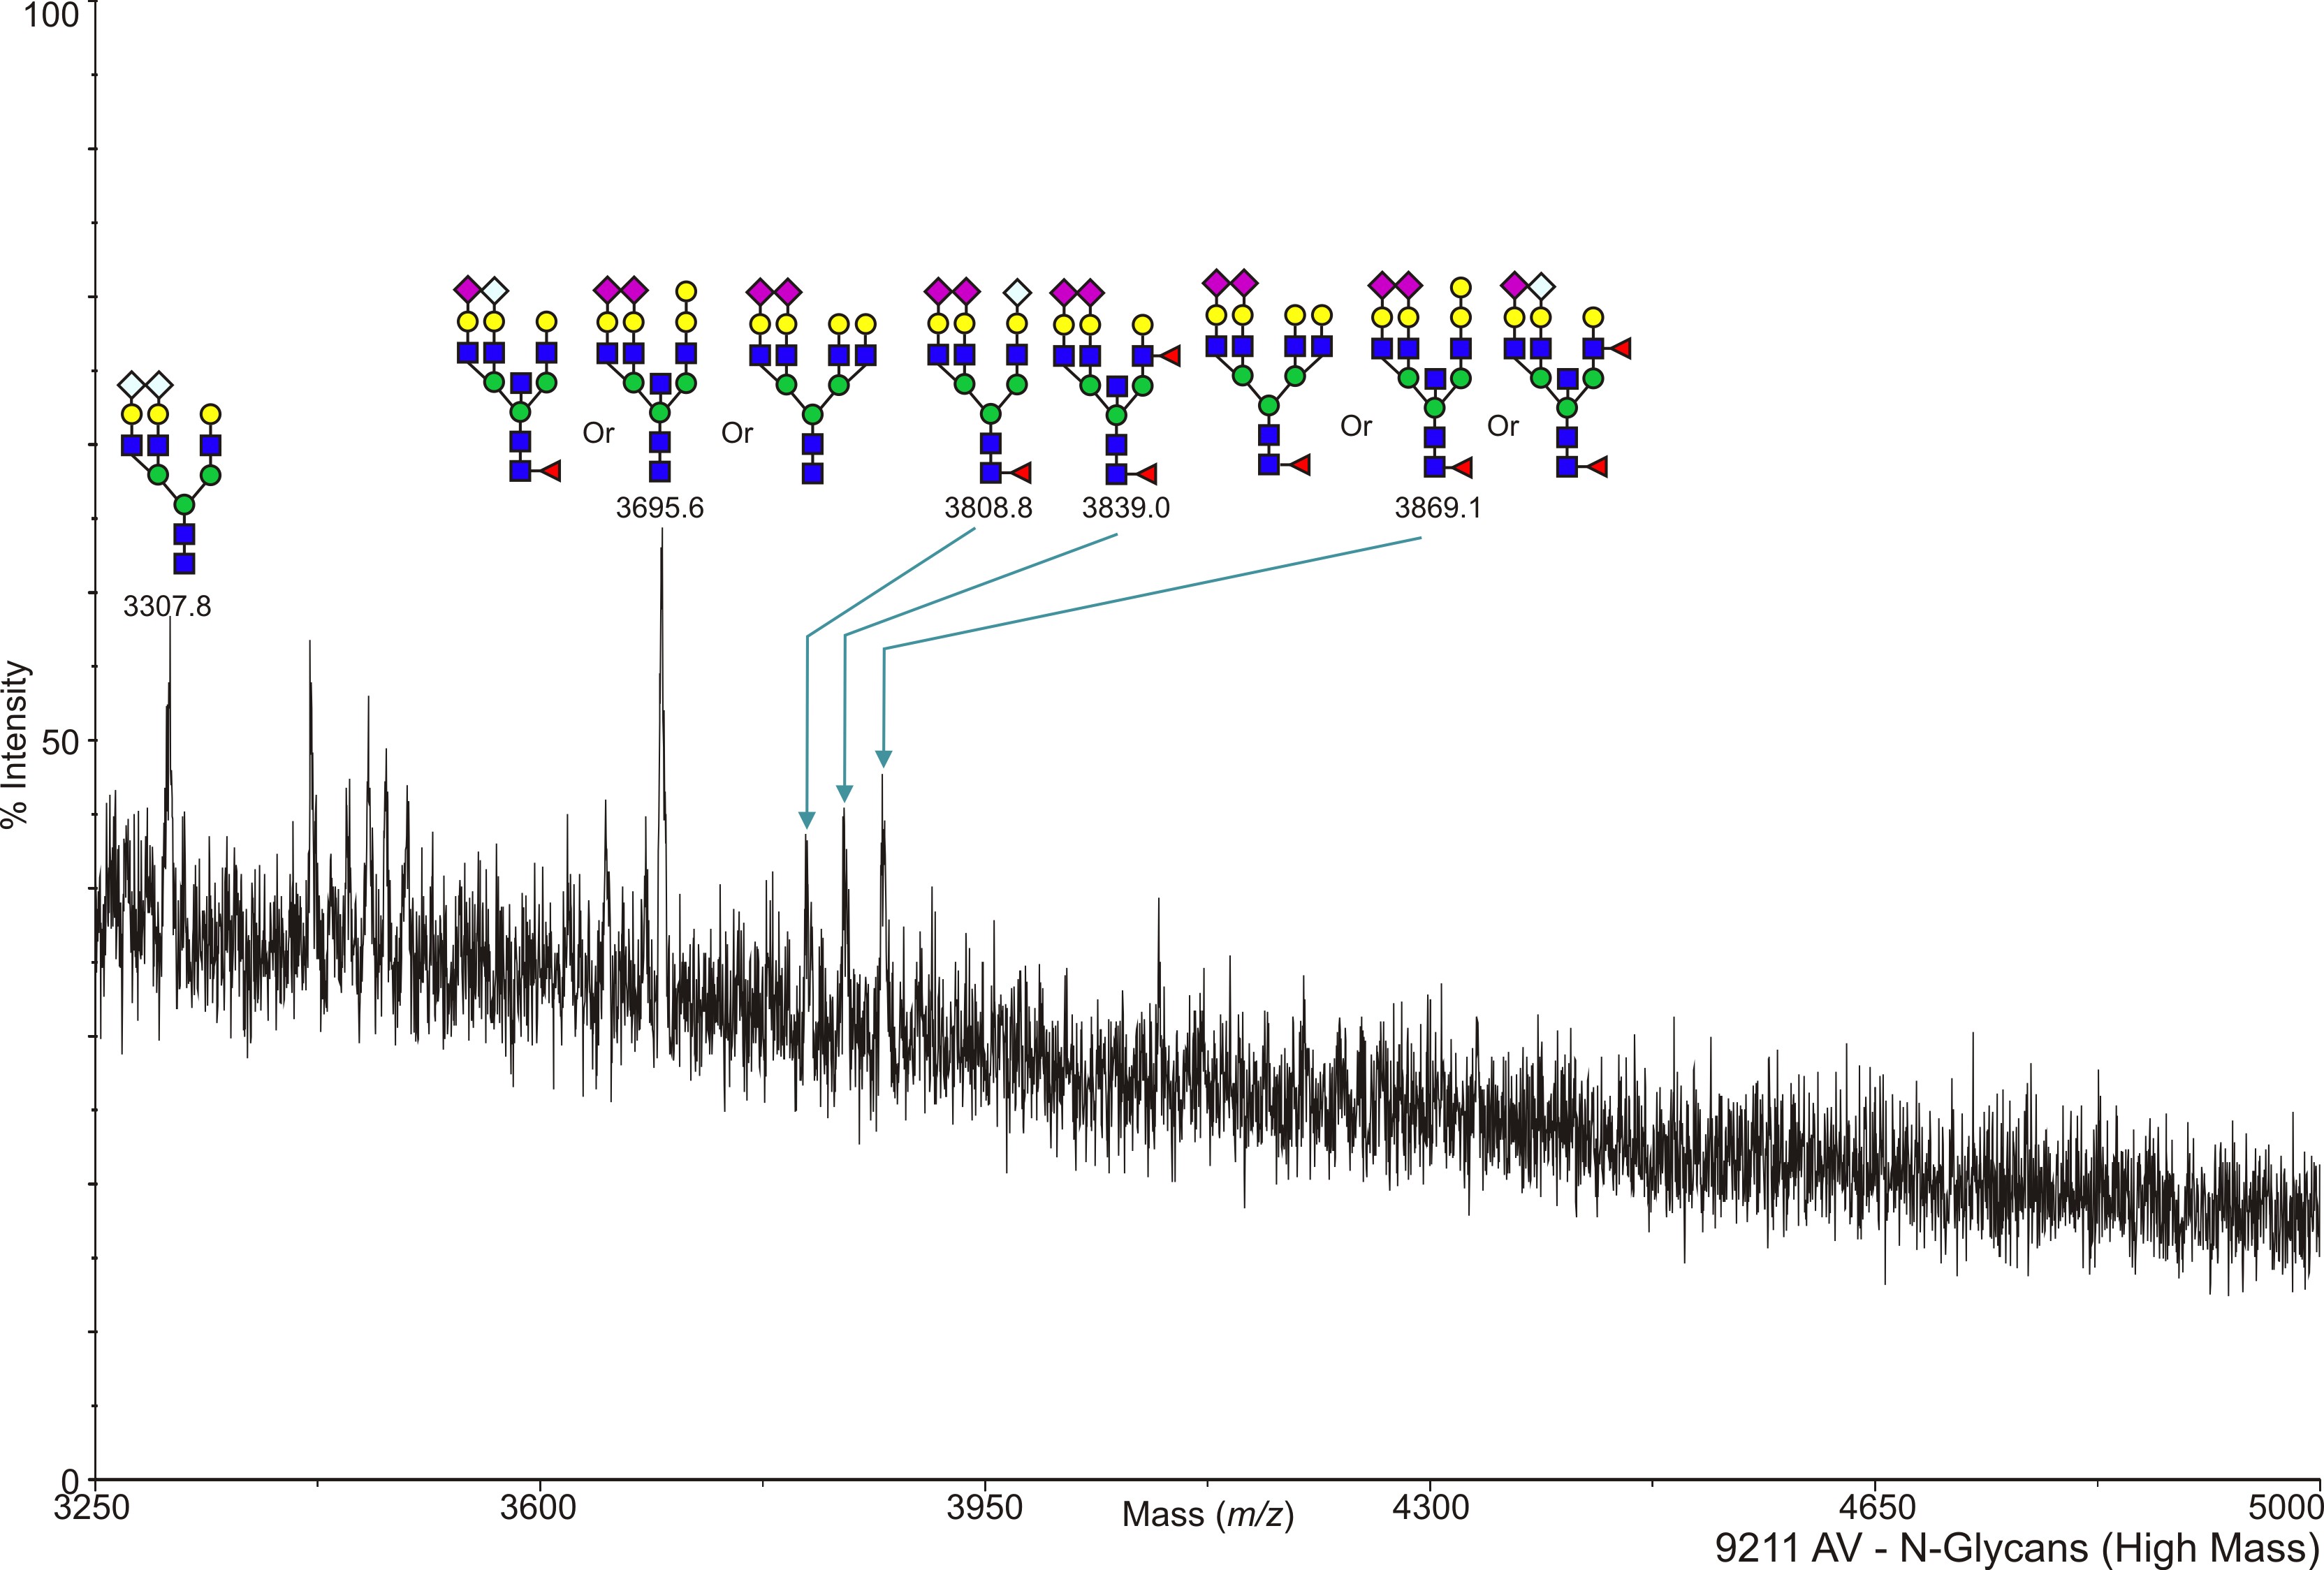
Mouse Wild Type Heart (ventricular myocytes) Adult murine ventricular myocytes (AV) N-Linked C57BL/6 Bennett, Eric View experimental details      
Annotated file for lower mass range in JPG formatAnnotated file for higher mass range in JPG format Annotated file for lower mass range in PDF formatAnnotated file for higher mass range in PDF format
View Mass Spectrum data as text View Mass Peak file   Interactive Mass Spectrum Viewer
cfg_rRequest_279
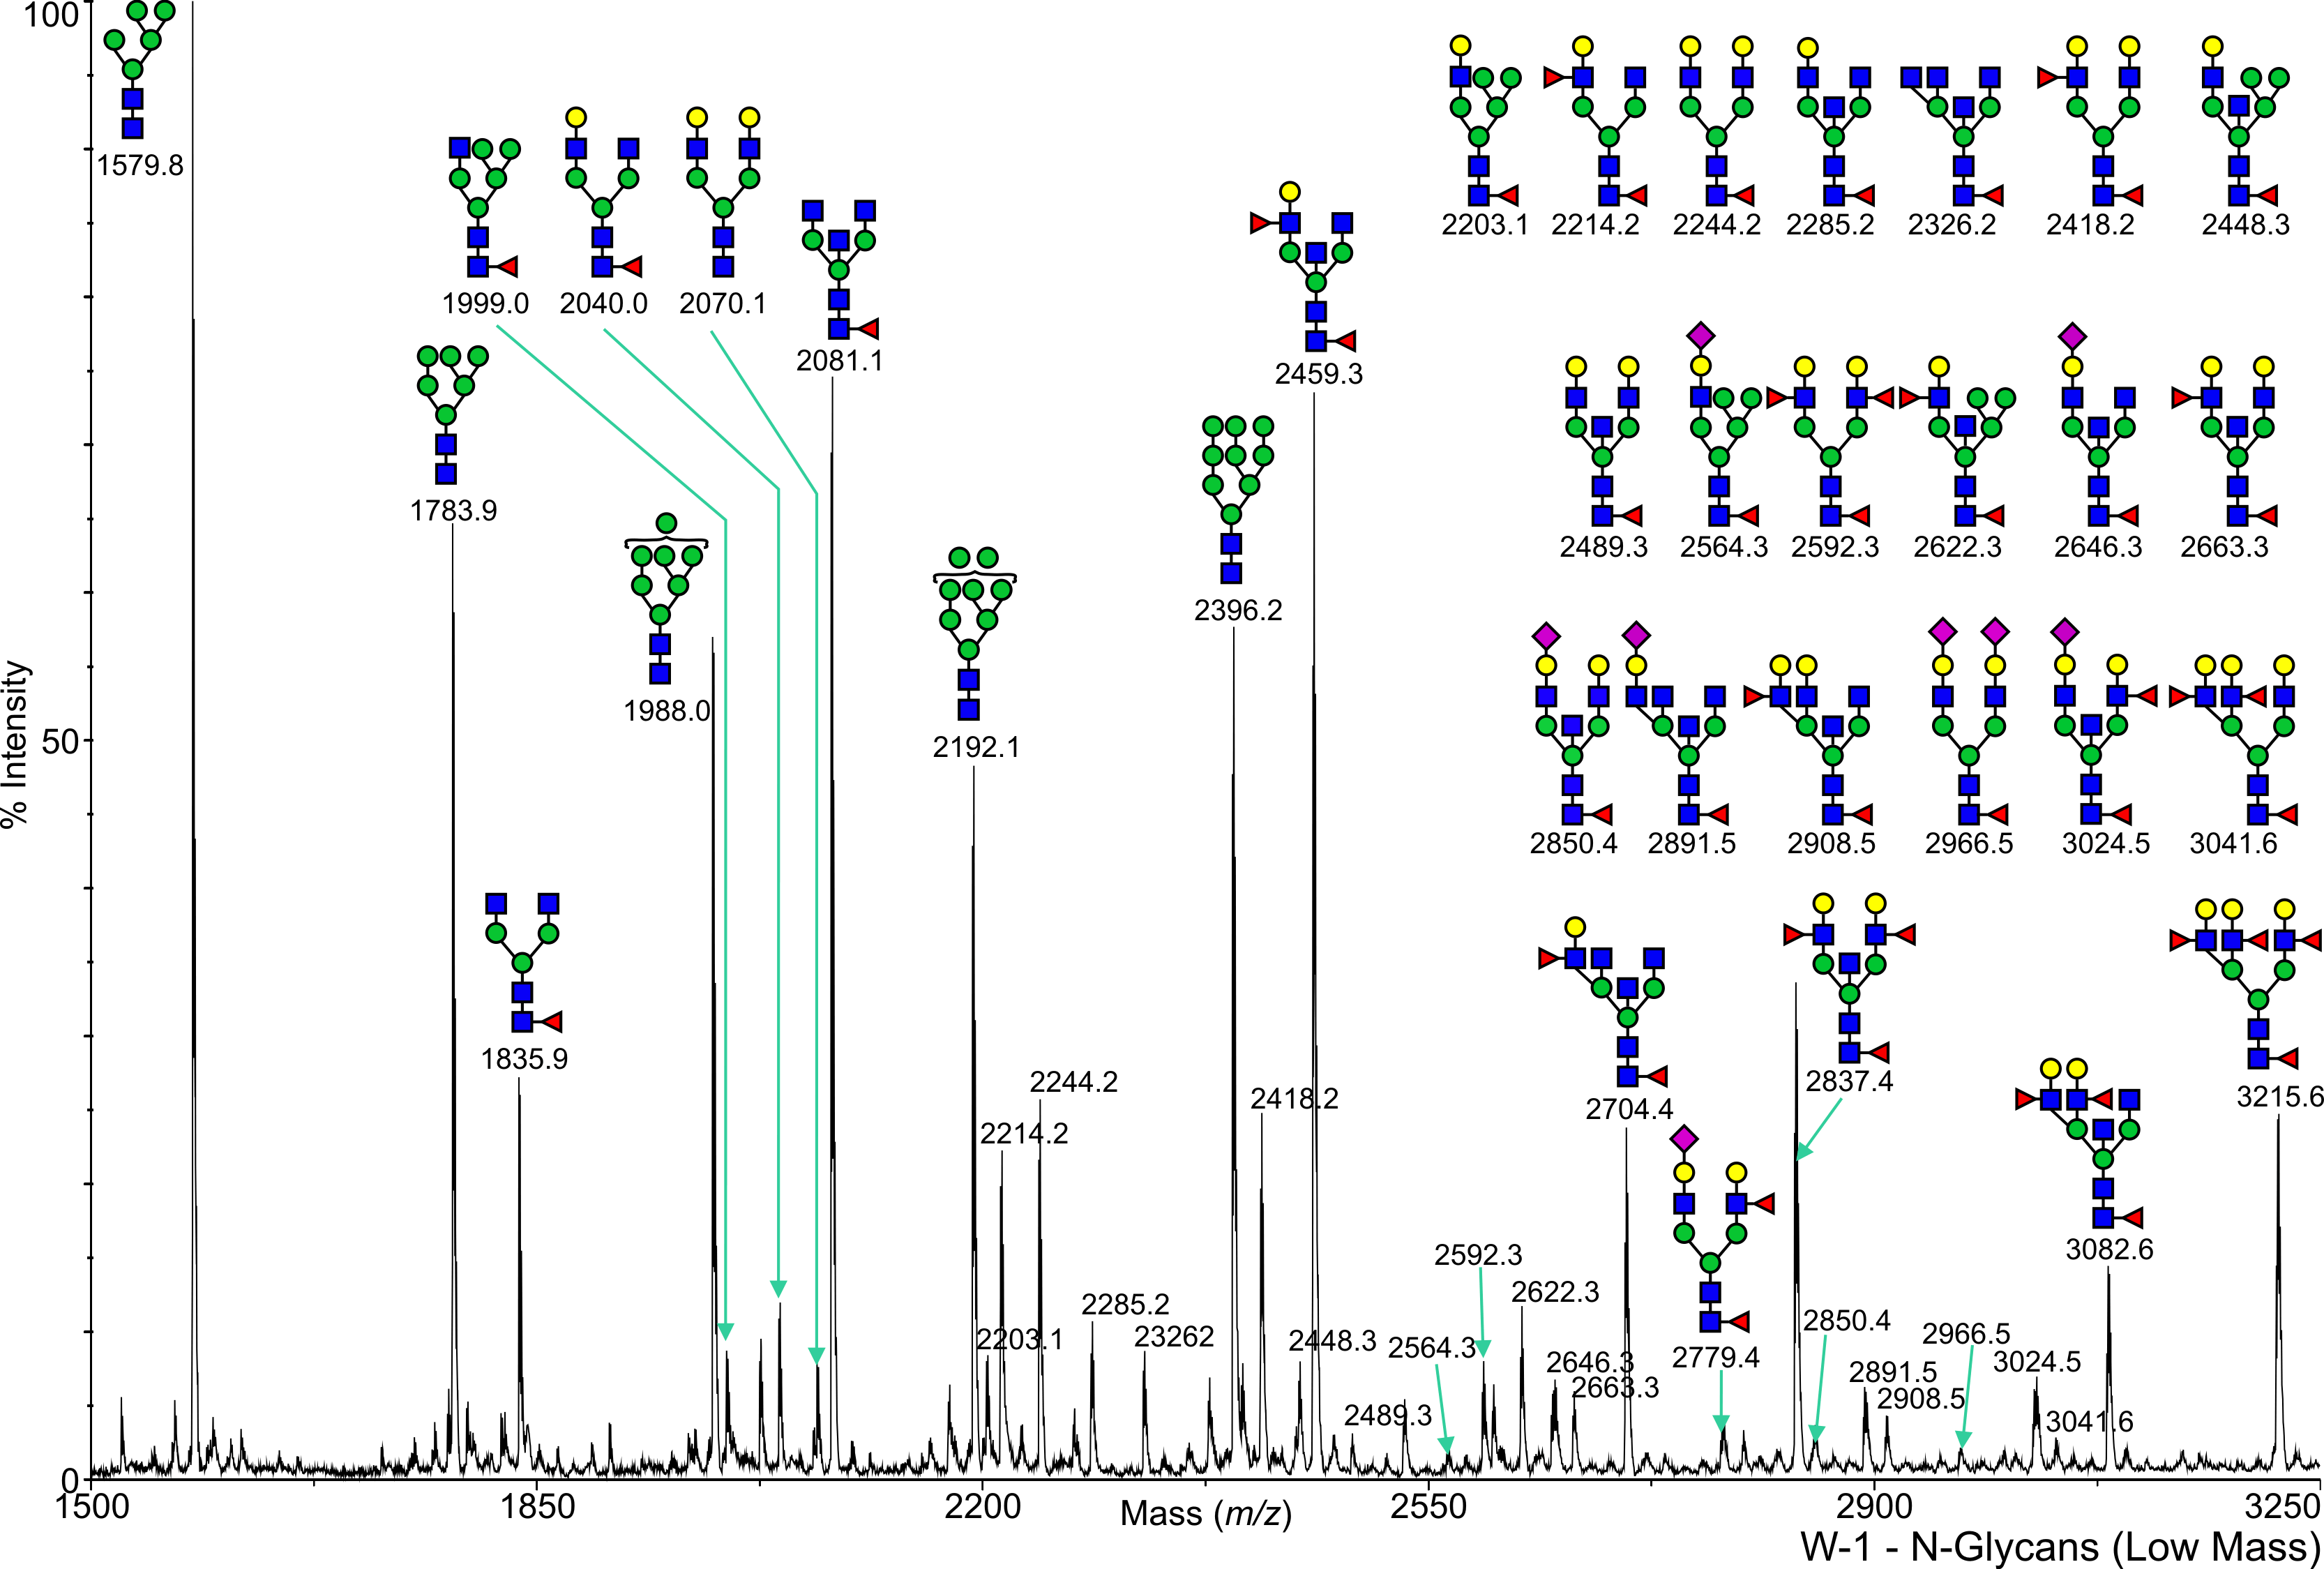
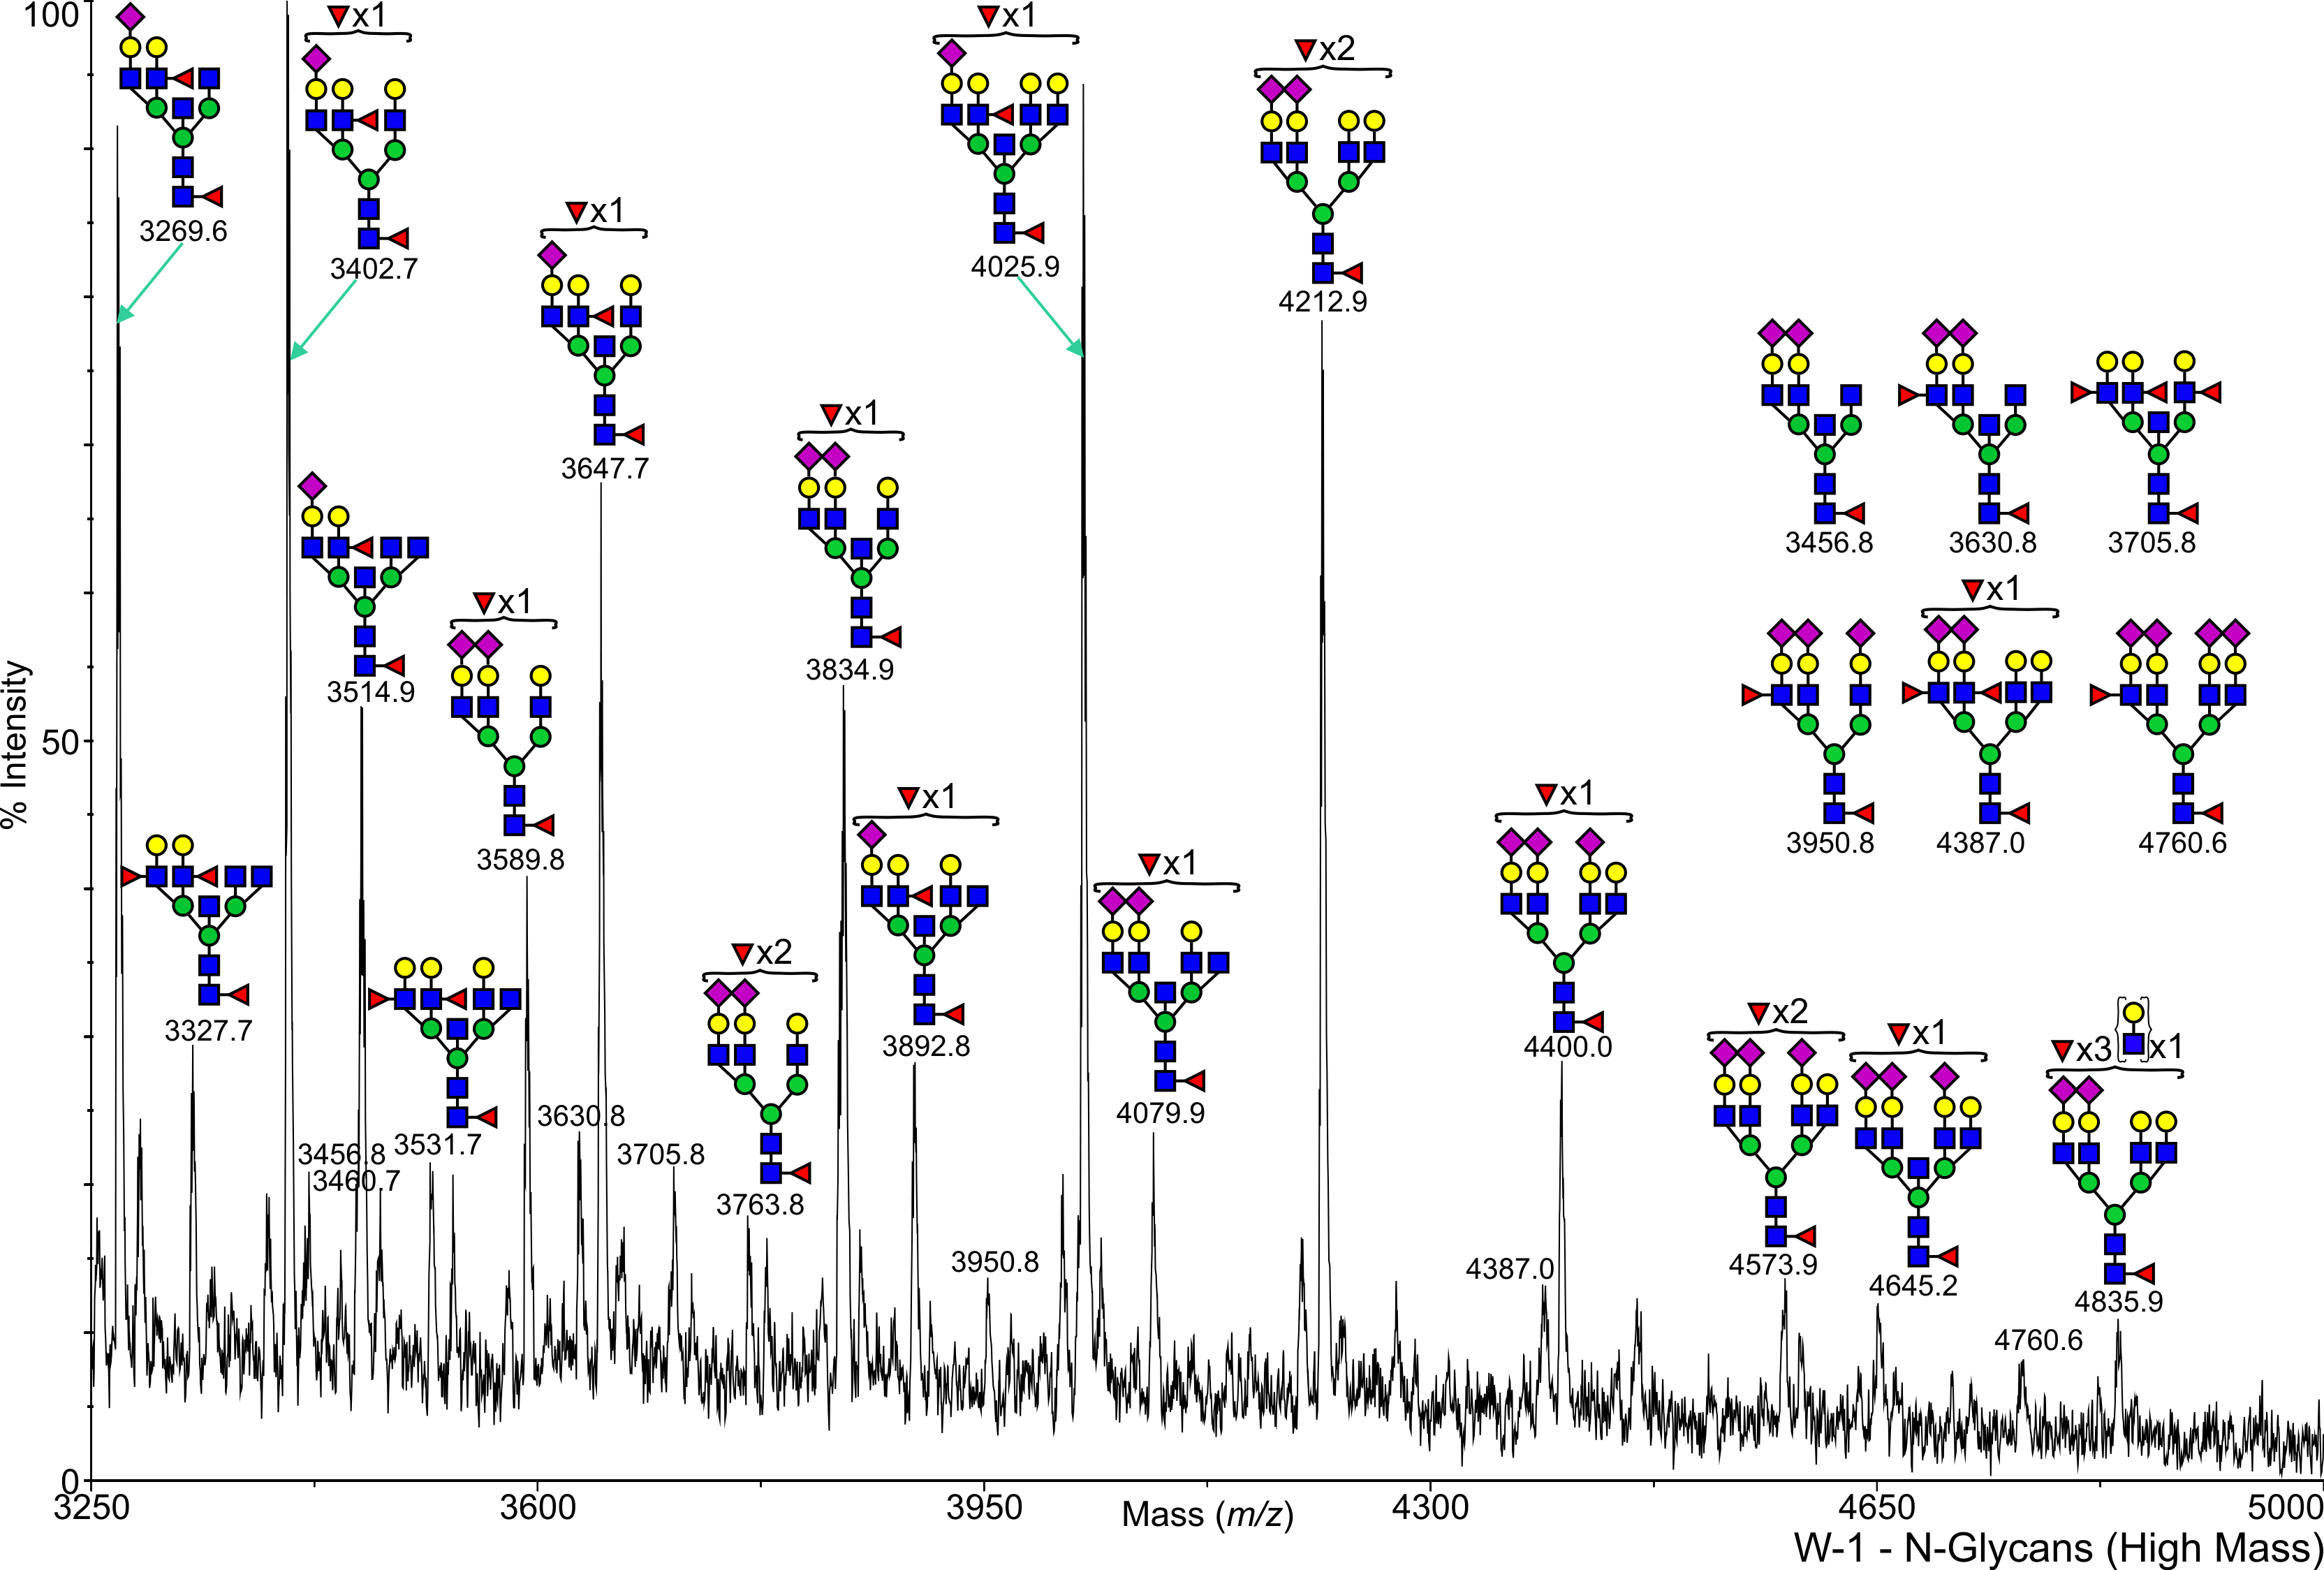
Mouse Wild Type Brain W1 N-Linked C57BL/6 Paulson, Henry View experimental details      
Annotated file for lower mass range in JPG formatAnnotated file for higher mass range in JPG format Annotated file for lower mass range in PDF formatAnnotated file for higher mass range in PDF format
View Mass Spectrum data as text View Mass Peak file   Interactive Mass Spectrum Viewer
cfg_rRequest_406
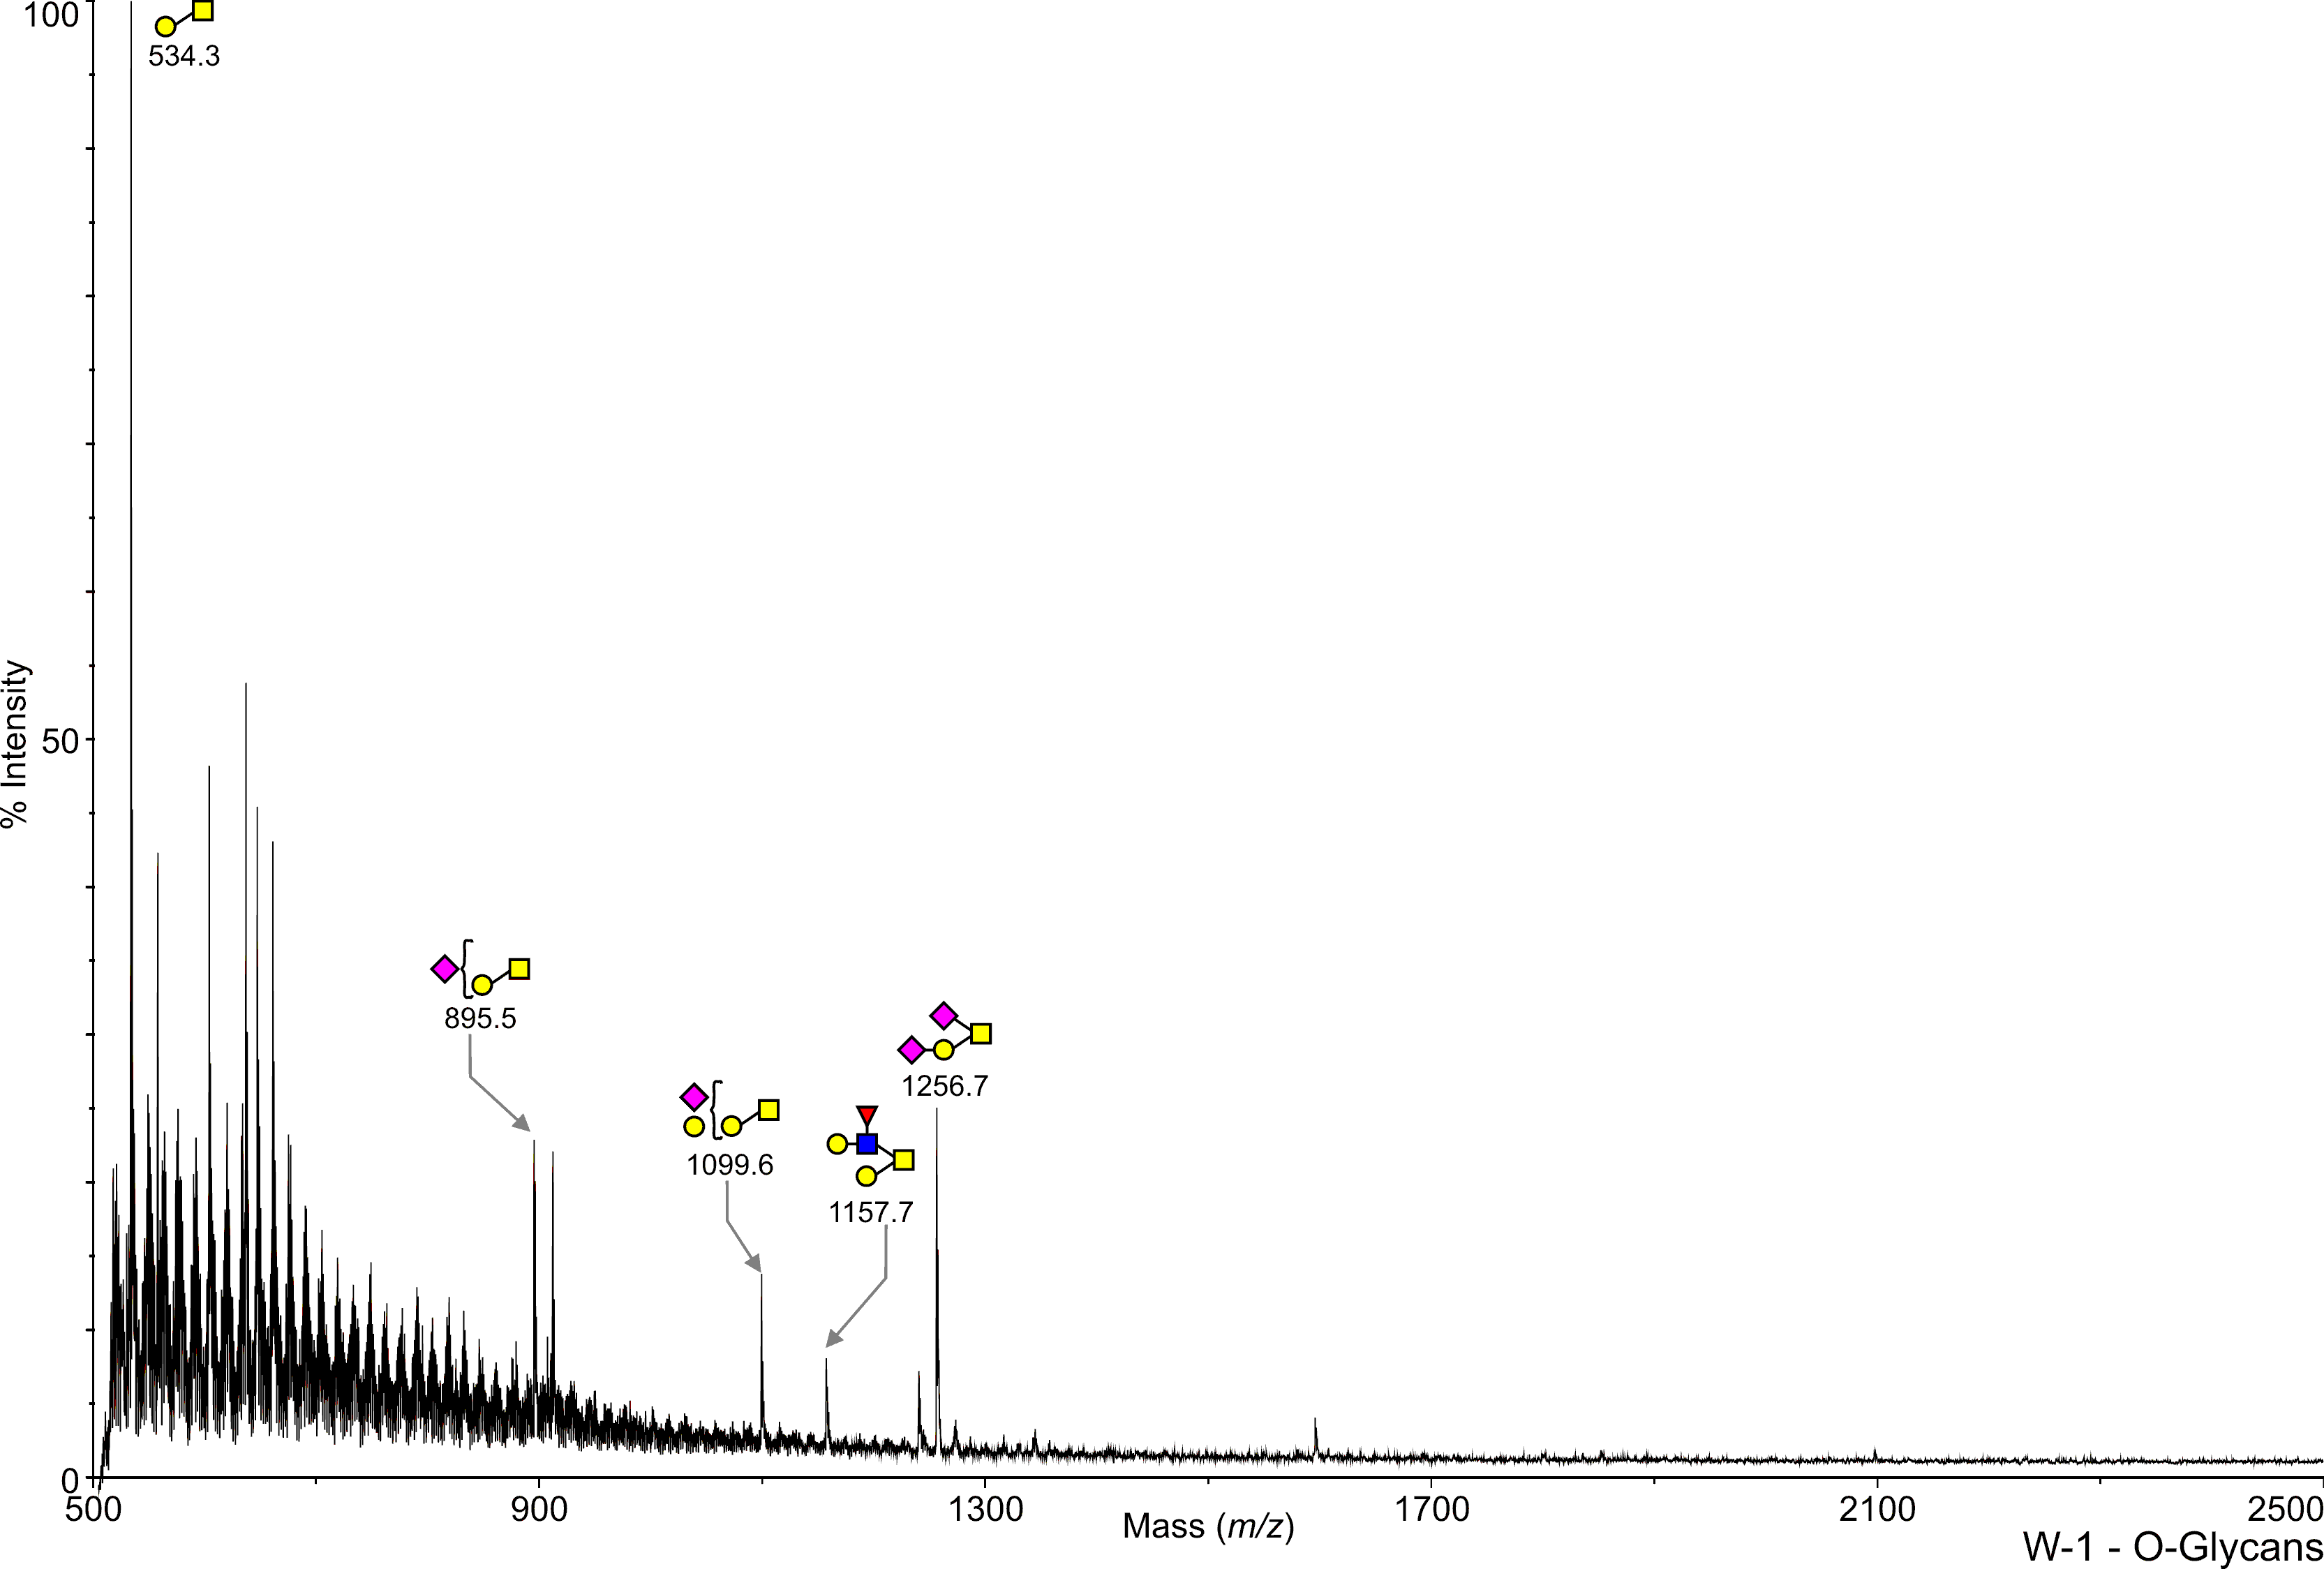
Mouse Wild Type Brain W1 O-Linked C57BL/6 Paulson, Henry View experimental details      
Annotated file in JPG format Annotated file in PDF format
View Mass Spectrum data as text View Mass Peak file   Interactive Mass Spectrum Viewer
cfg_rRequest_406
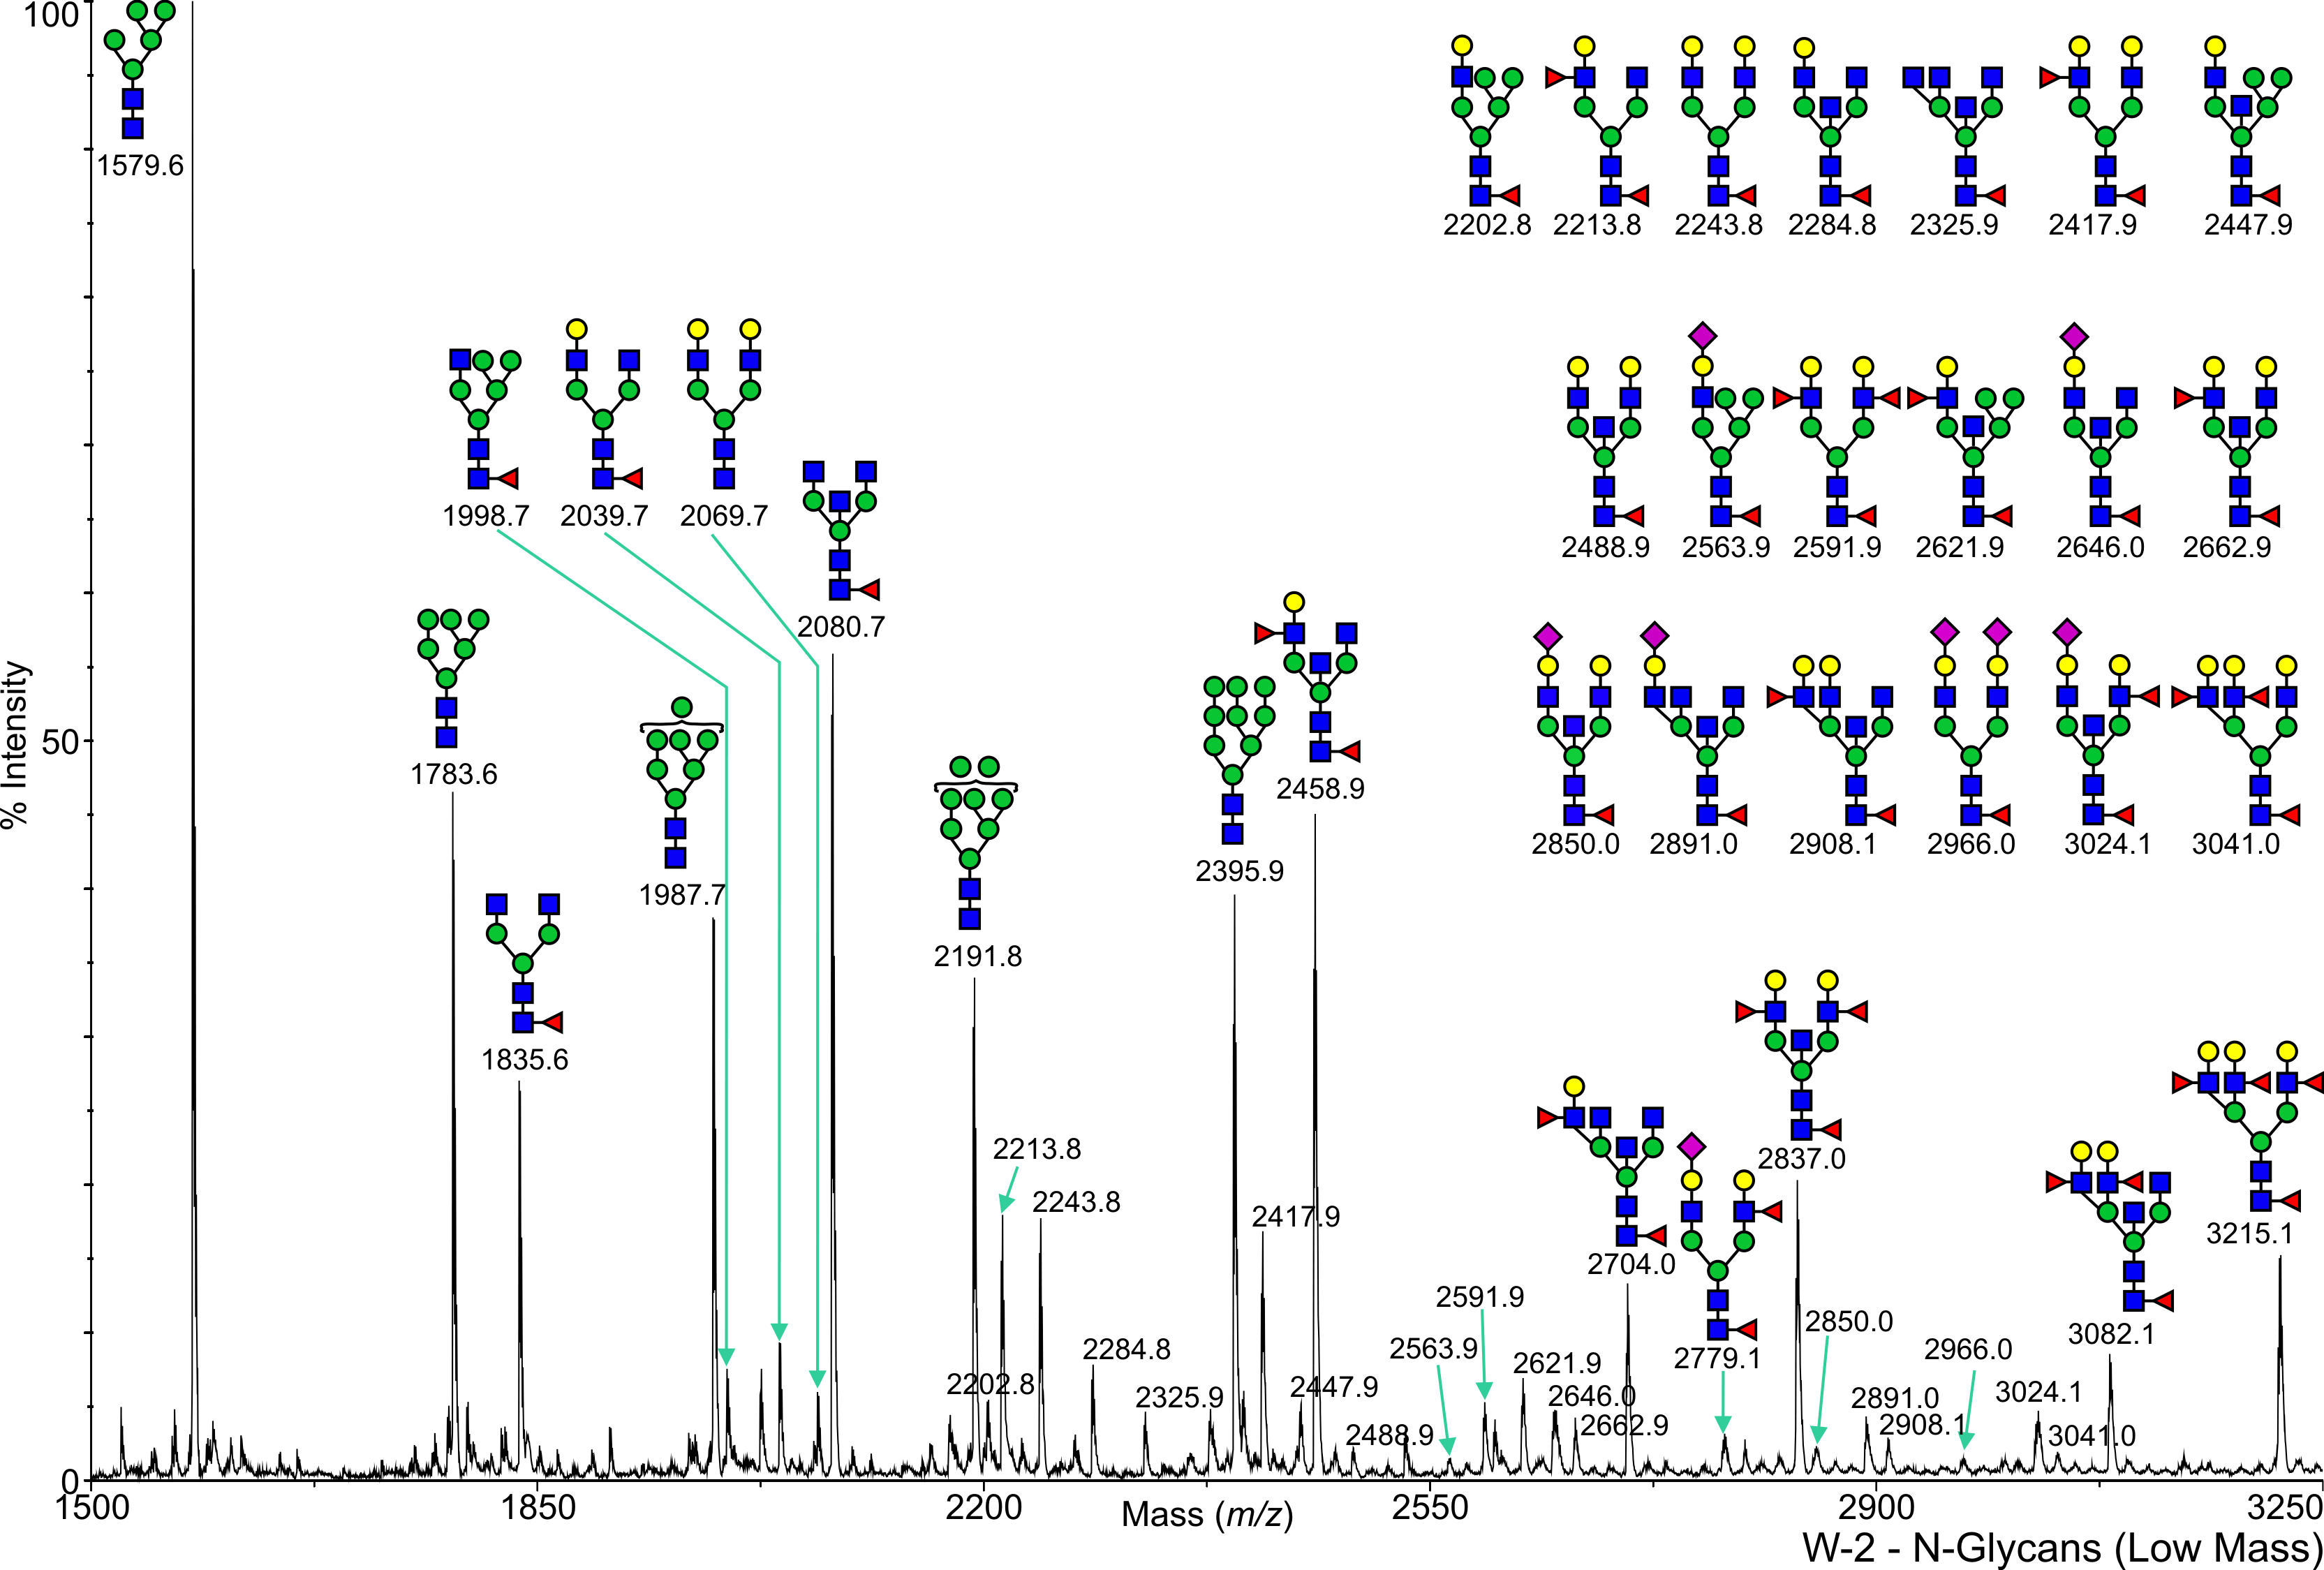
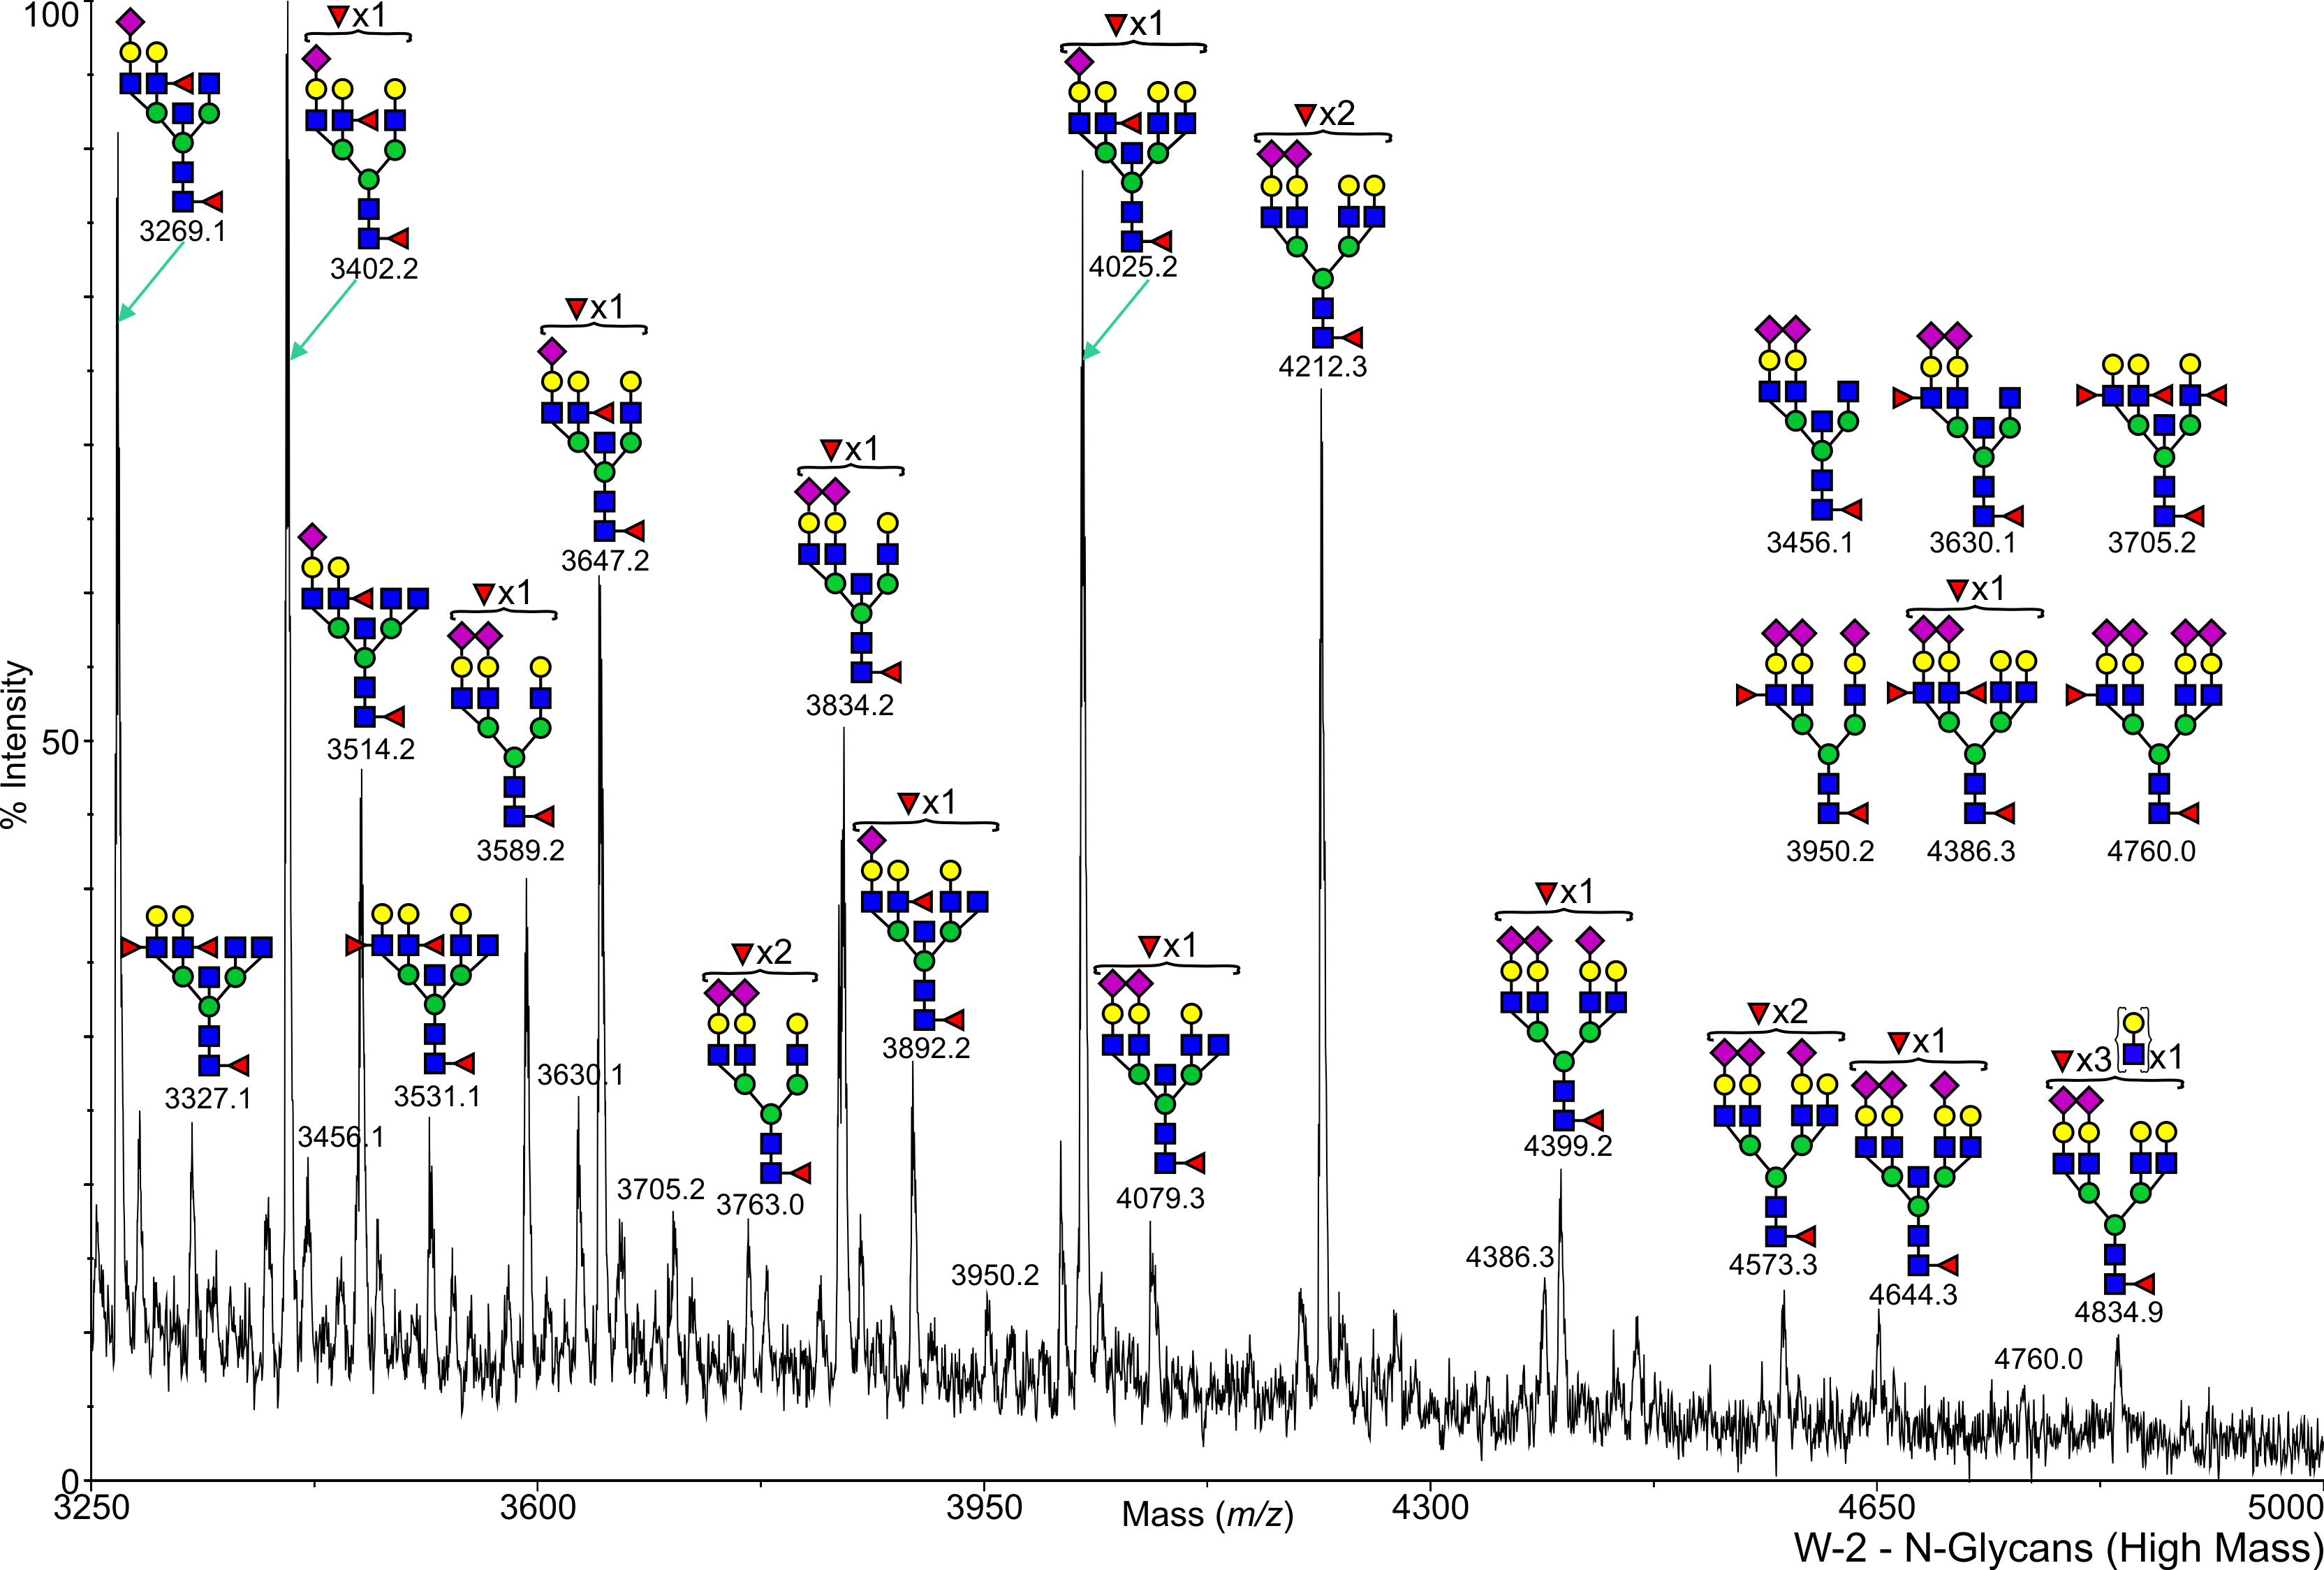
Mouse Wild Type Brain W2 N-Linked C57BL/6 Paulson, Henry View experimental details      
Annotated file for lower mass range in JPG formatAnnotated file for higher mass range in JPG format Annotated file for lower mass range in PDF formatAnnotated file for higher mass range in PDF format
View Mass Spectrum data as text View Mass Peak file   Interactive Mass Spectrum Viewer
cfg_rRequest_406
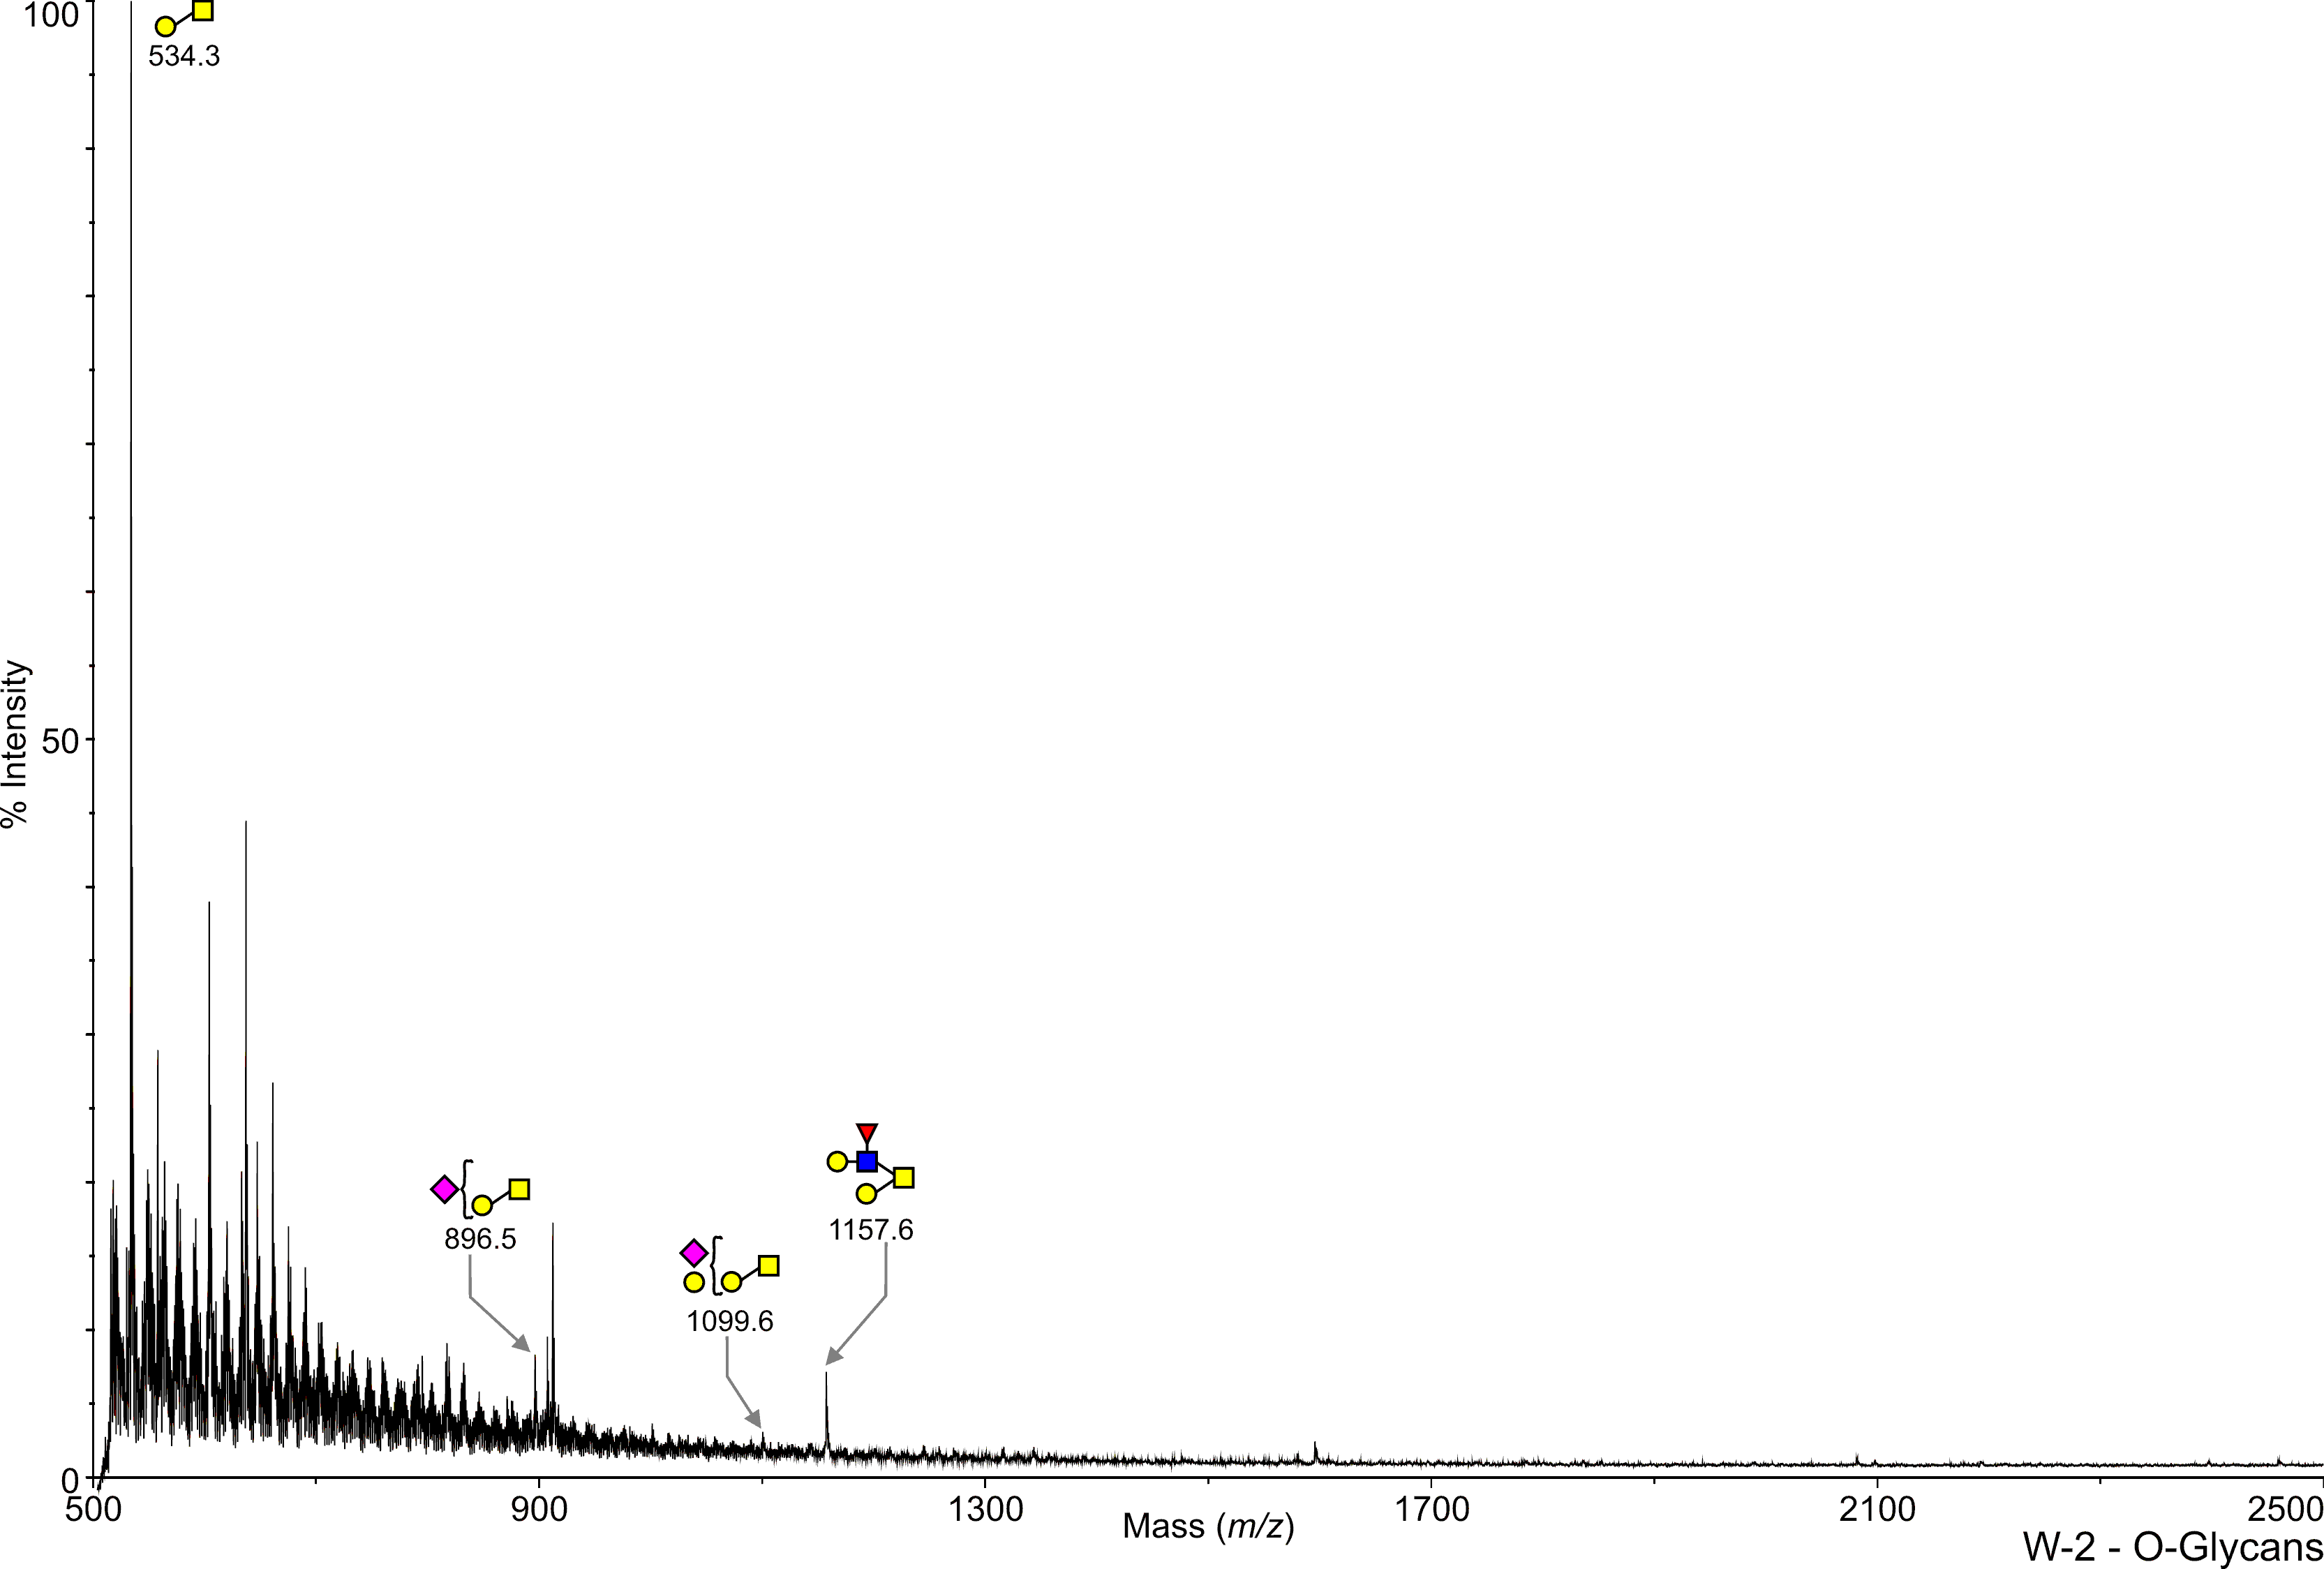
Mouse Wild Type Brain W2 O-Linked C57BL/6 Paulson, Henry View experimental details      
Annotated file in JPG format Annotated file in PDF format
View Mass Spectrum data as text View Mass Peak file   Interactive Mass Spectrum Viewer
cfg_rRequest_406
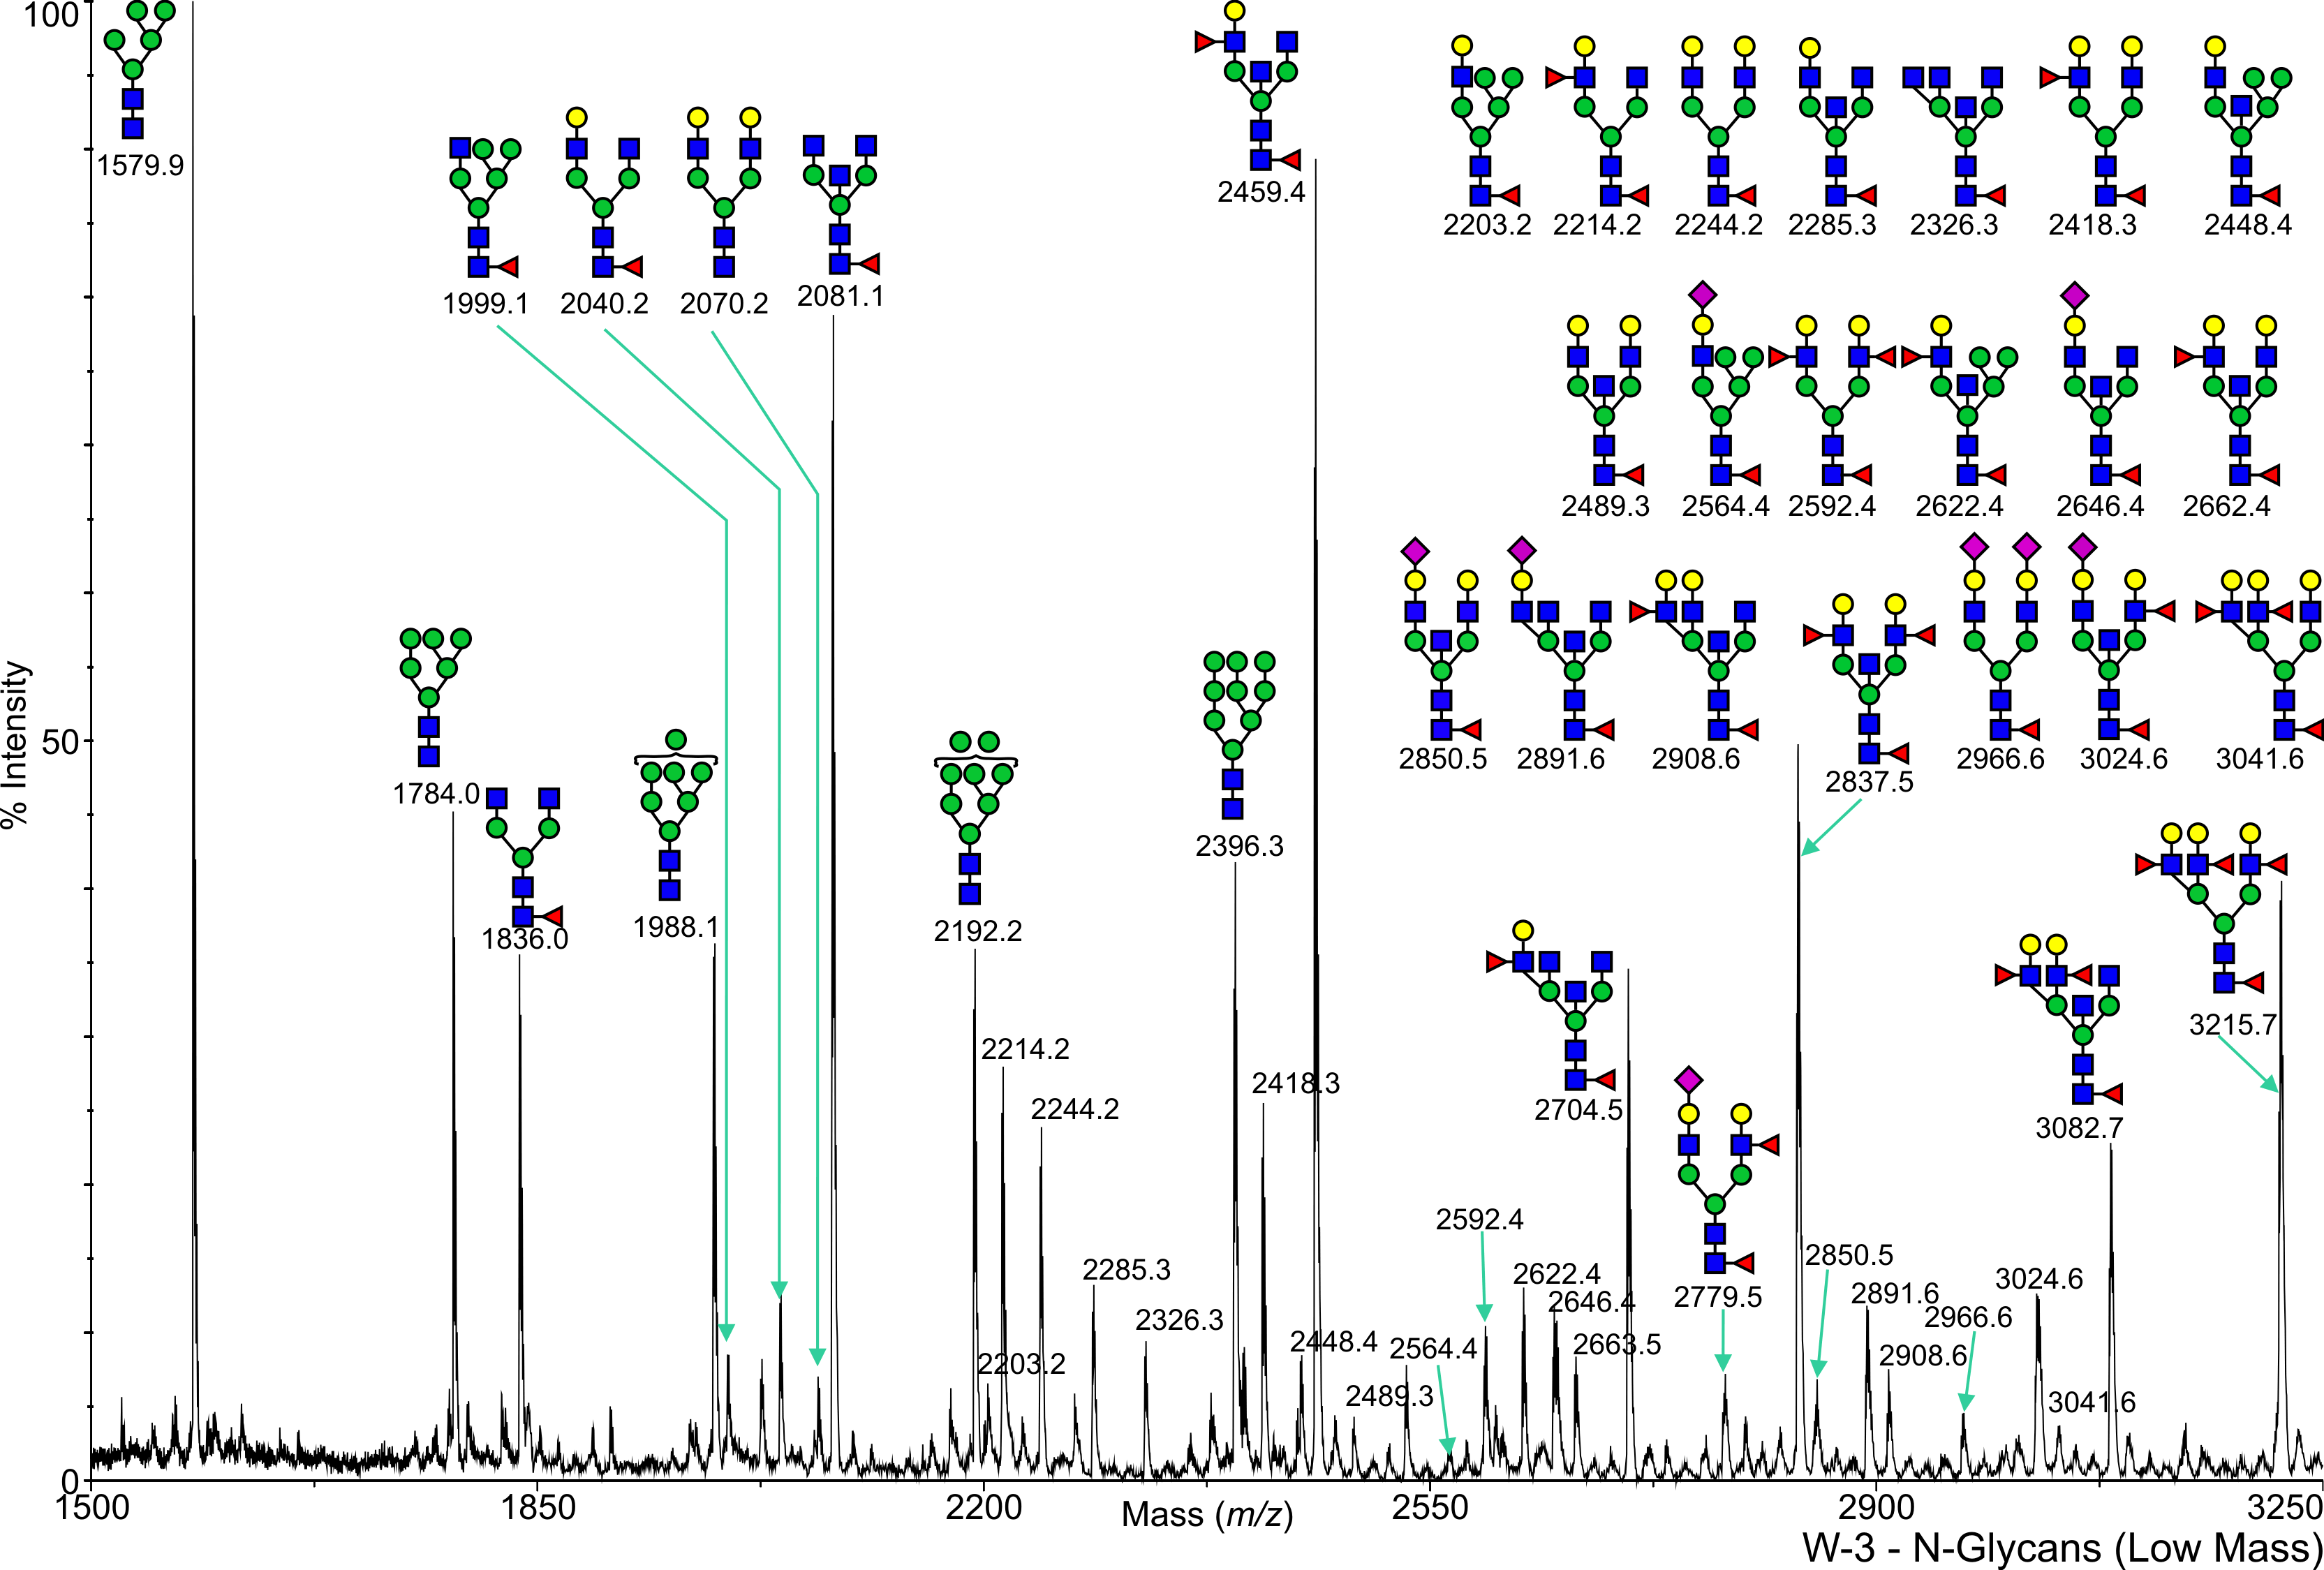
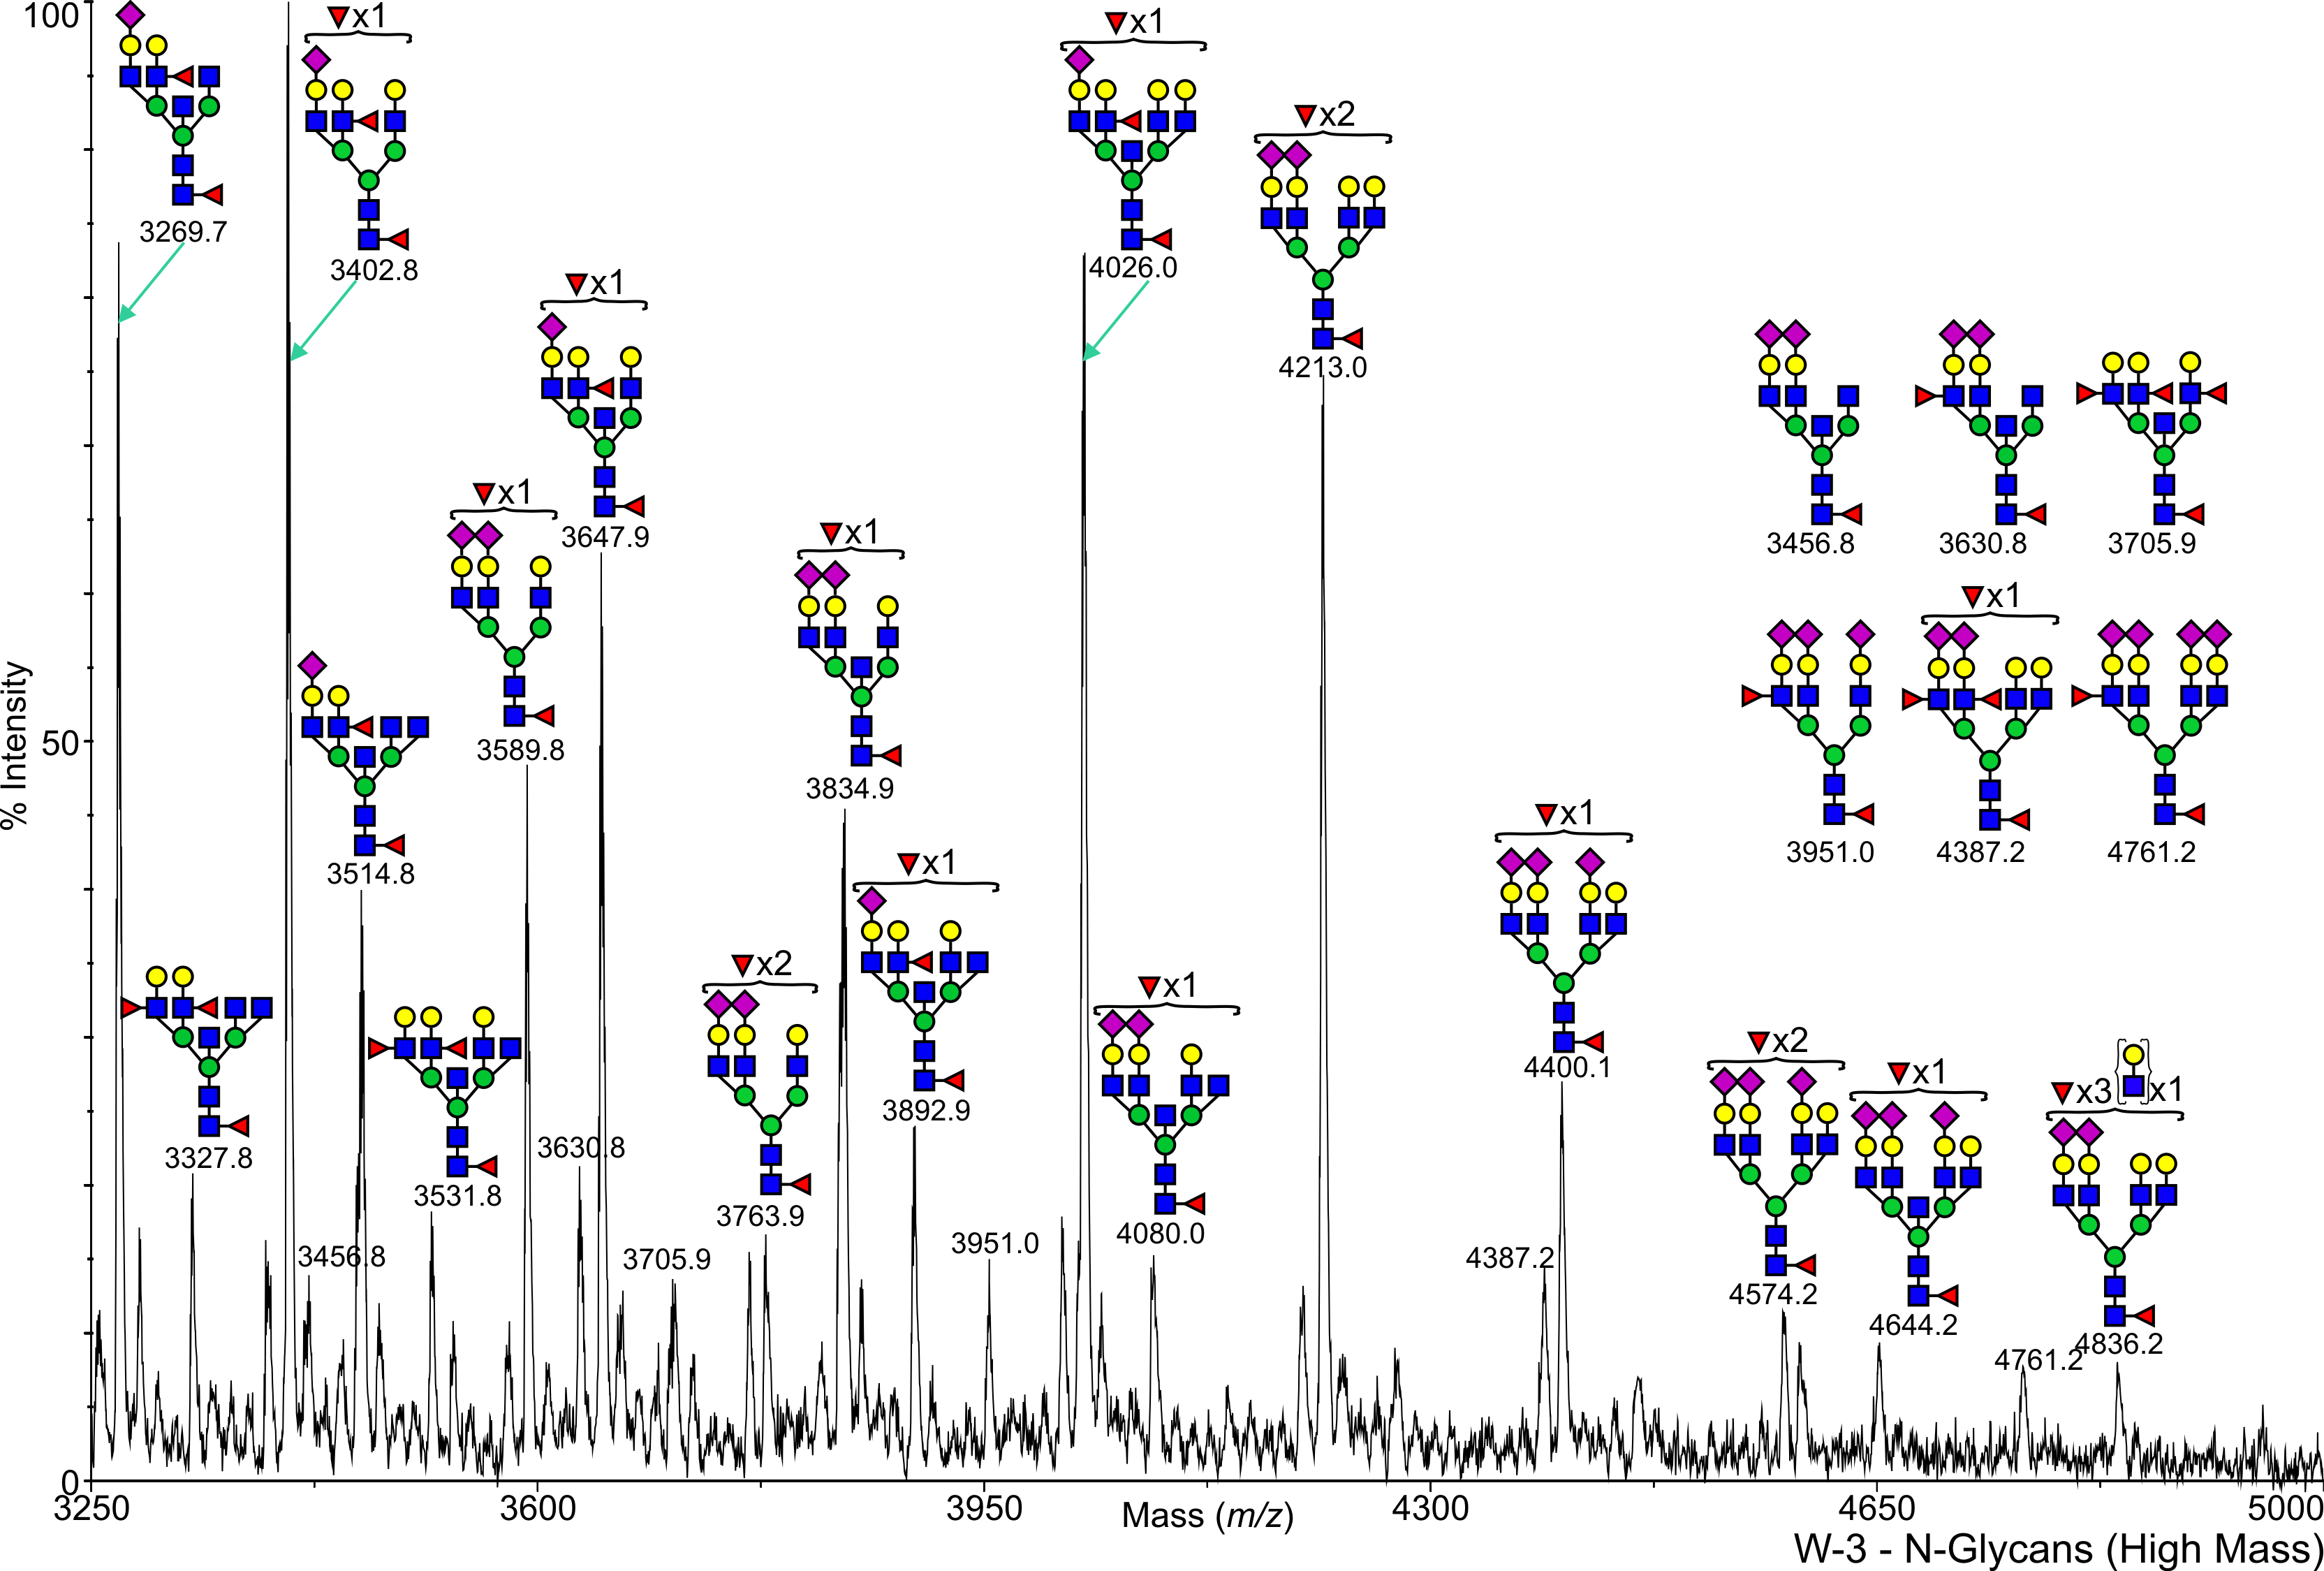
Mouse Wild Type Brain W3 N-Linked C57BL/6 Paulson, Henry View experimental details      
Annotated file for lower mass range in JPG formatAnnotated file for higher mass range in JPG format Annotated file for lower mass range in PDF formatAnnotated file for higher mass range in PDF format
View Mass Spectrum data as text View Mass Peak file   Interactive Mass Spectrum Viewer
cfg_rRequest_406
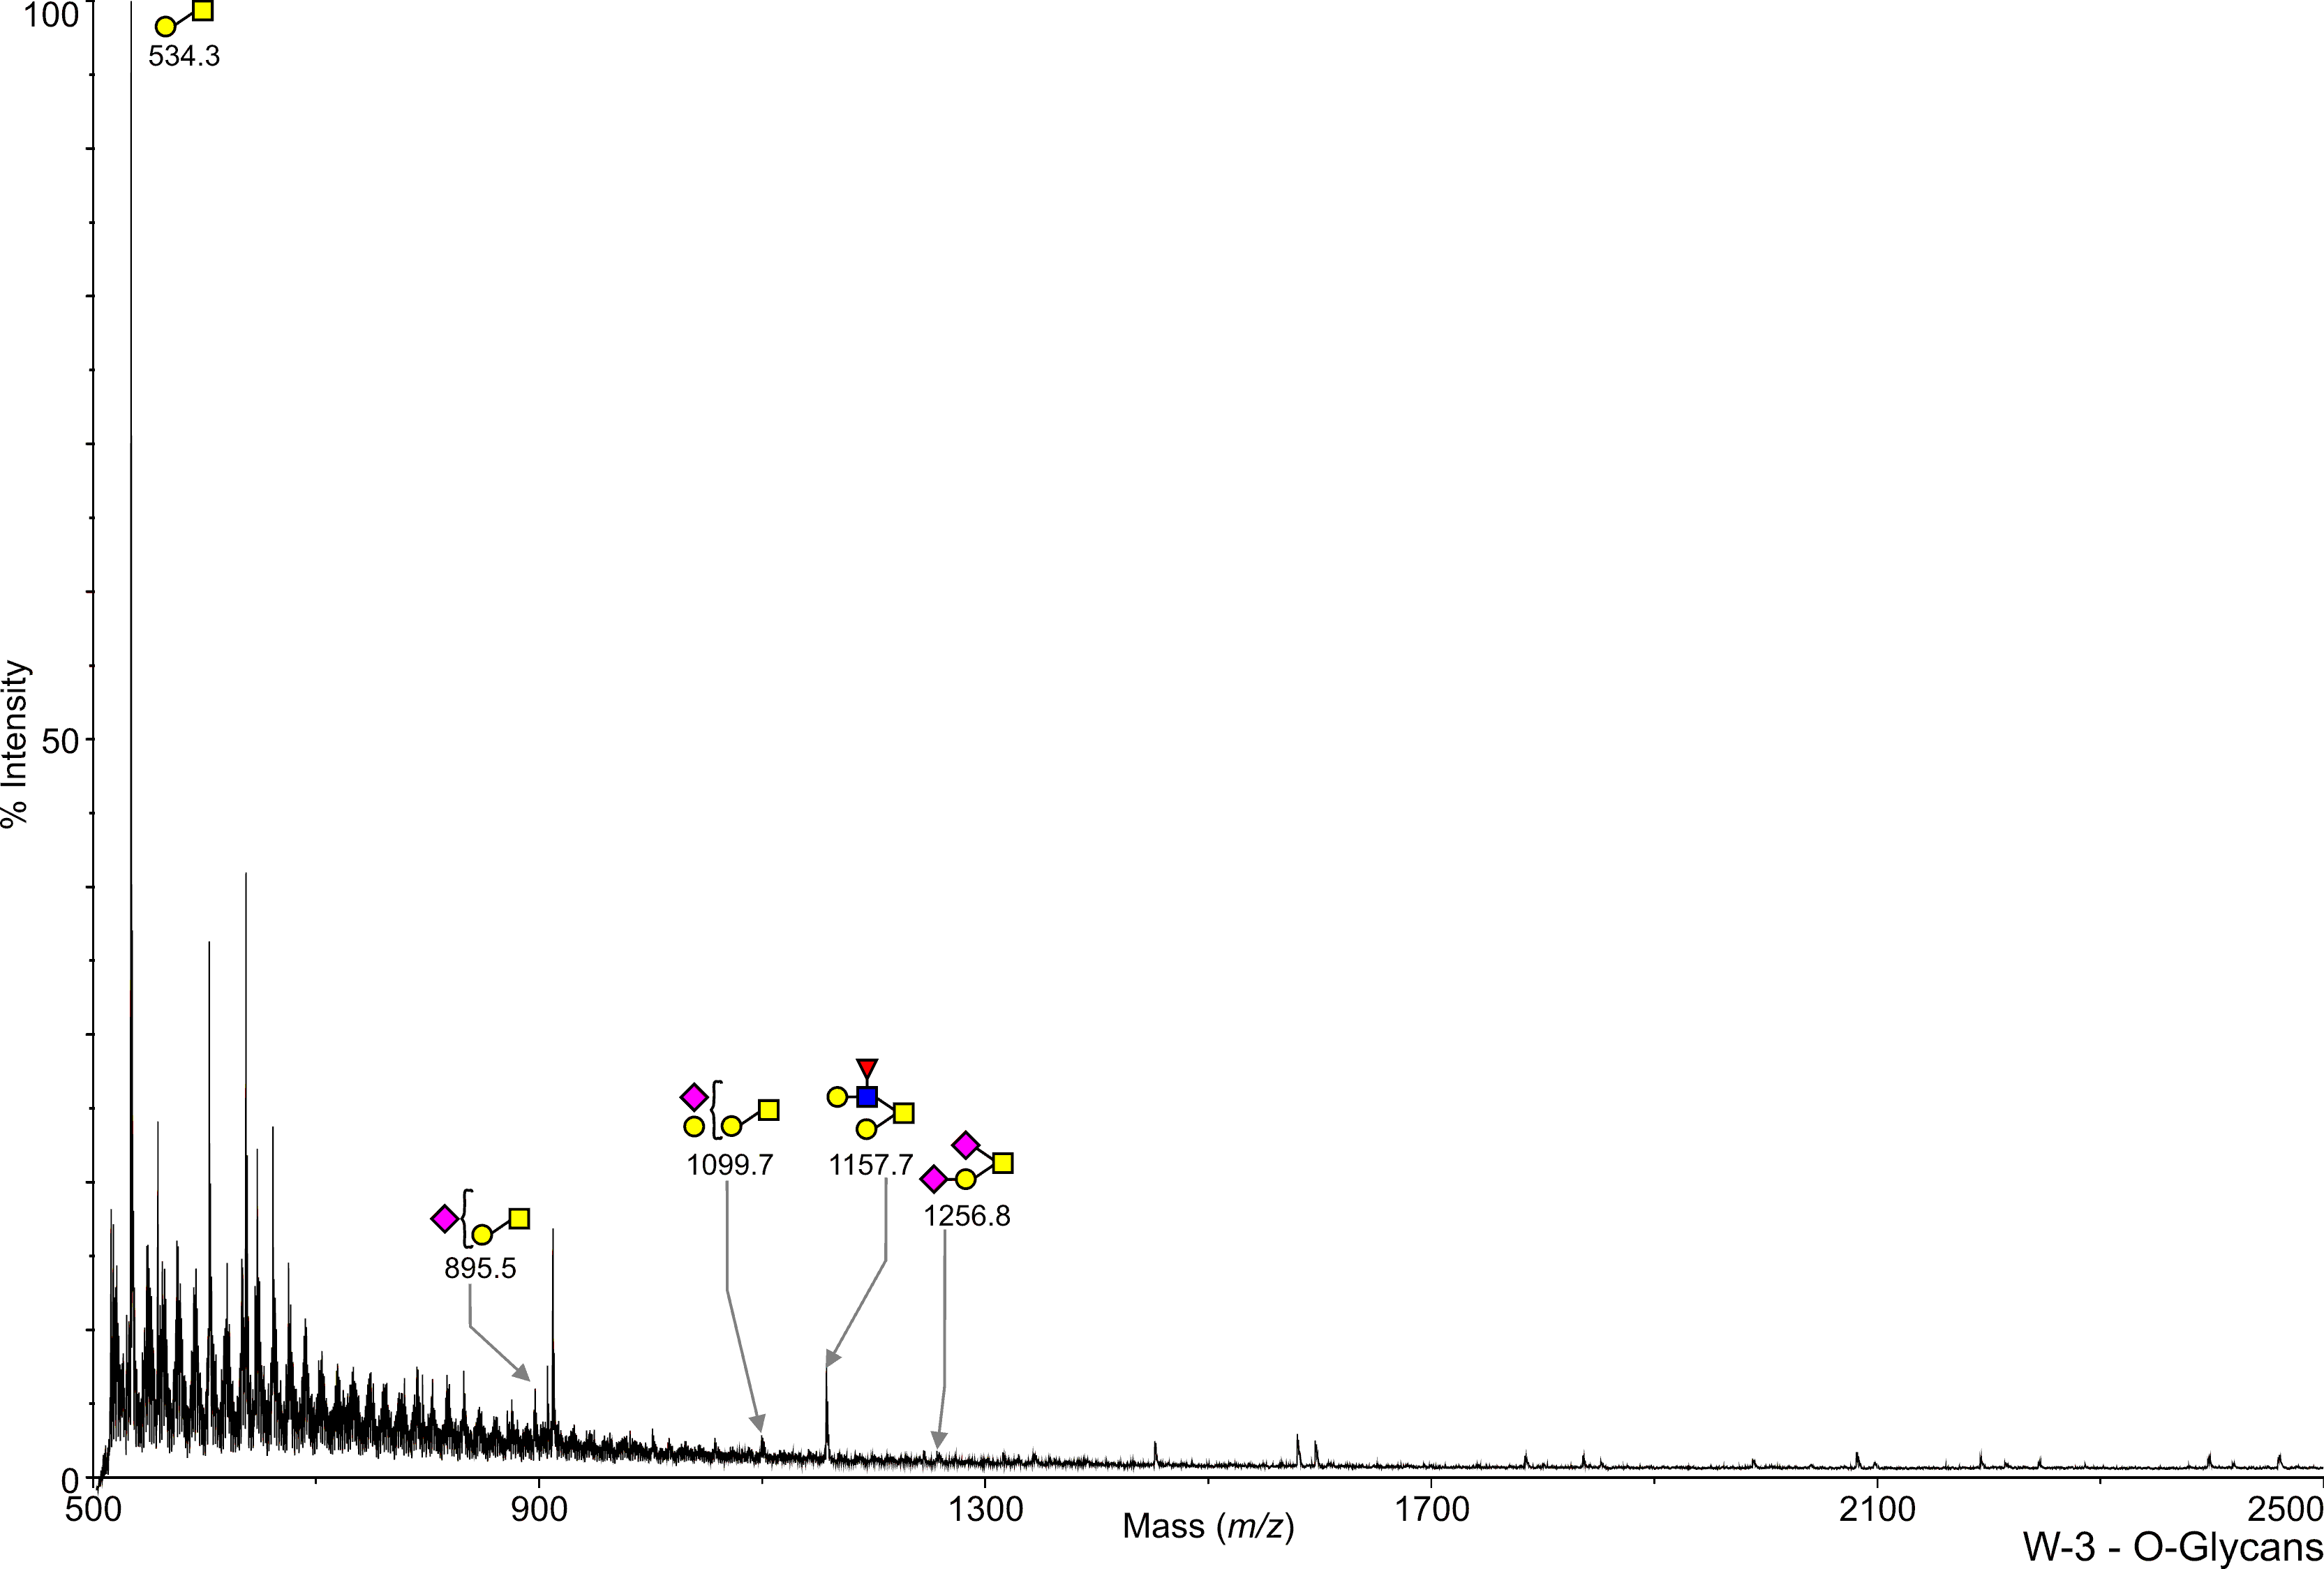
Mouse Wild Type Brain W3 O-Linked C57BL/6 Paulson, Henry View experimental details      
Annotated file in JPG format Annotated file in PDF format
View Mass Spectrum data as text View Mass Peak file   Interactive Mass Spectrum Viewer
cfg_rRequest_406
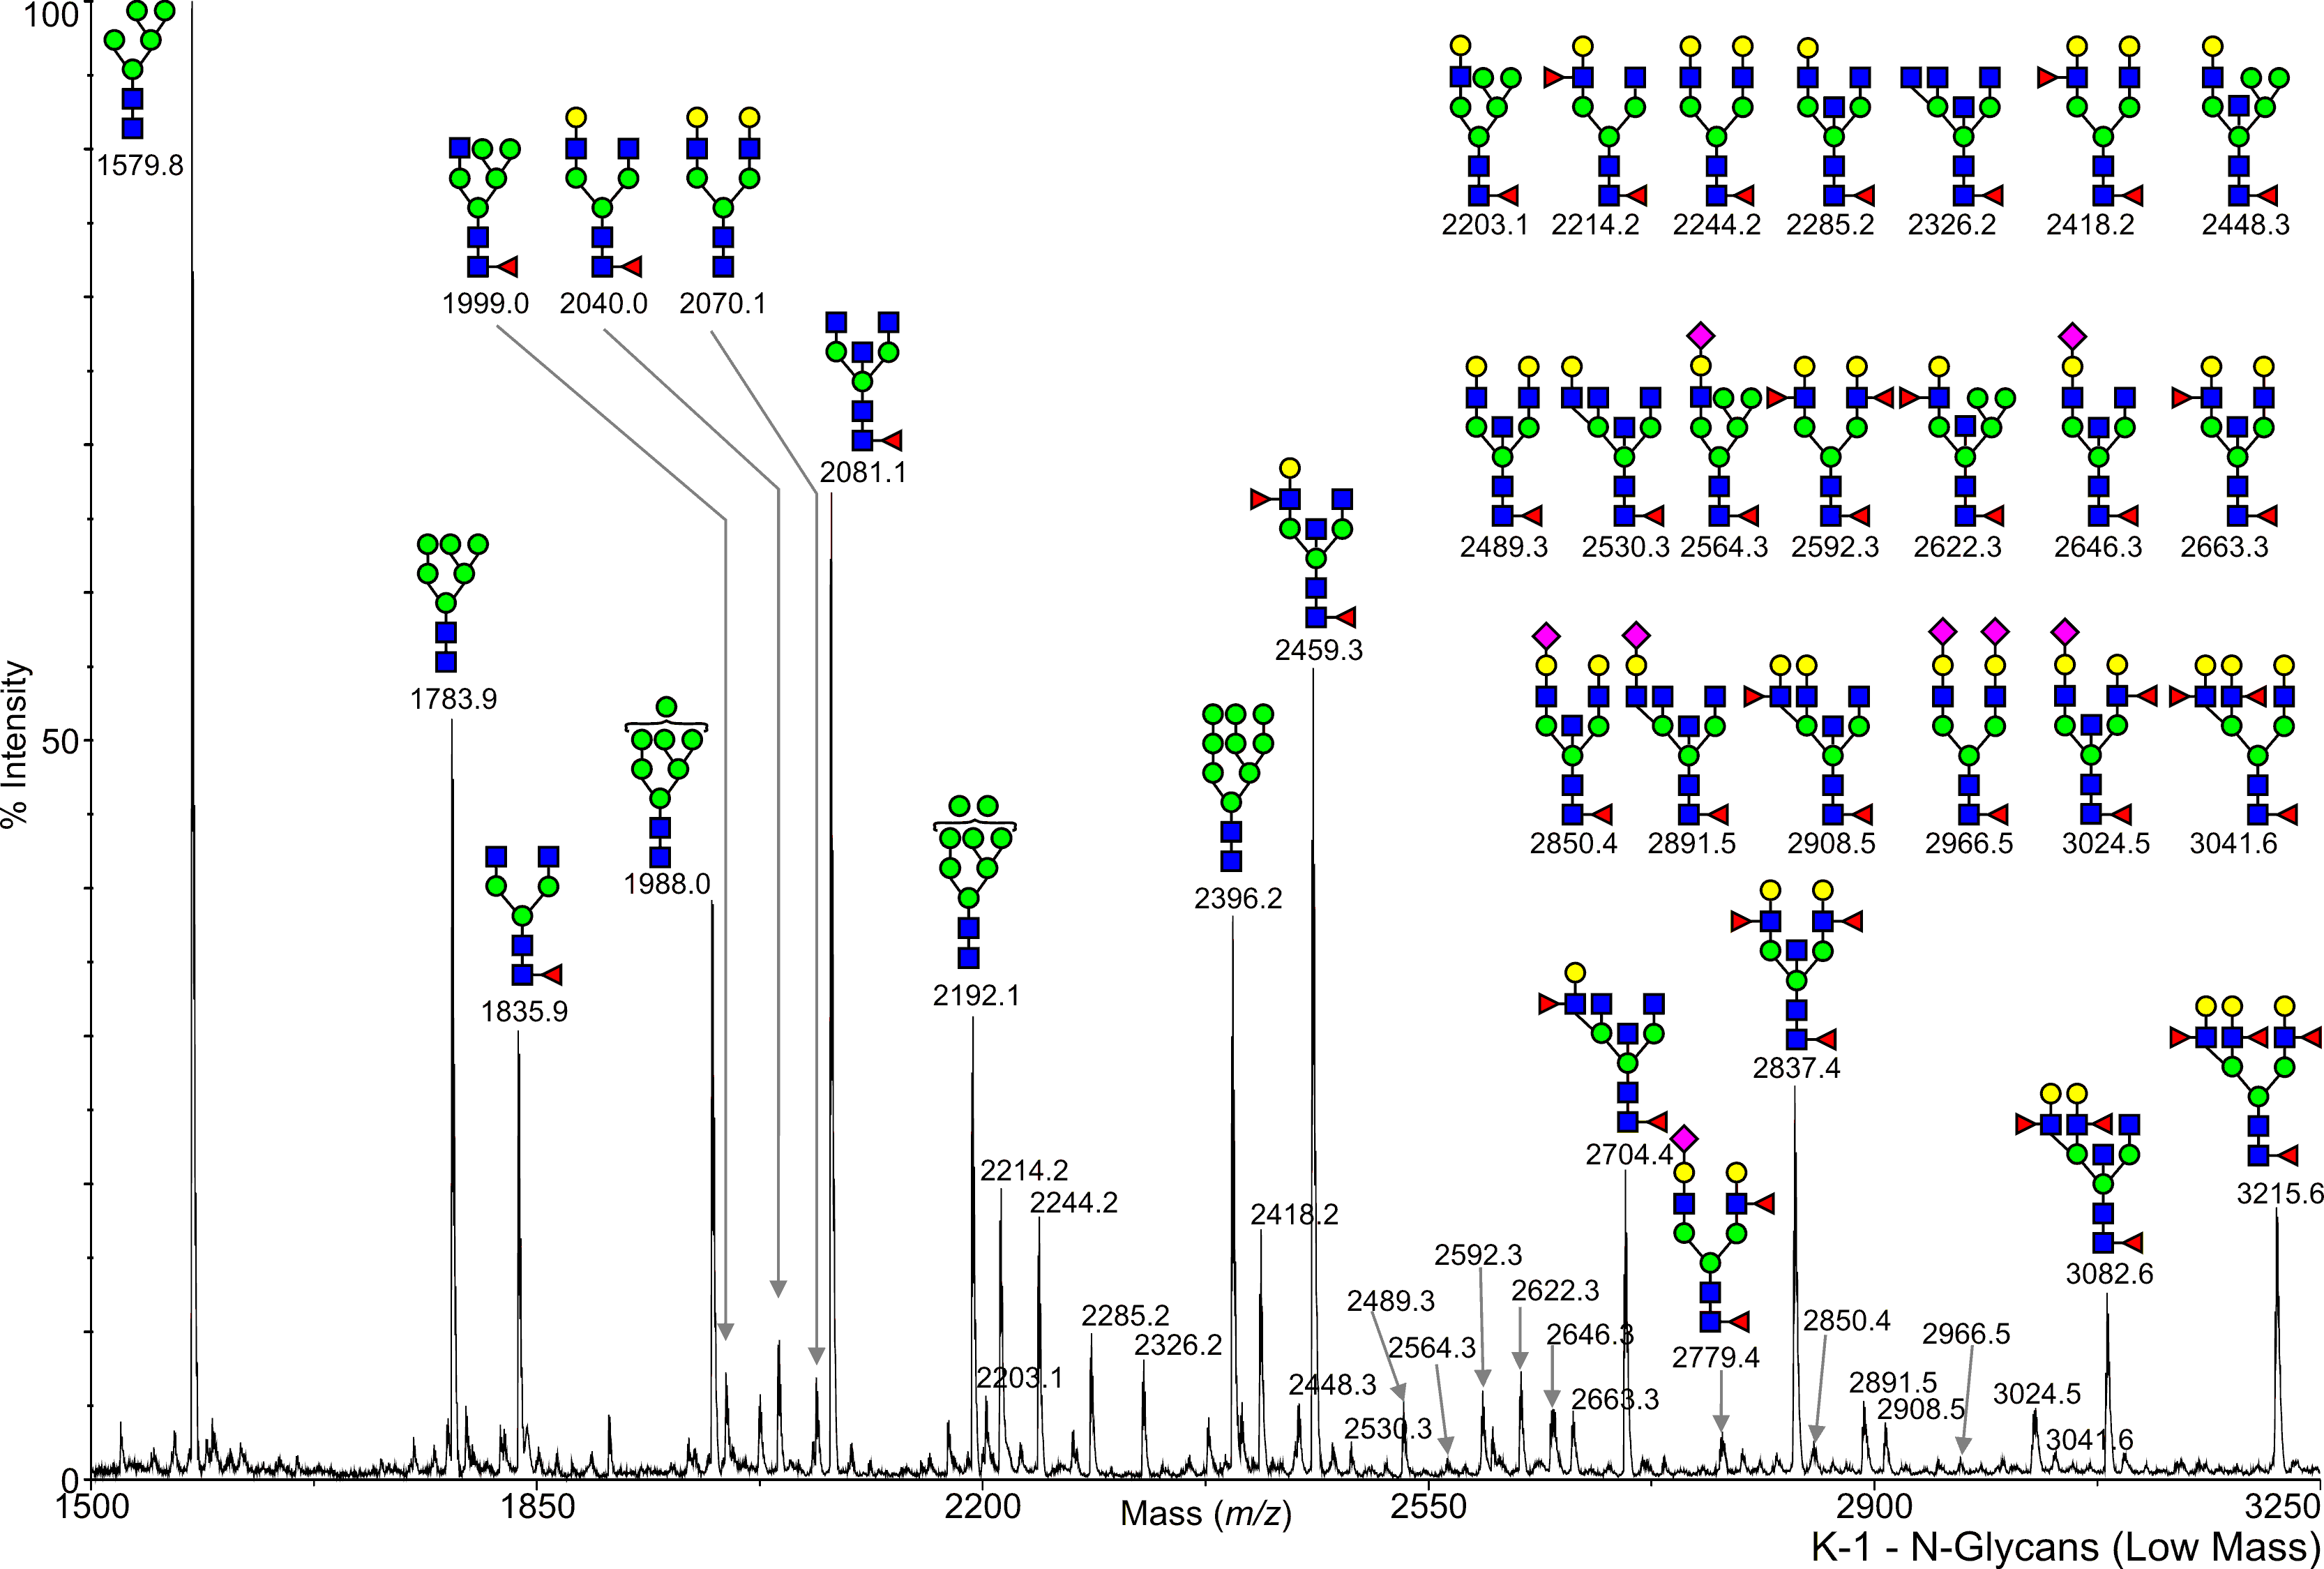
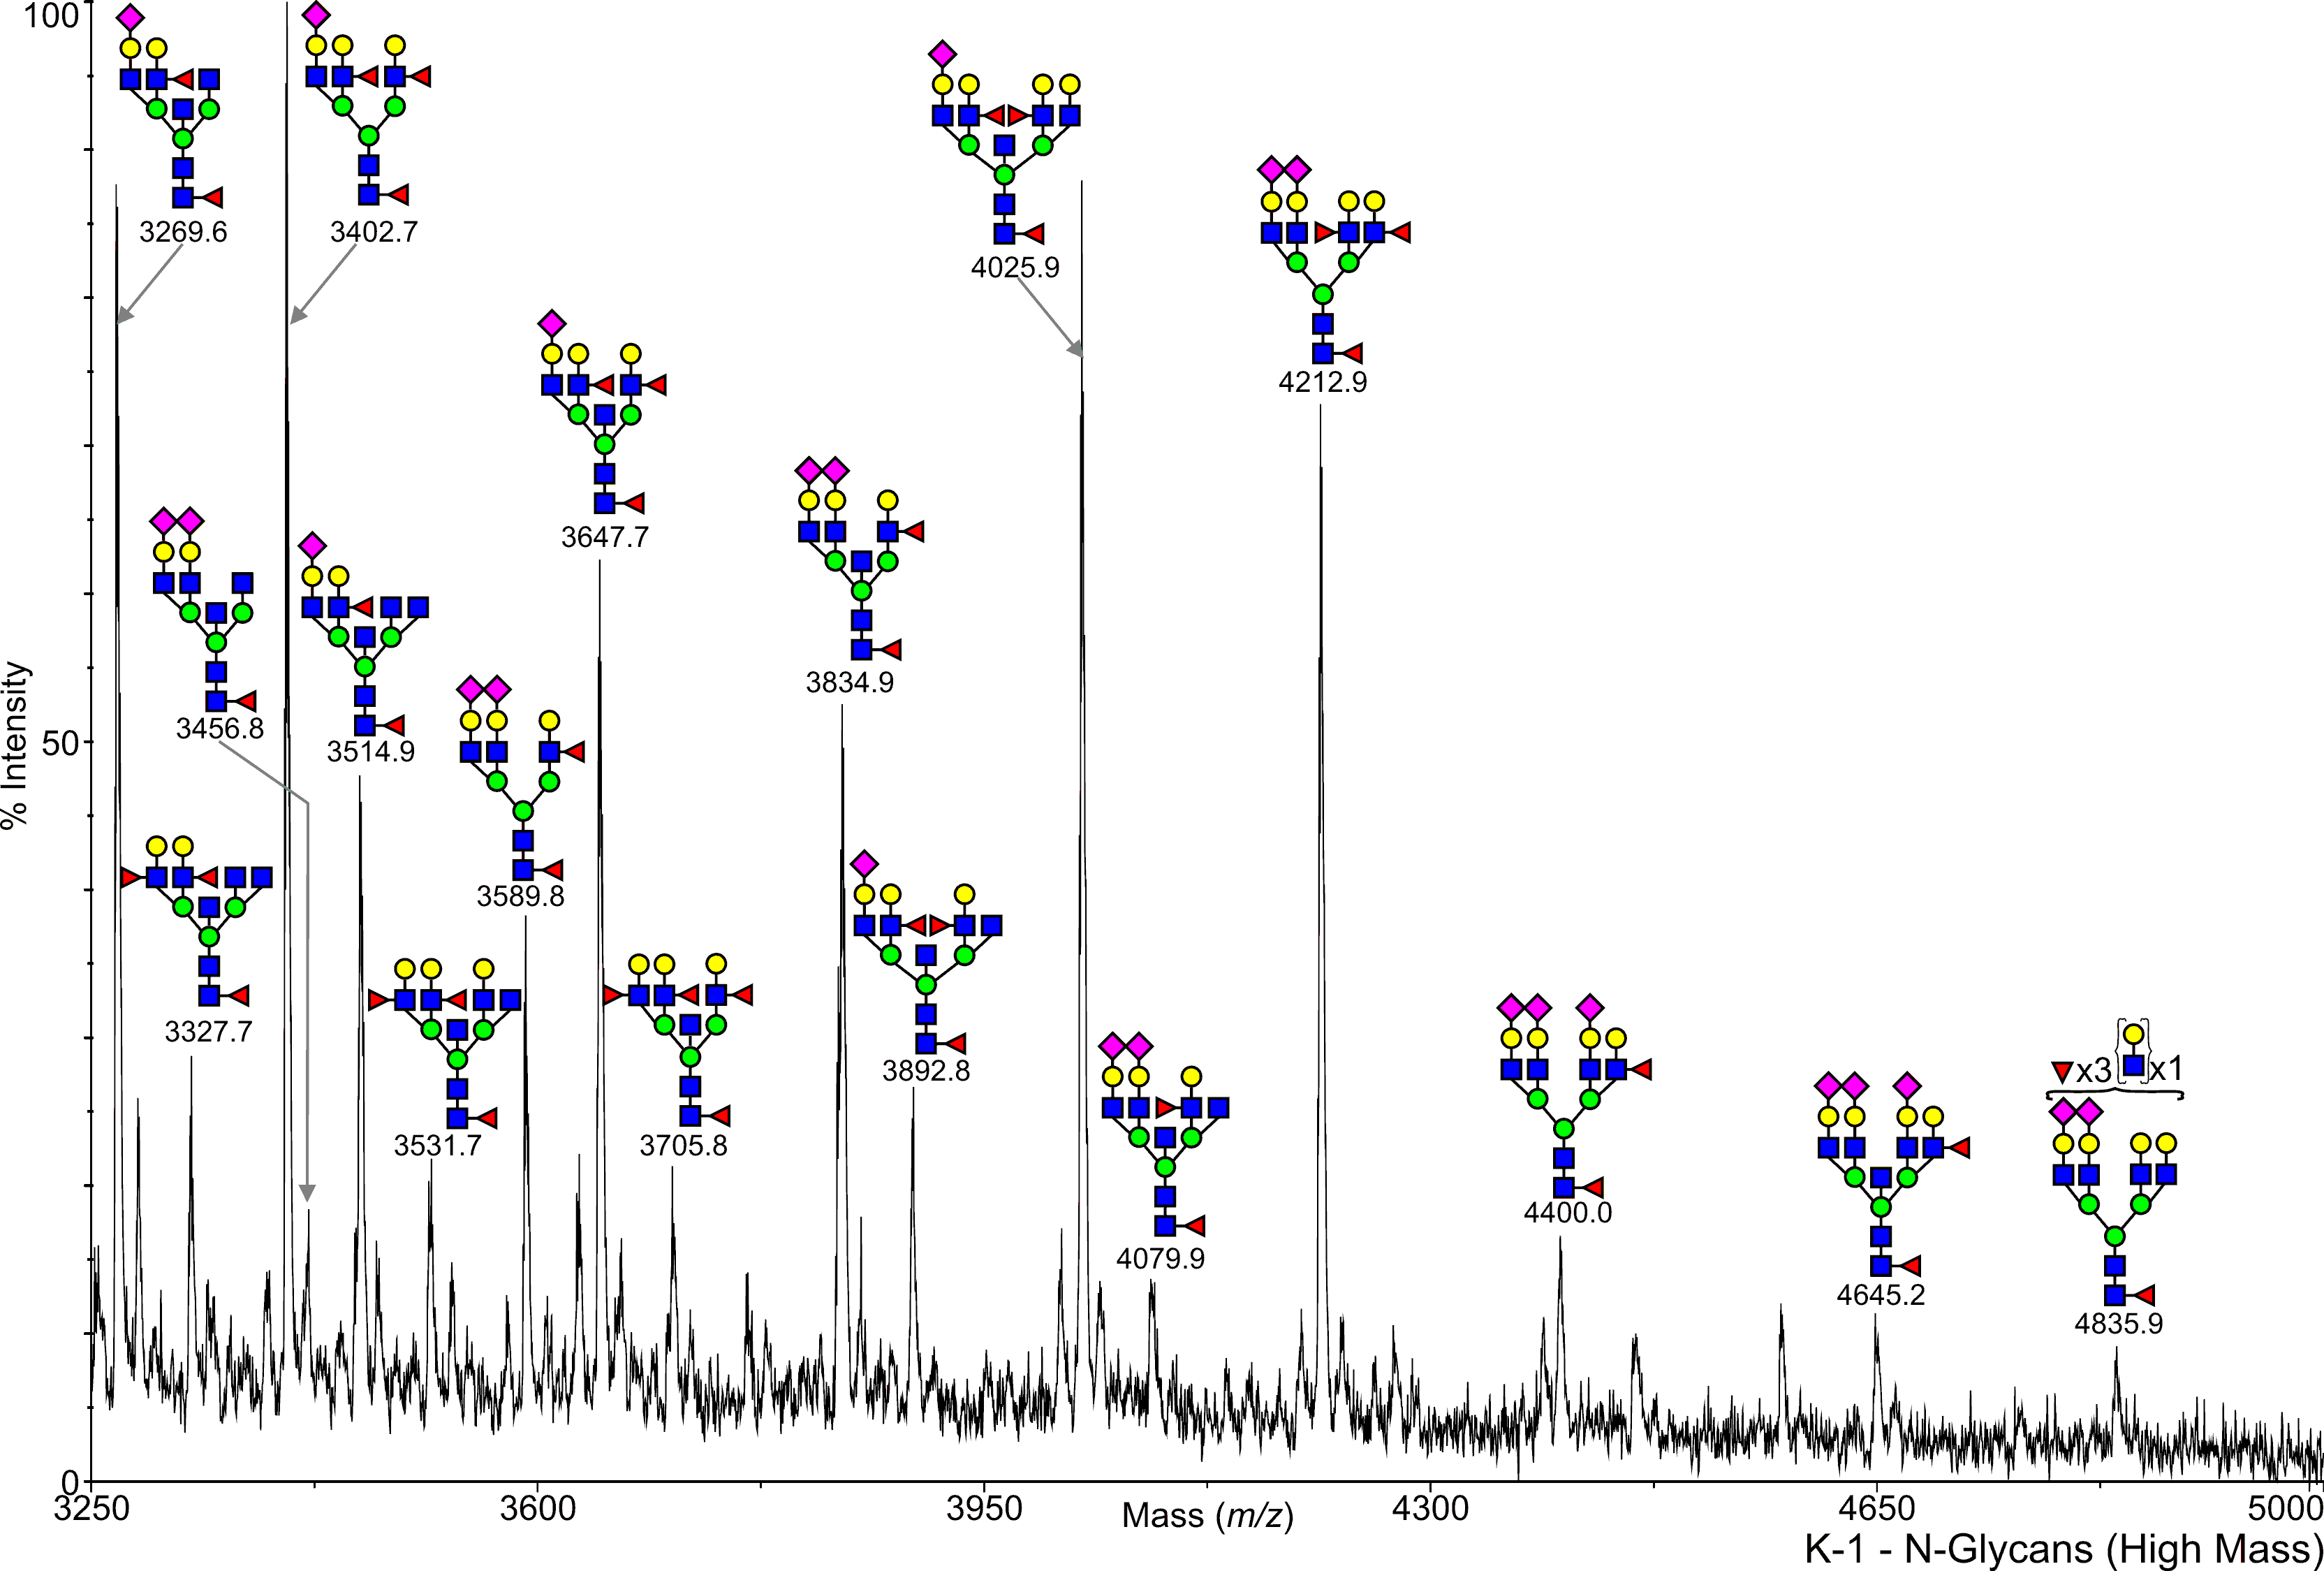
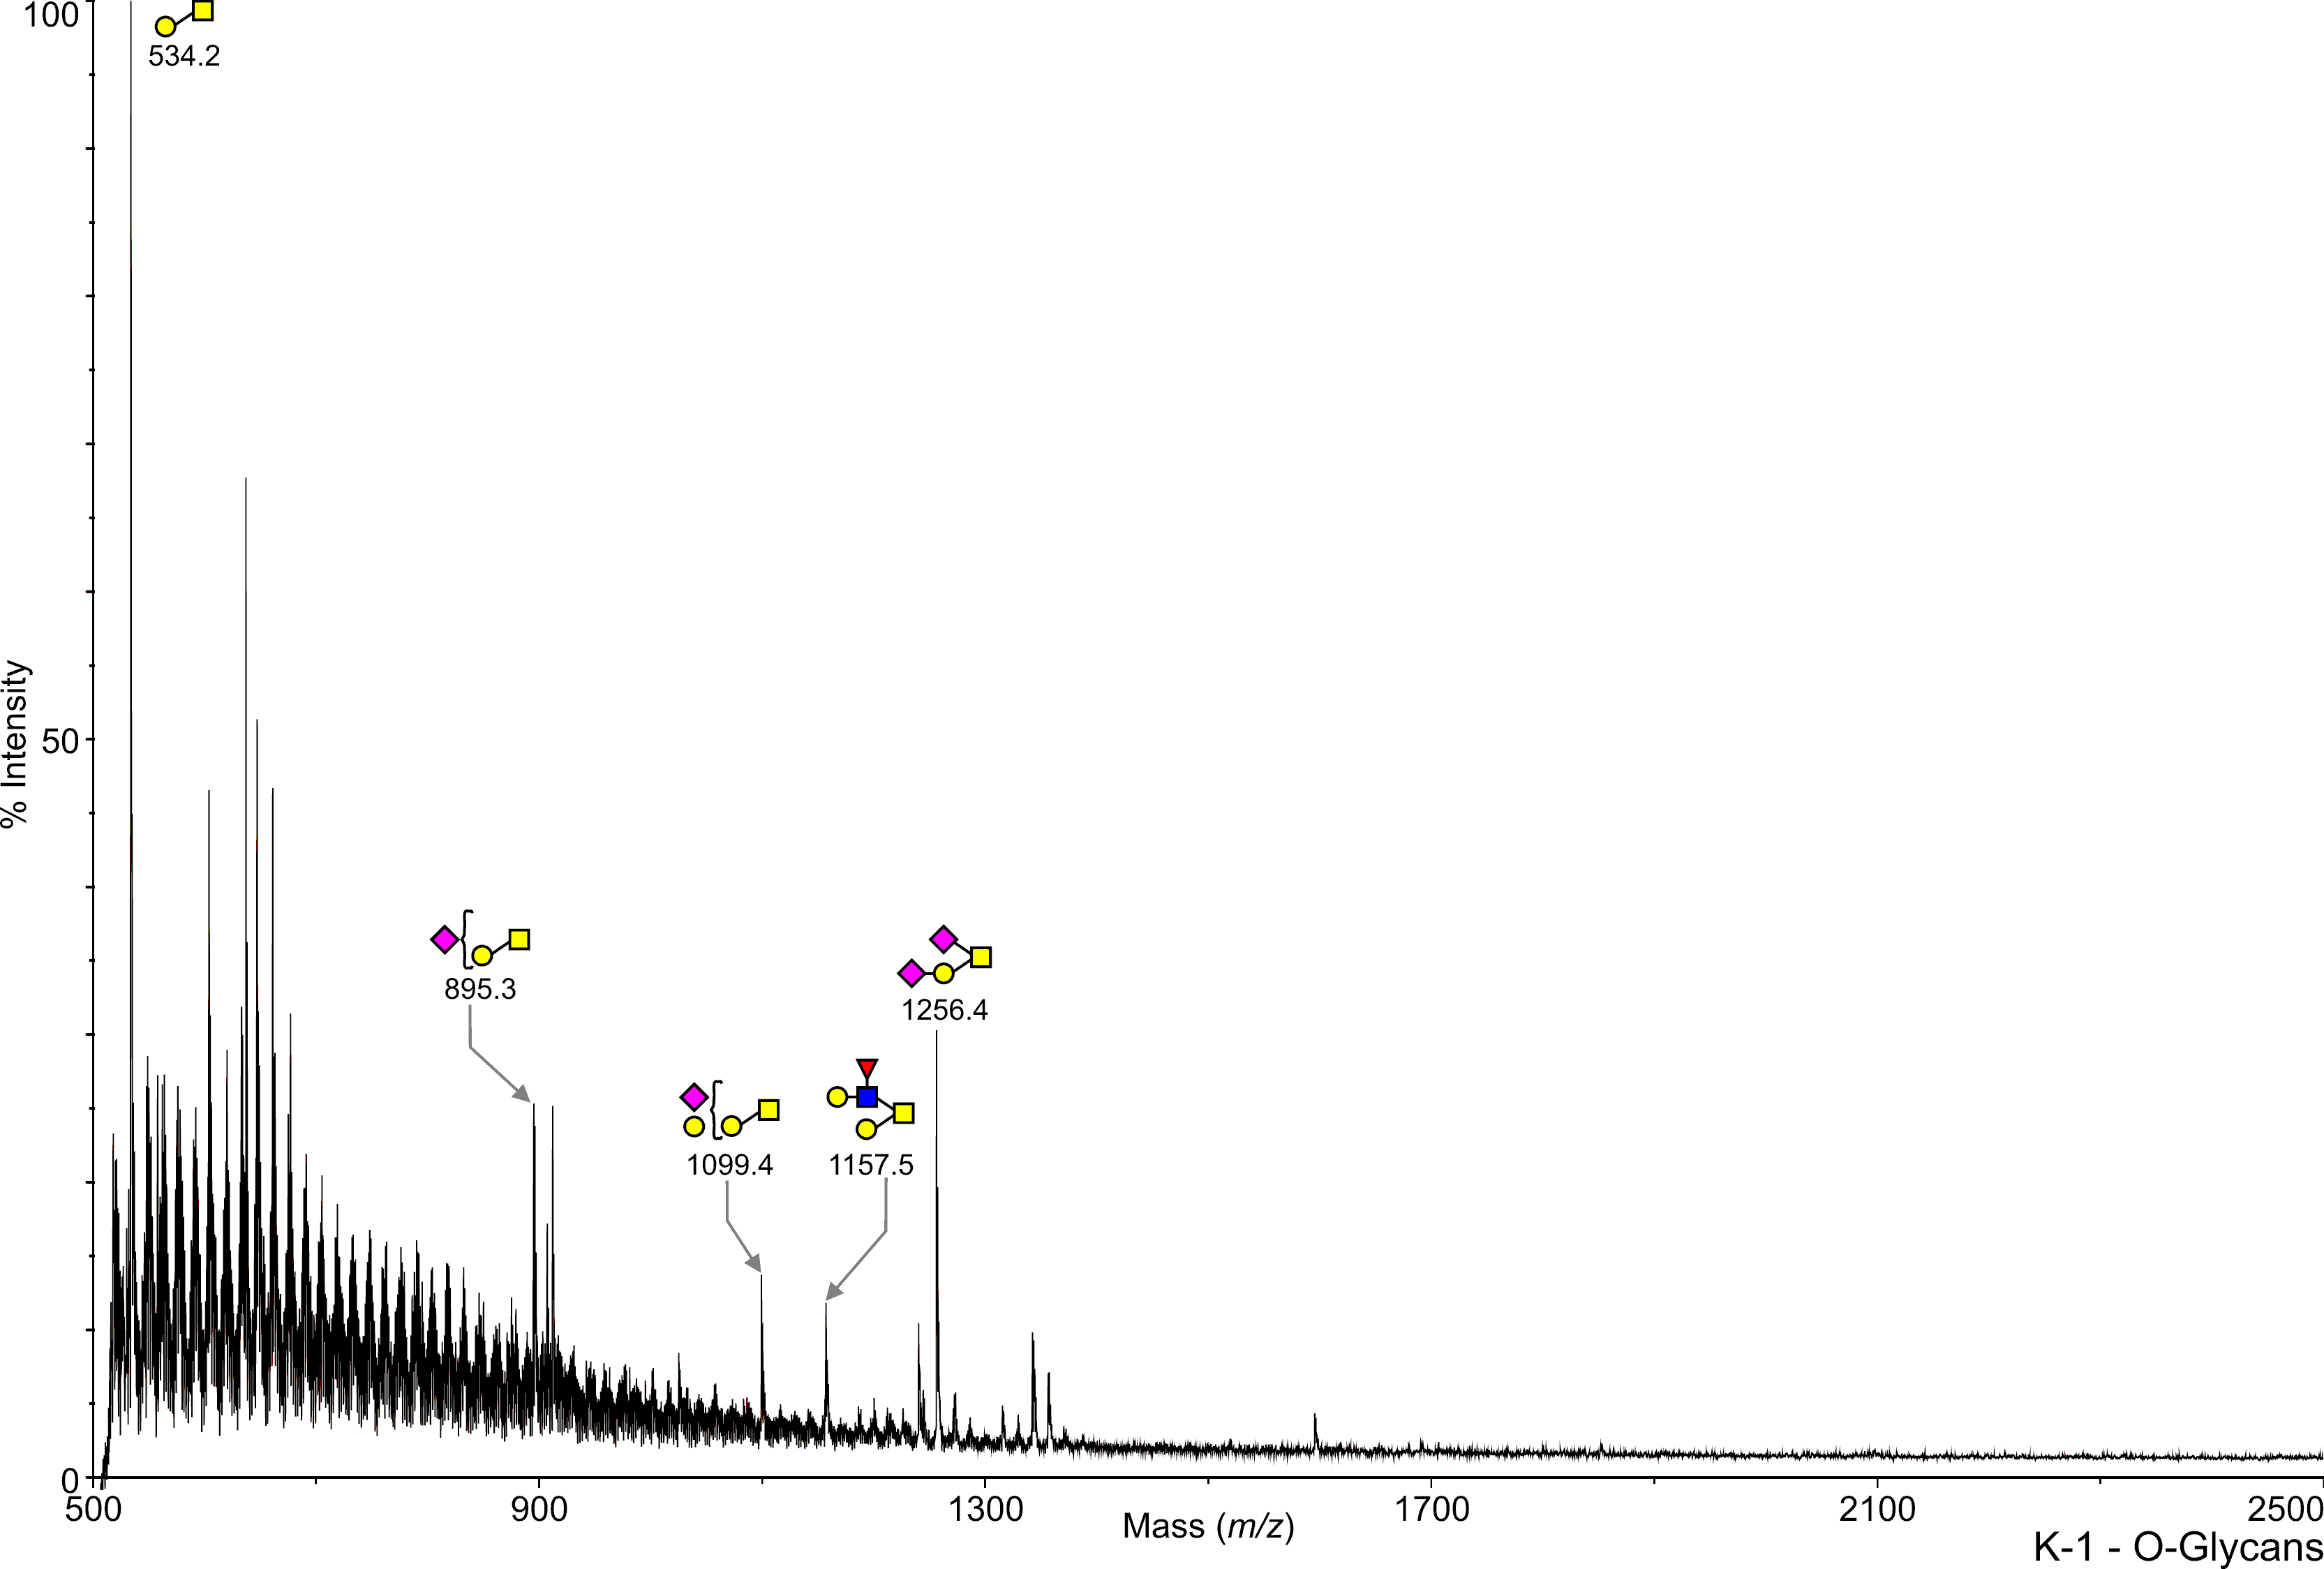
Mouse Fbx02 knockout Brain K1 N-Linked C57BL/6 Paulson, Henry View experimental details      
Annotated file for lower mass range in JPG formatAnnotated file for higher mass range in JPG format Annotated file for lower mass range in PDF formatAnnotated file for higher mass range in PDF format
View Mass Spectrum data as text View Mass Peak file   Interactive Mass Spectrum Viewer
cfg_rRequest_406
Mouse Fbx02 knockout Brain K1 O-Linked C57BL/6 Paulson, Henry View experimental details      
Annotated file in JPG format Annotated file in PDF format
View Mass Spectrum data as text View Mass Peak file   Interactive Mass Spectrum Viewer
cfg_rRequest_406
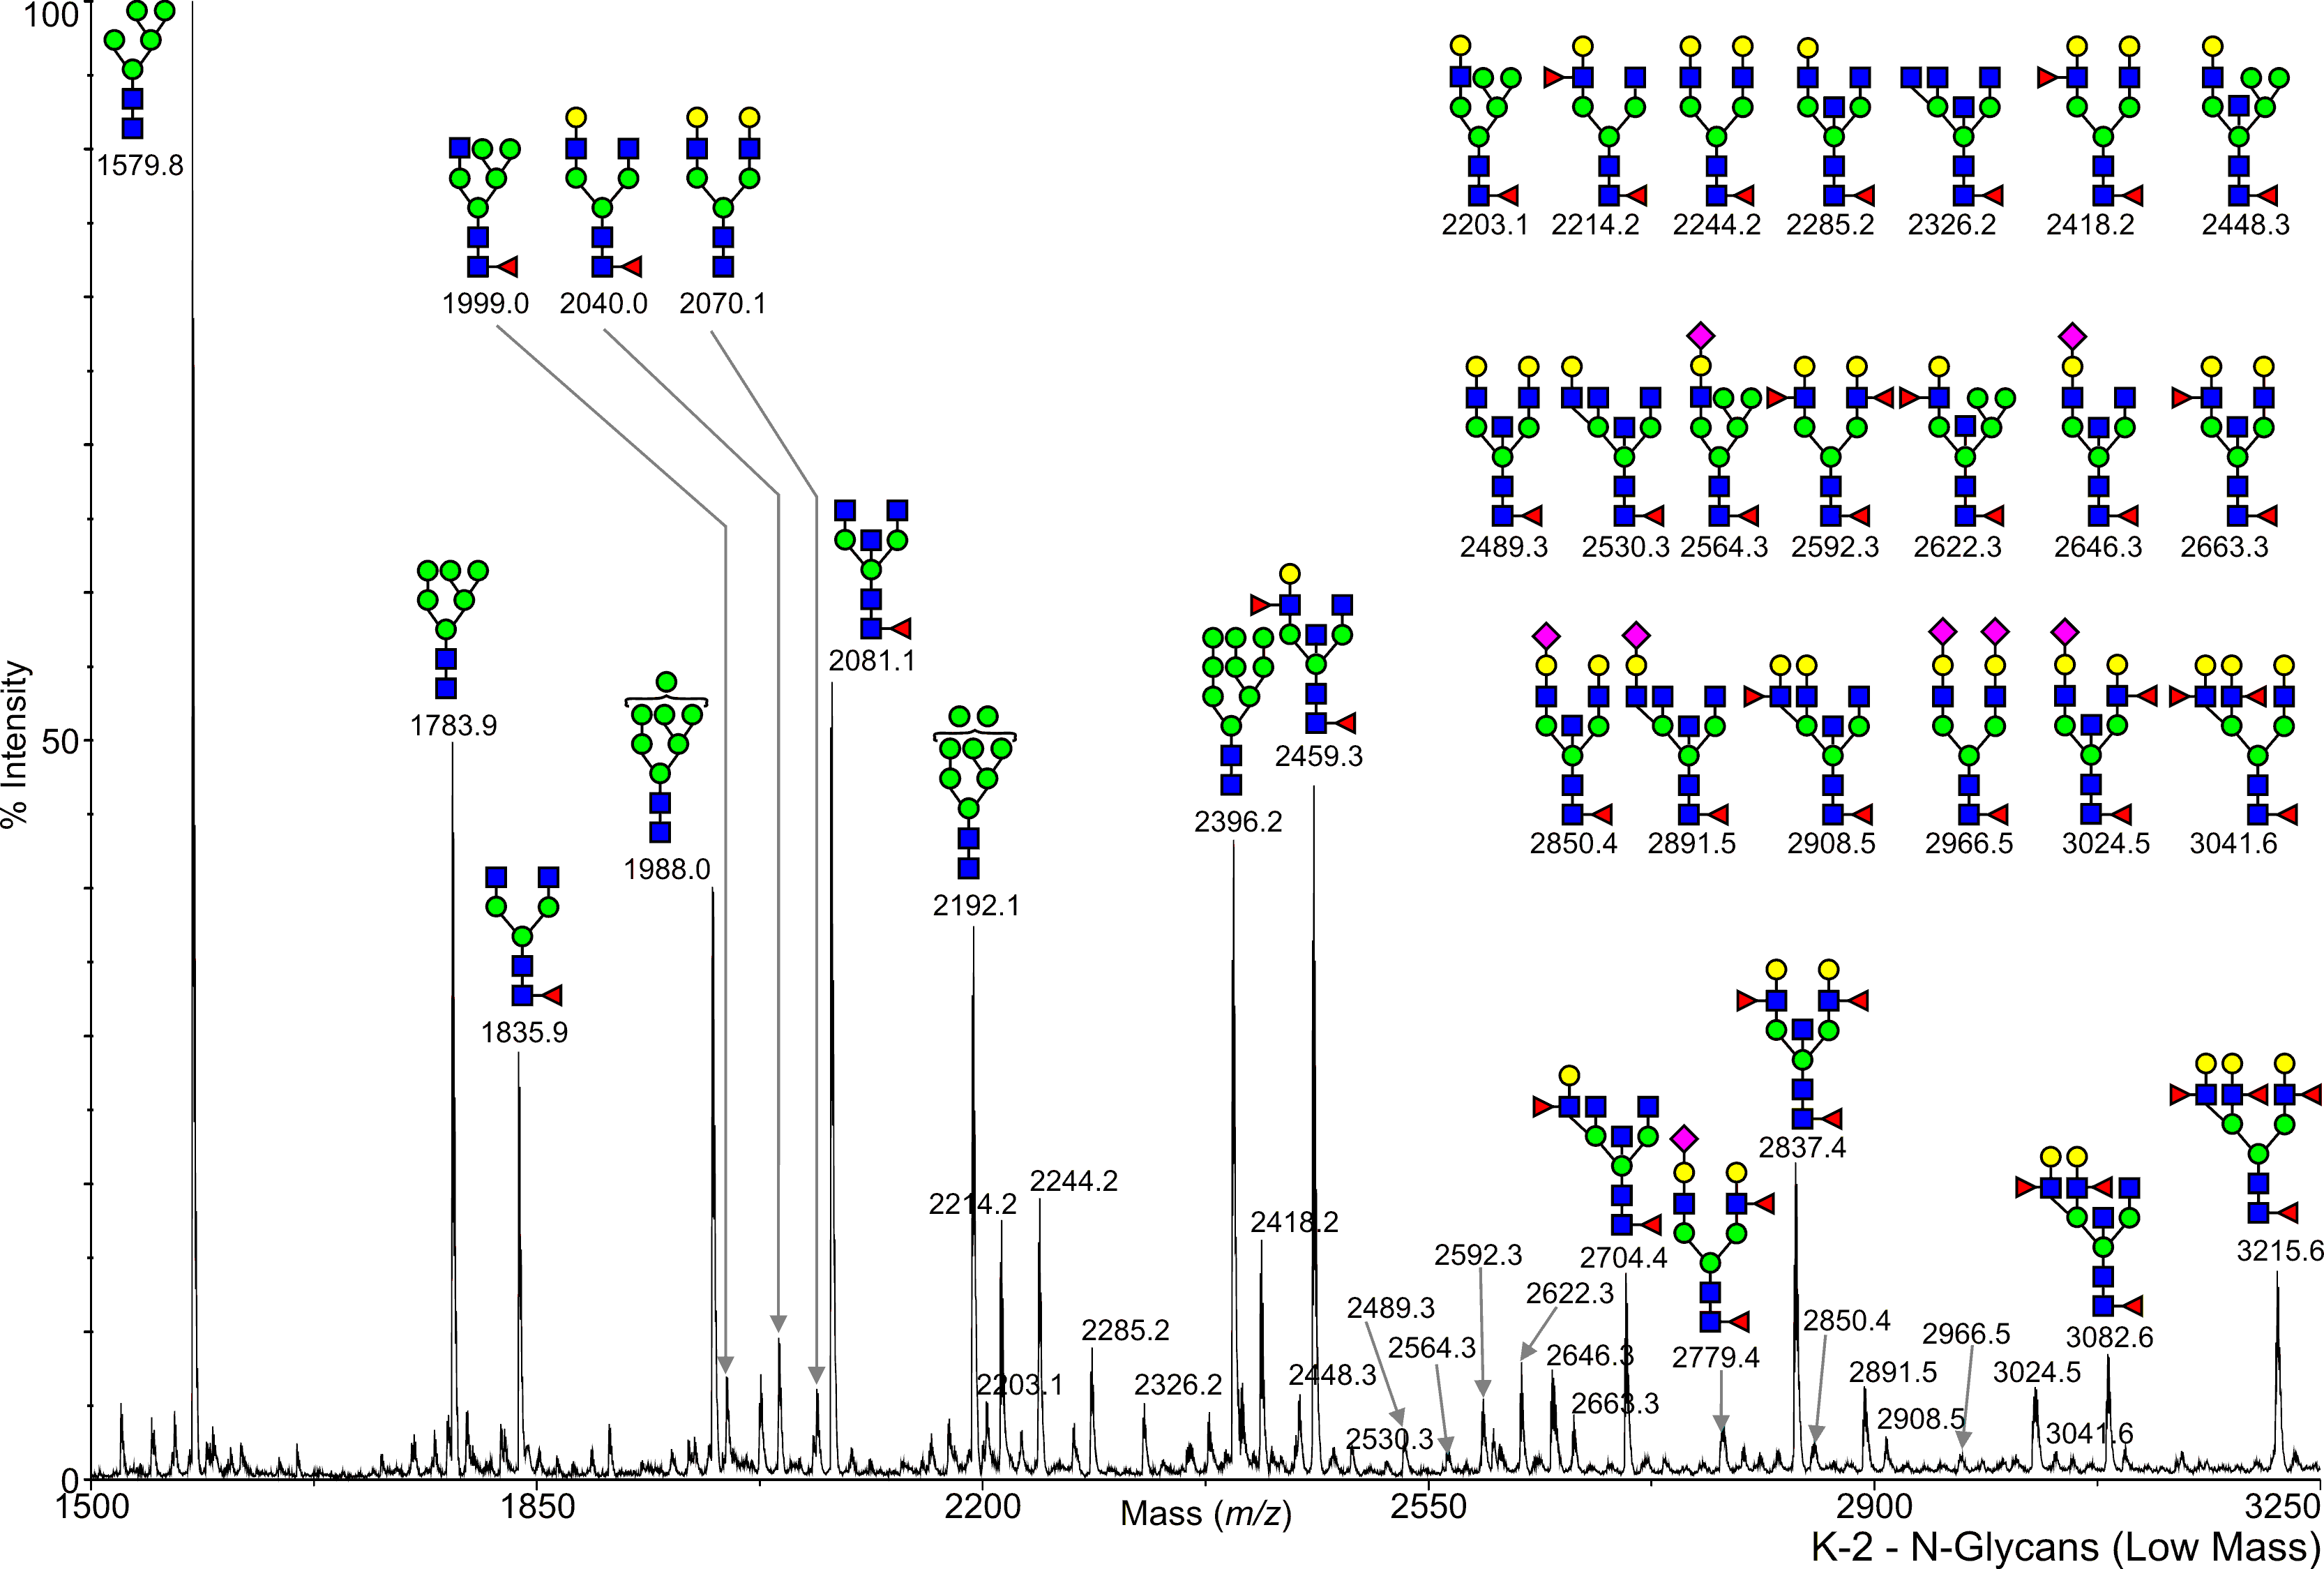
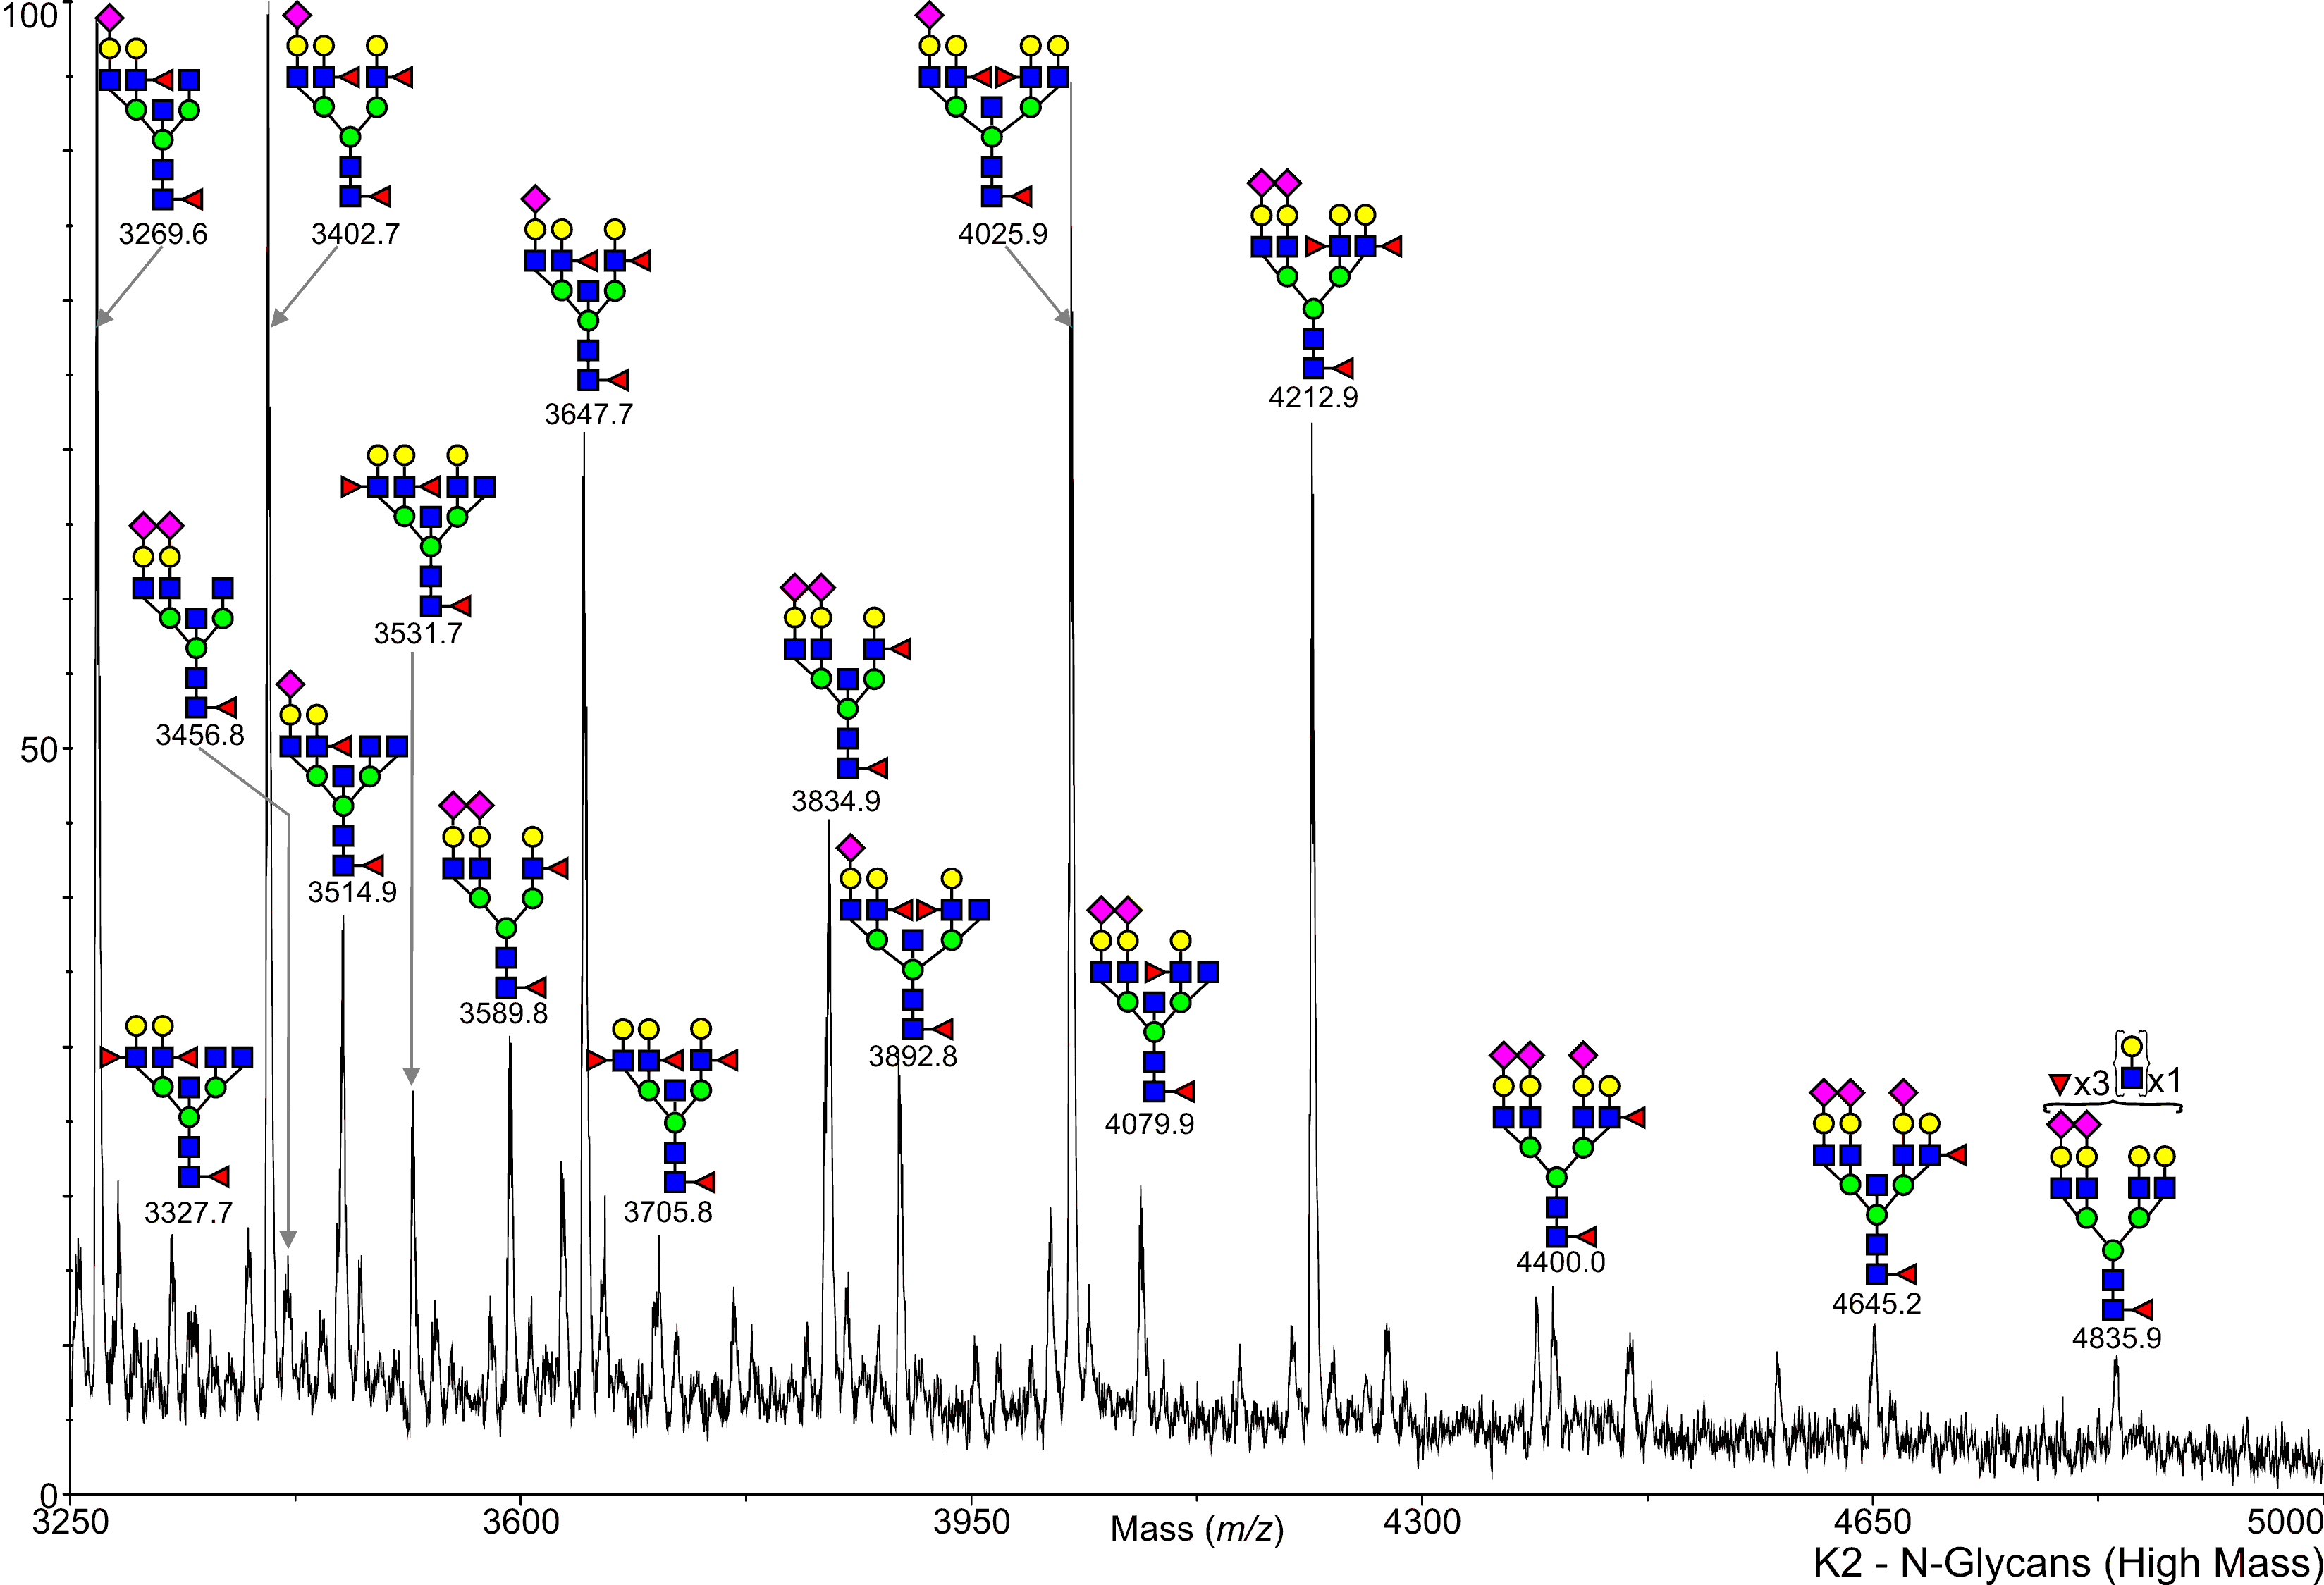
Mouse Fbx02 knockout Brain K2 N-Linked C57BL/6 Paulson, Henry View experimental details      
Annotated file for lower mass range in JPG formatAnnotated file for higher mass range in JPG format Annotated file for lower mass range in PDF formatAnnotated file for higher mass range in PDF format
View Mass Spectrum data as text View Mass Peak file   Interactive Mass Spectrum Viewer
cfg_rRequest_406
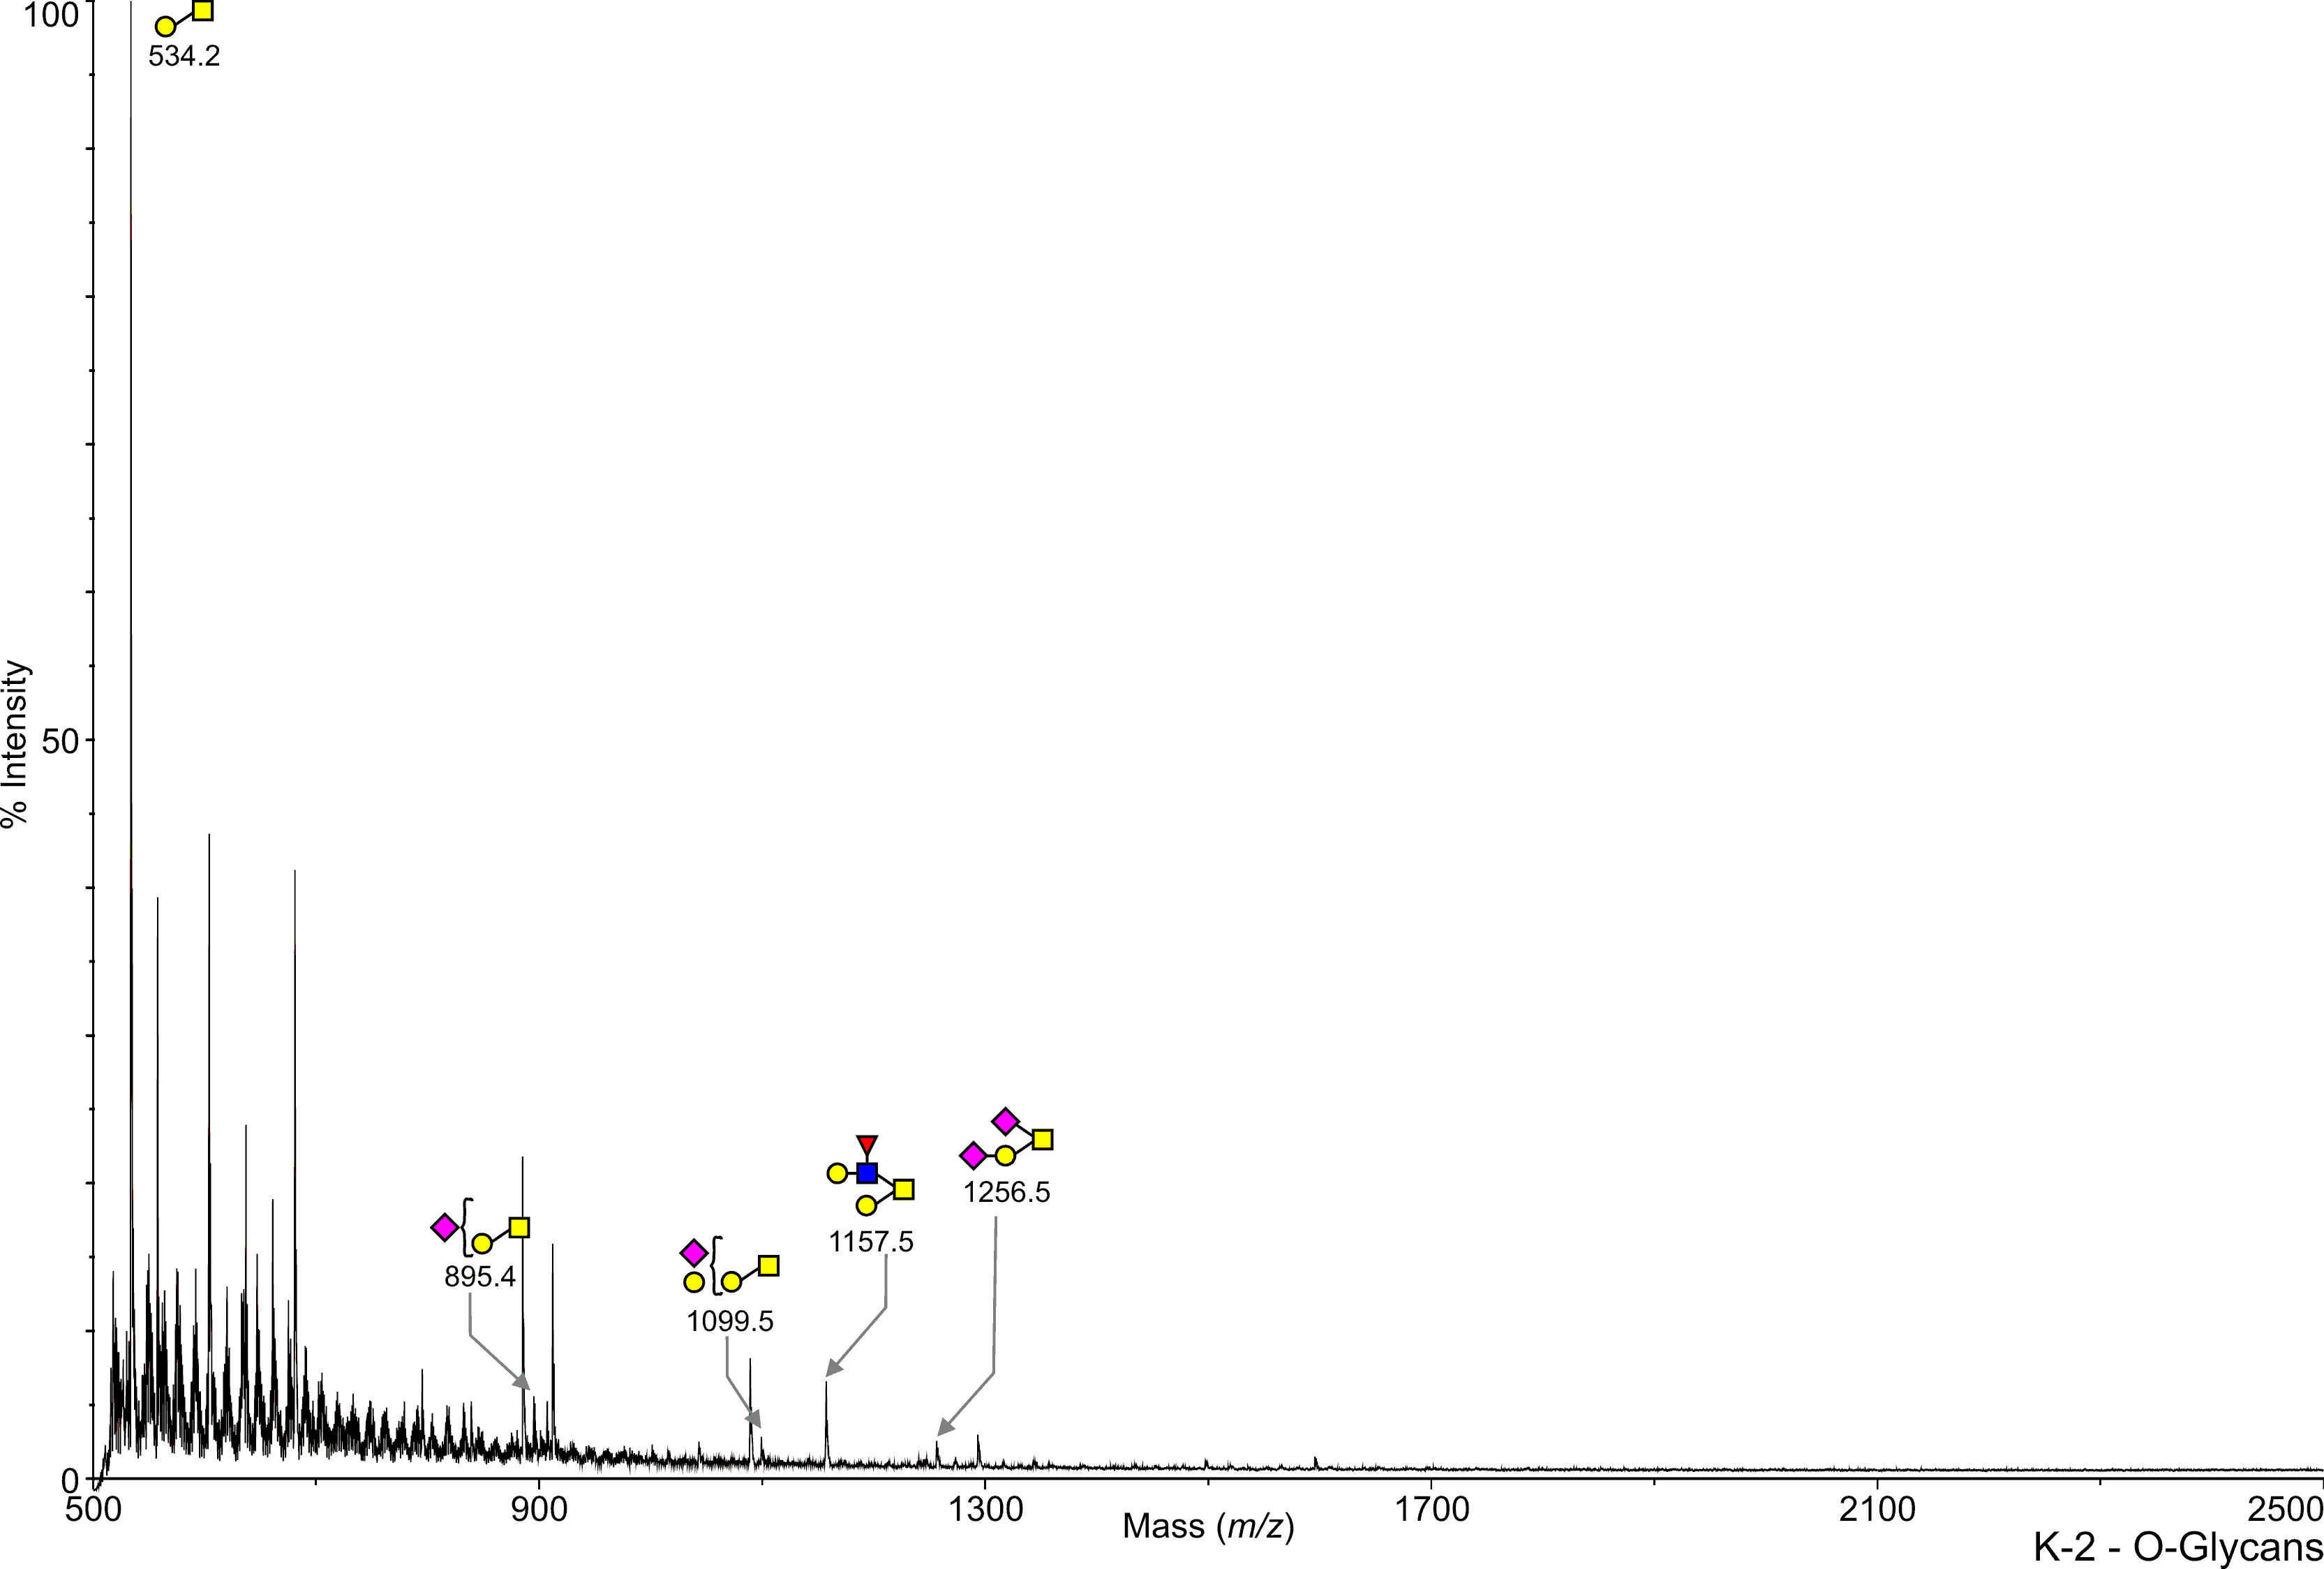
Mouse Fbx02 knockout Brain K2 O-Linked C57BL/6 Paulson, Henry View experimental details      
Annotated file in JPG format Annotated file in PDF format
View Mass Spectrum data as text View Mass Peak file   Interactive Mass Spectrum Viewer
cfg_rRequest_406
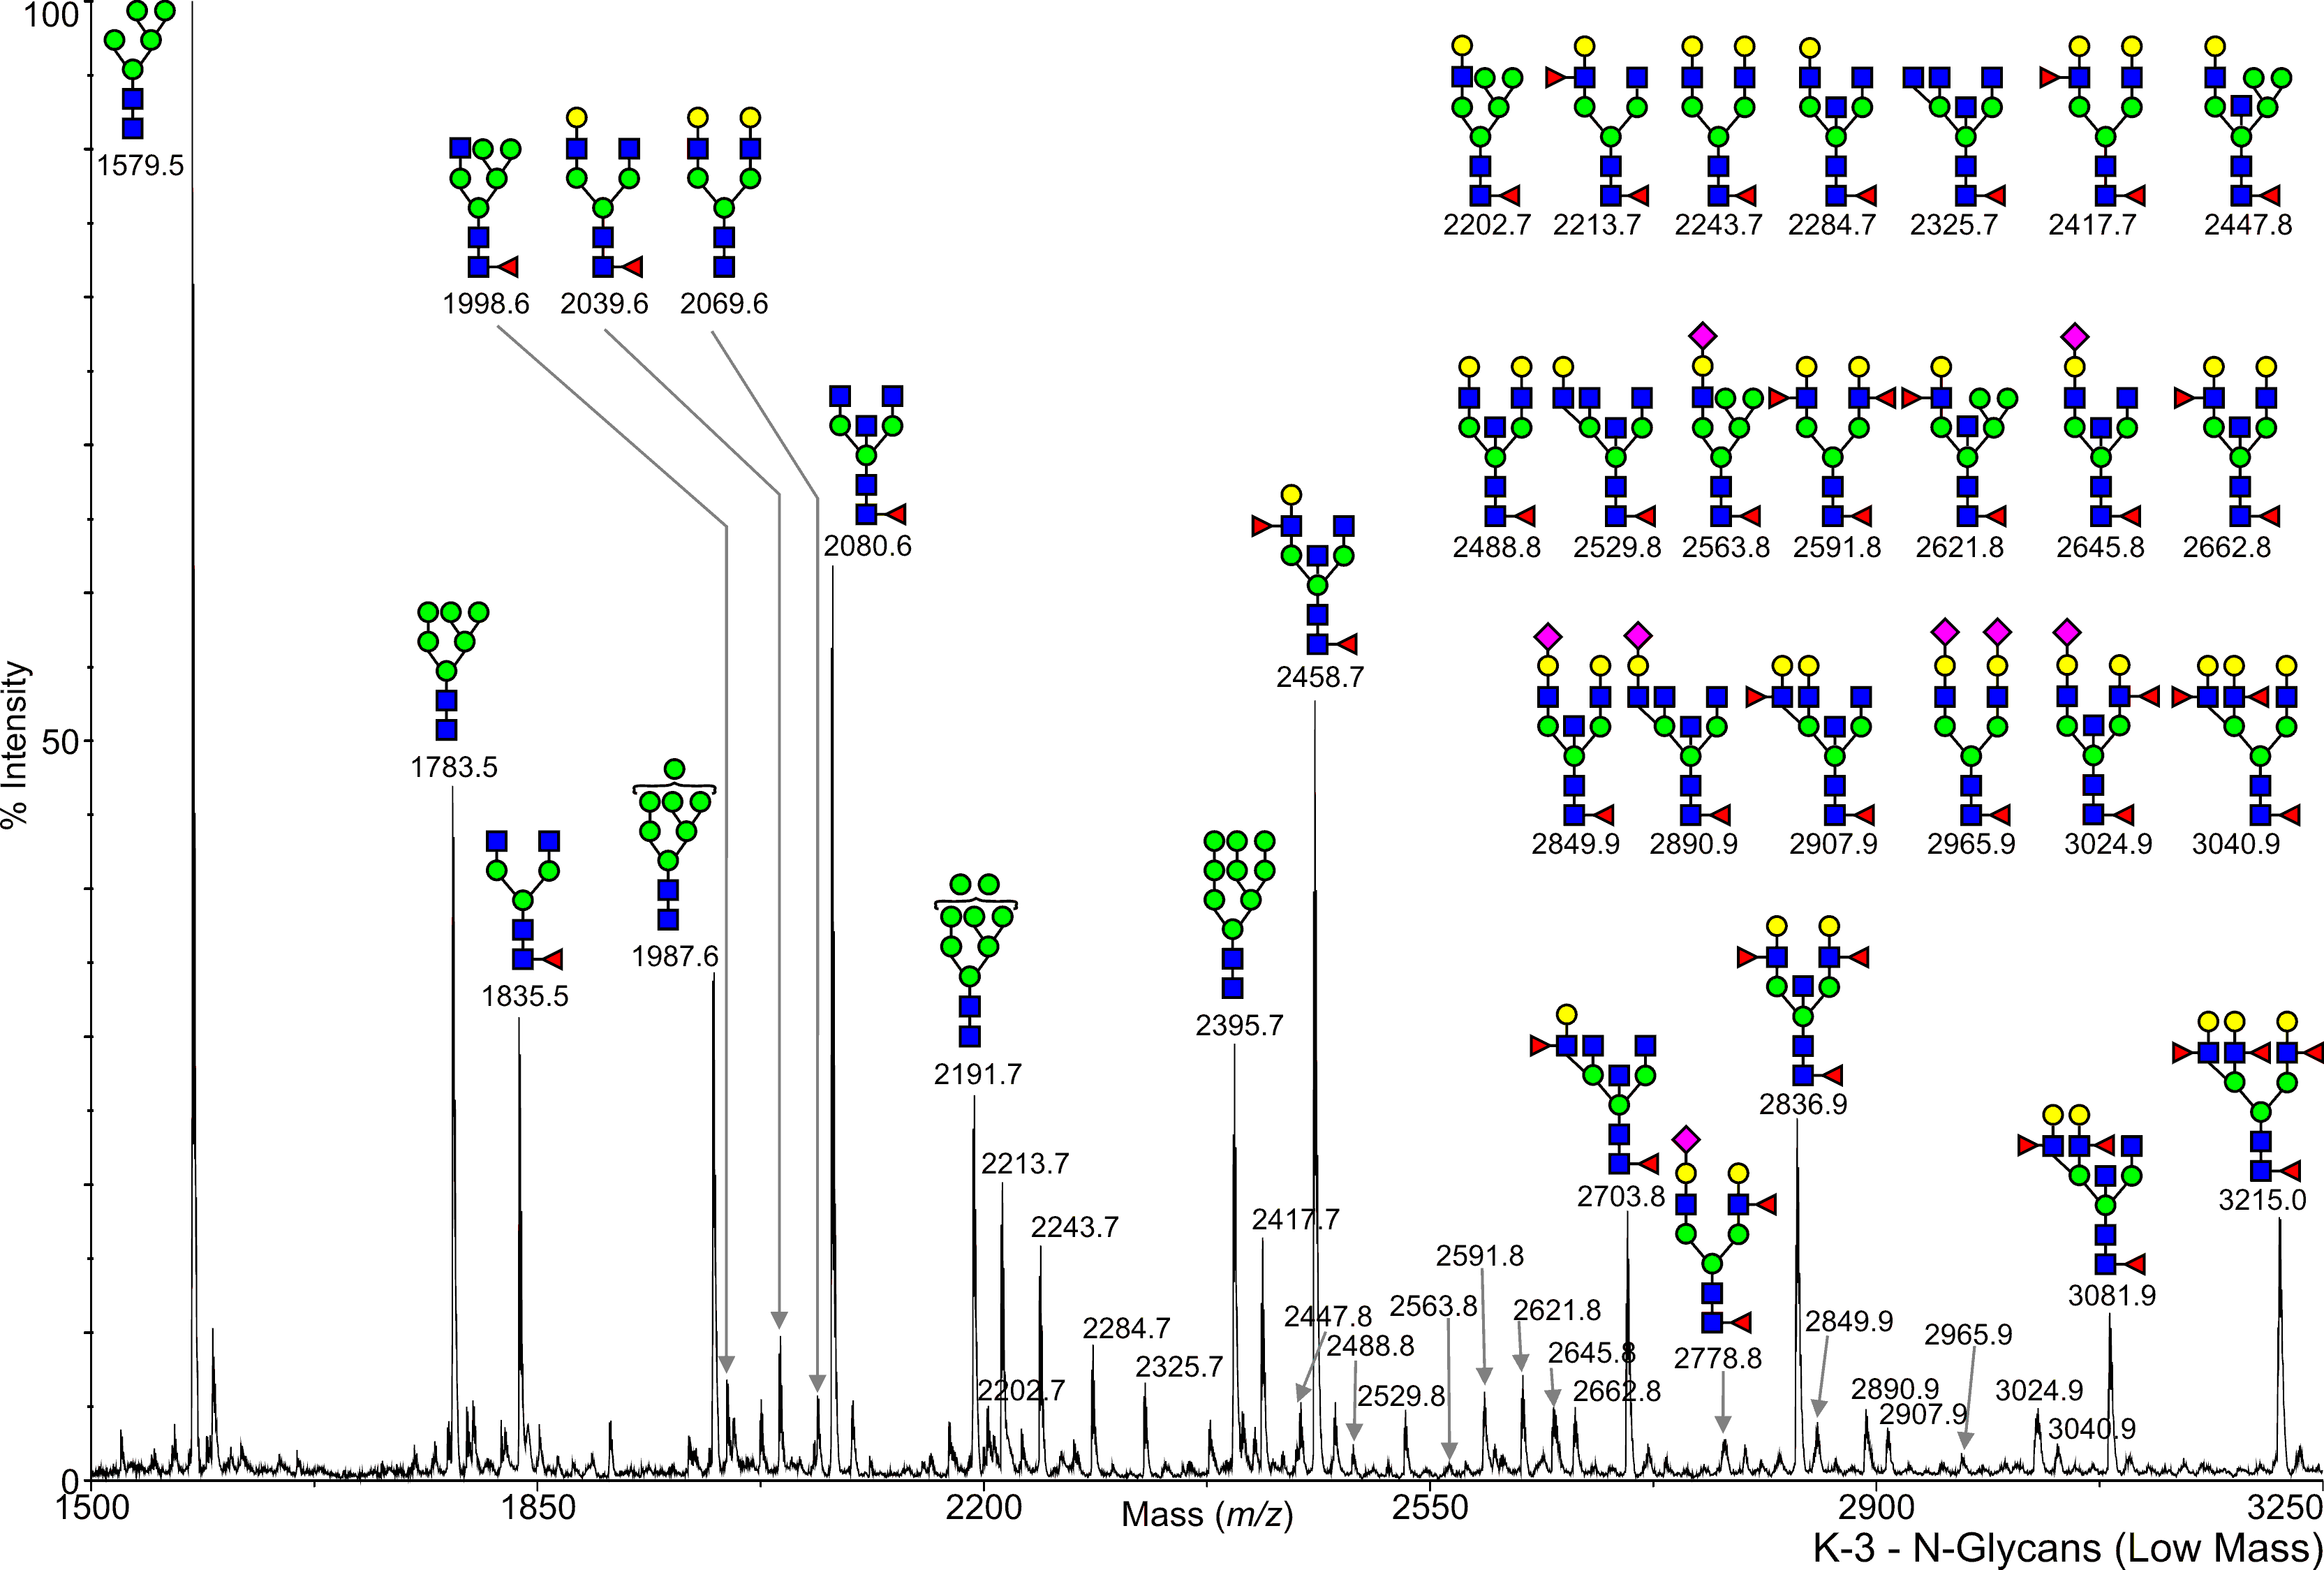
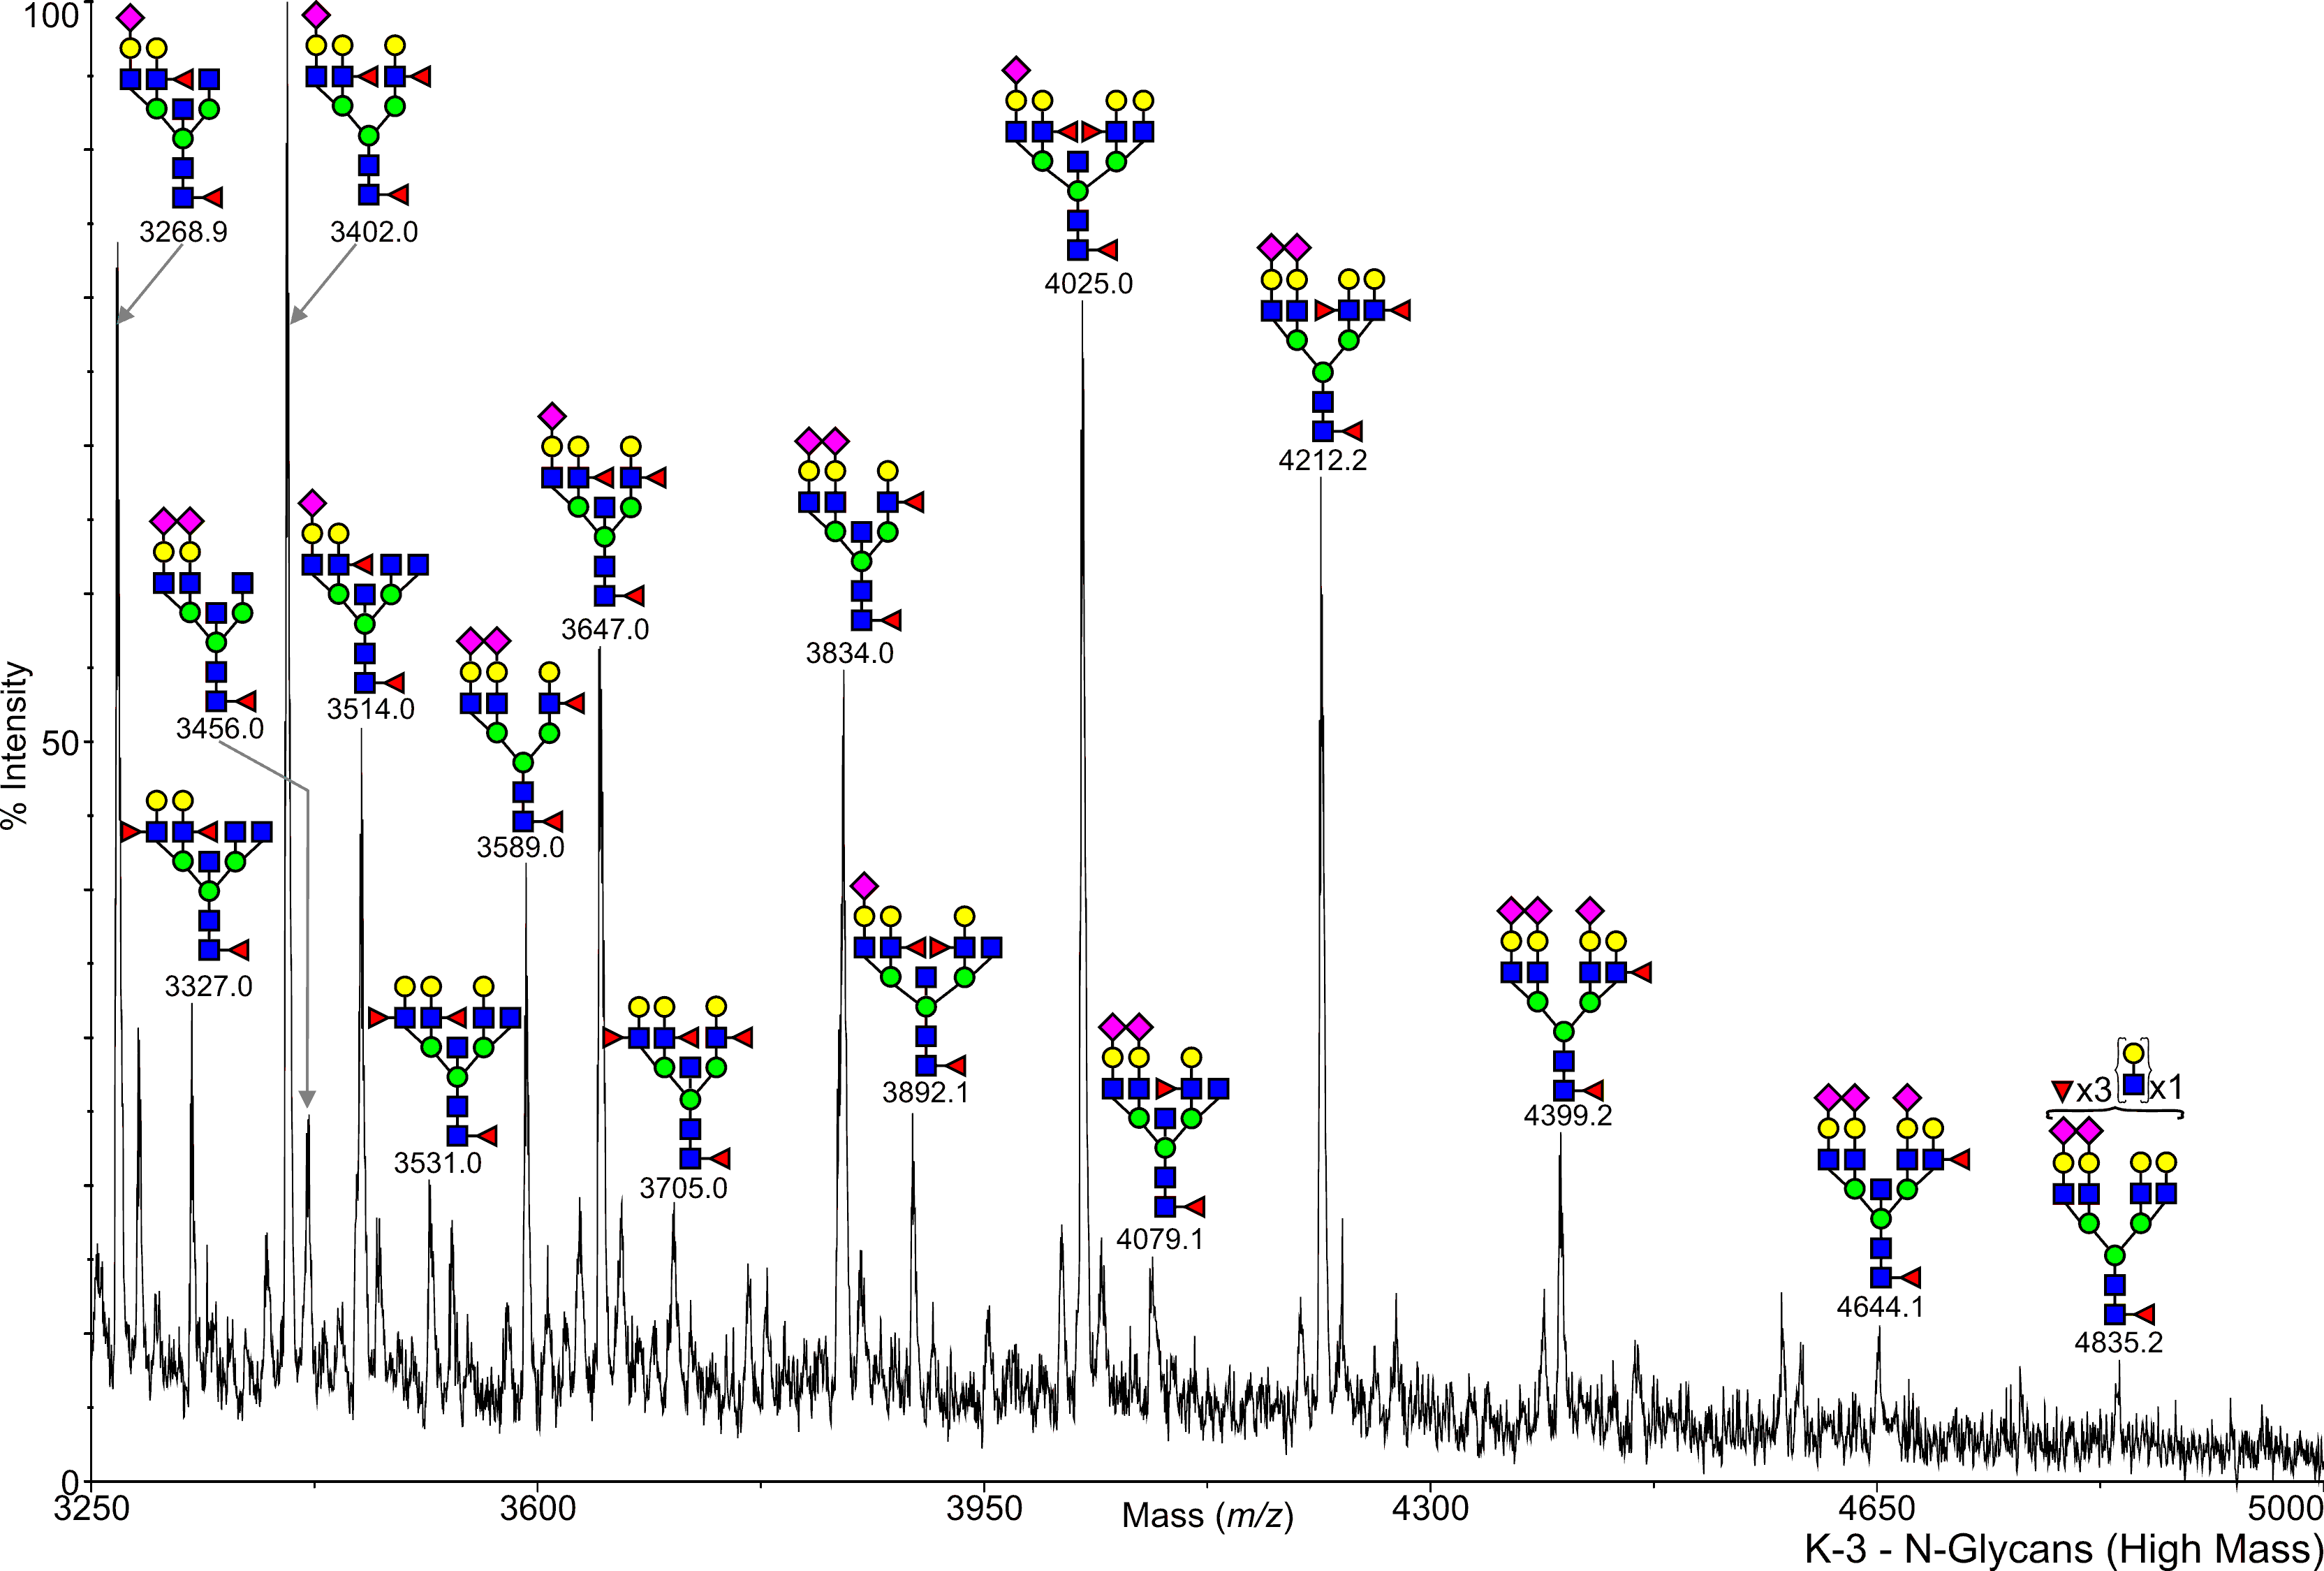
Mouse Fbx02 knockout Brain K3 N-Linked C57BL/6 Paulson, Henry View experimental details      
Annotated file for lower mass range in JPG formatAnnotated file for higher mass range in JPG format Annotated file for lower mass range in PDF formatAnnotated file for higher mass range in PDF format
View Mass Spectrum data as text View Mass Peak file   Interactive Mass Spectrum Viewer
cfg_rRequest_406
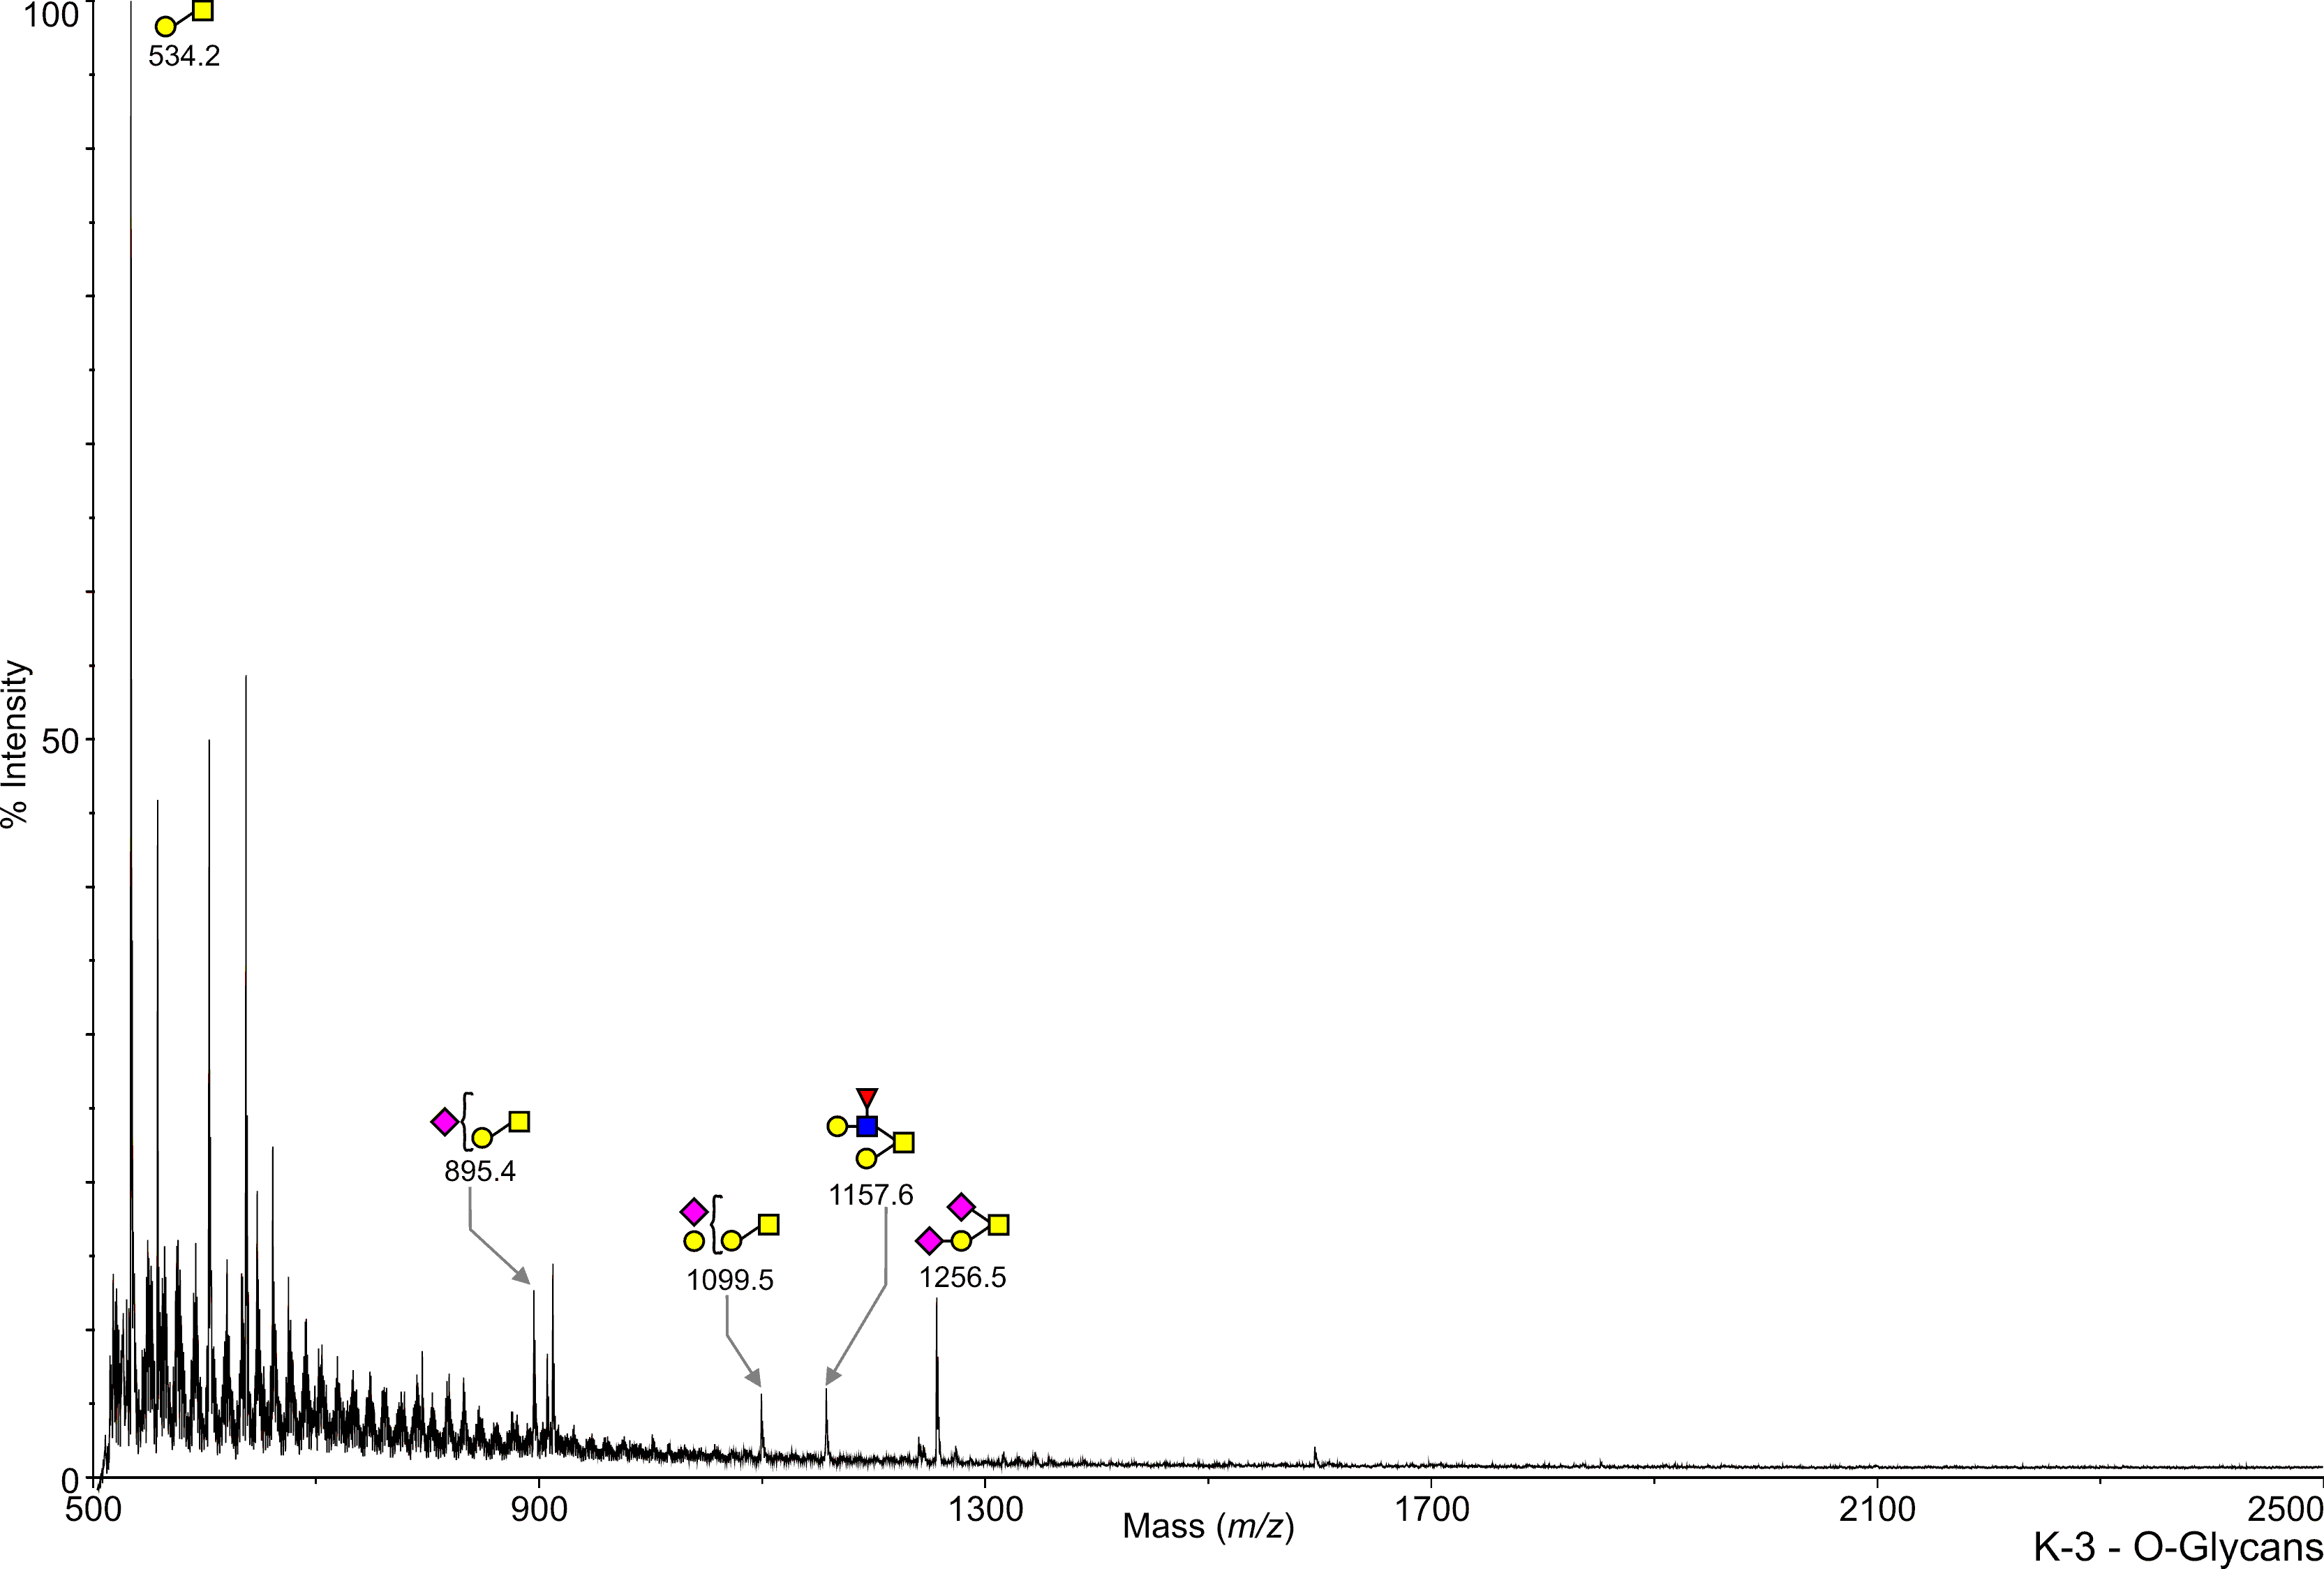
Mouse Fbx02 knockout Brain K3 O-Linked C57BL/6 Paulson, Henry View experimental details      
Annotated file in JPG format Annotated file in PDF format
View Mass Spectrum data as text View Mass Peak file   Interactive Mass Spectrum Viewer
cfg_rRequest_406
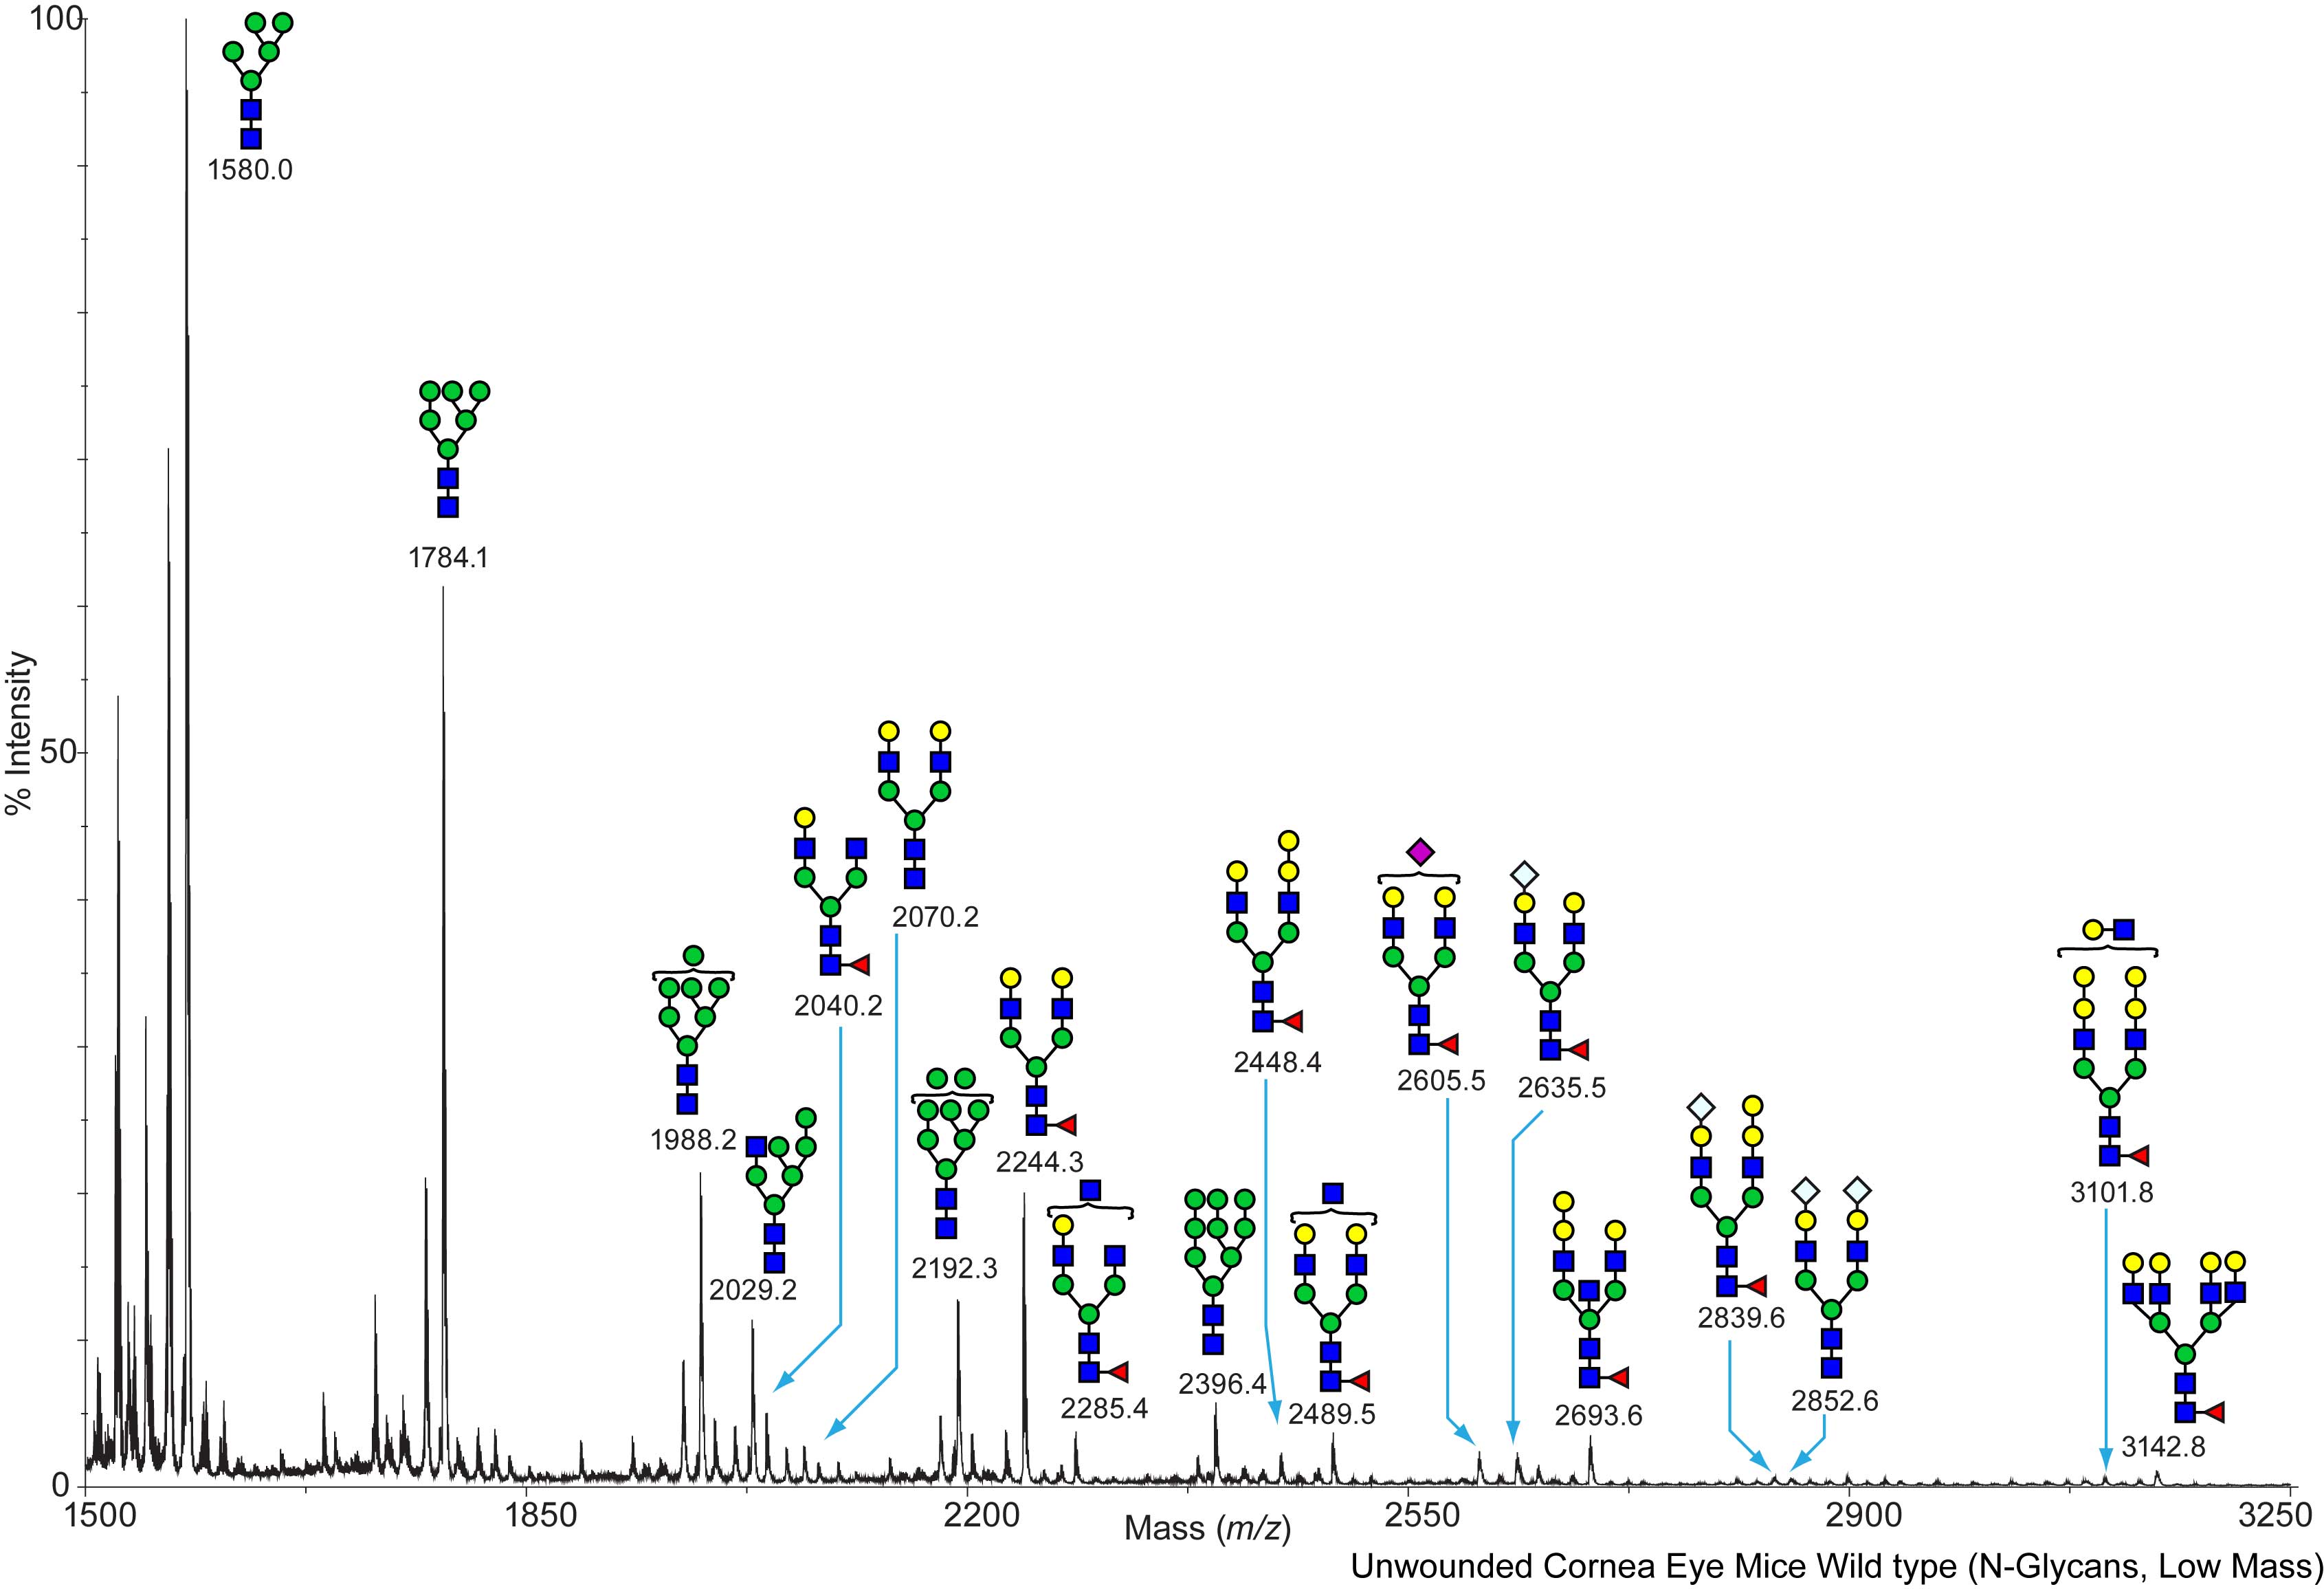
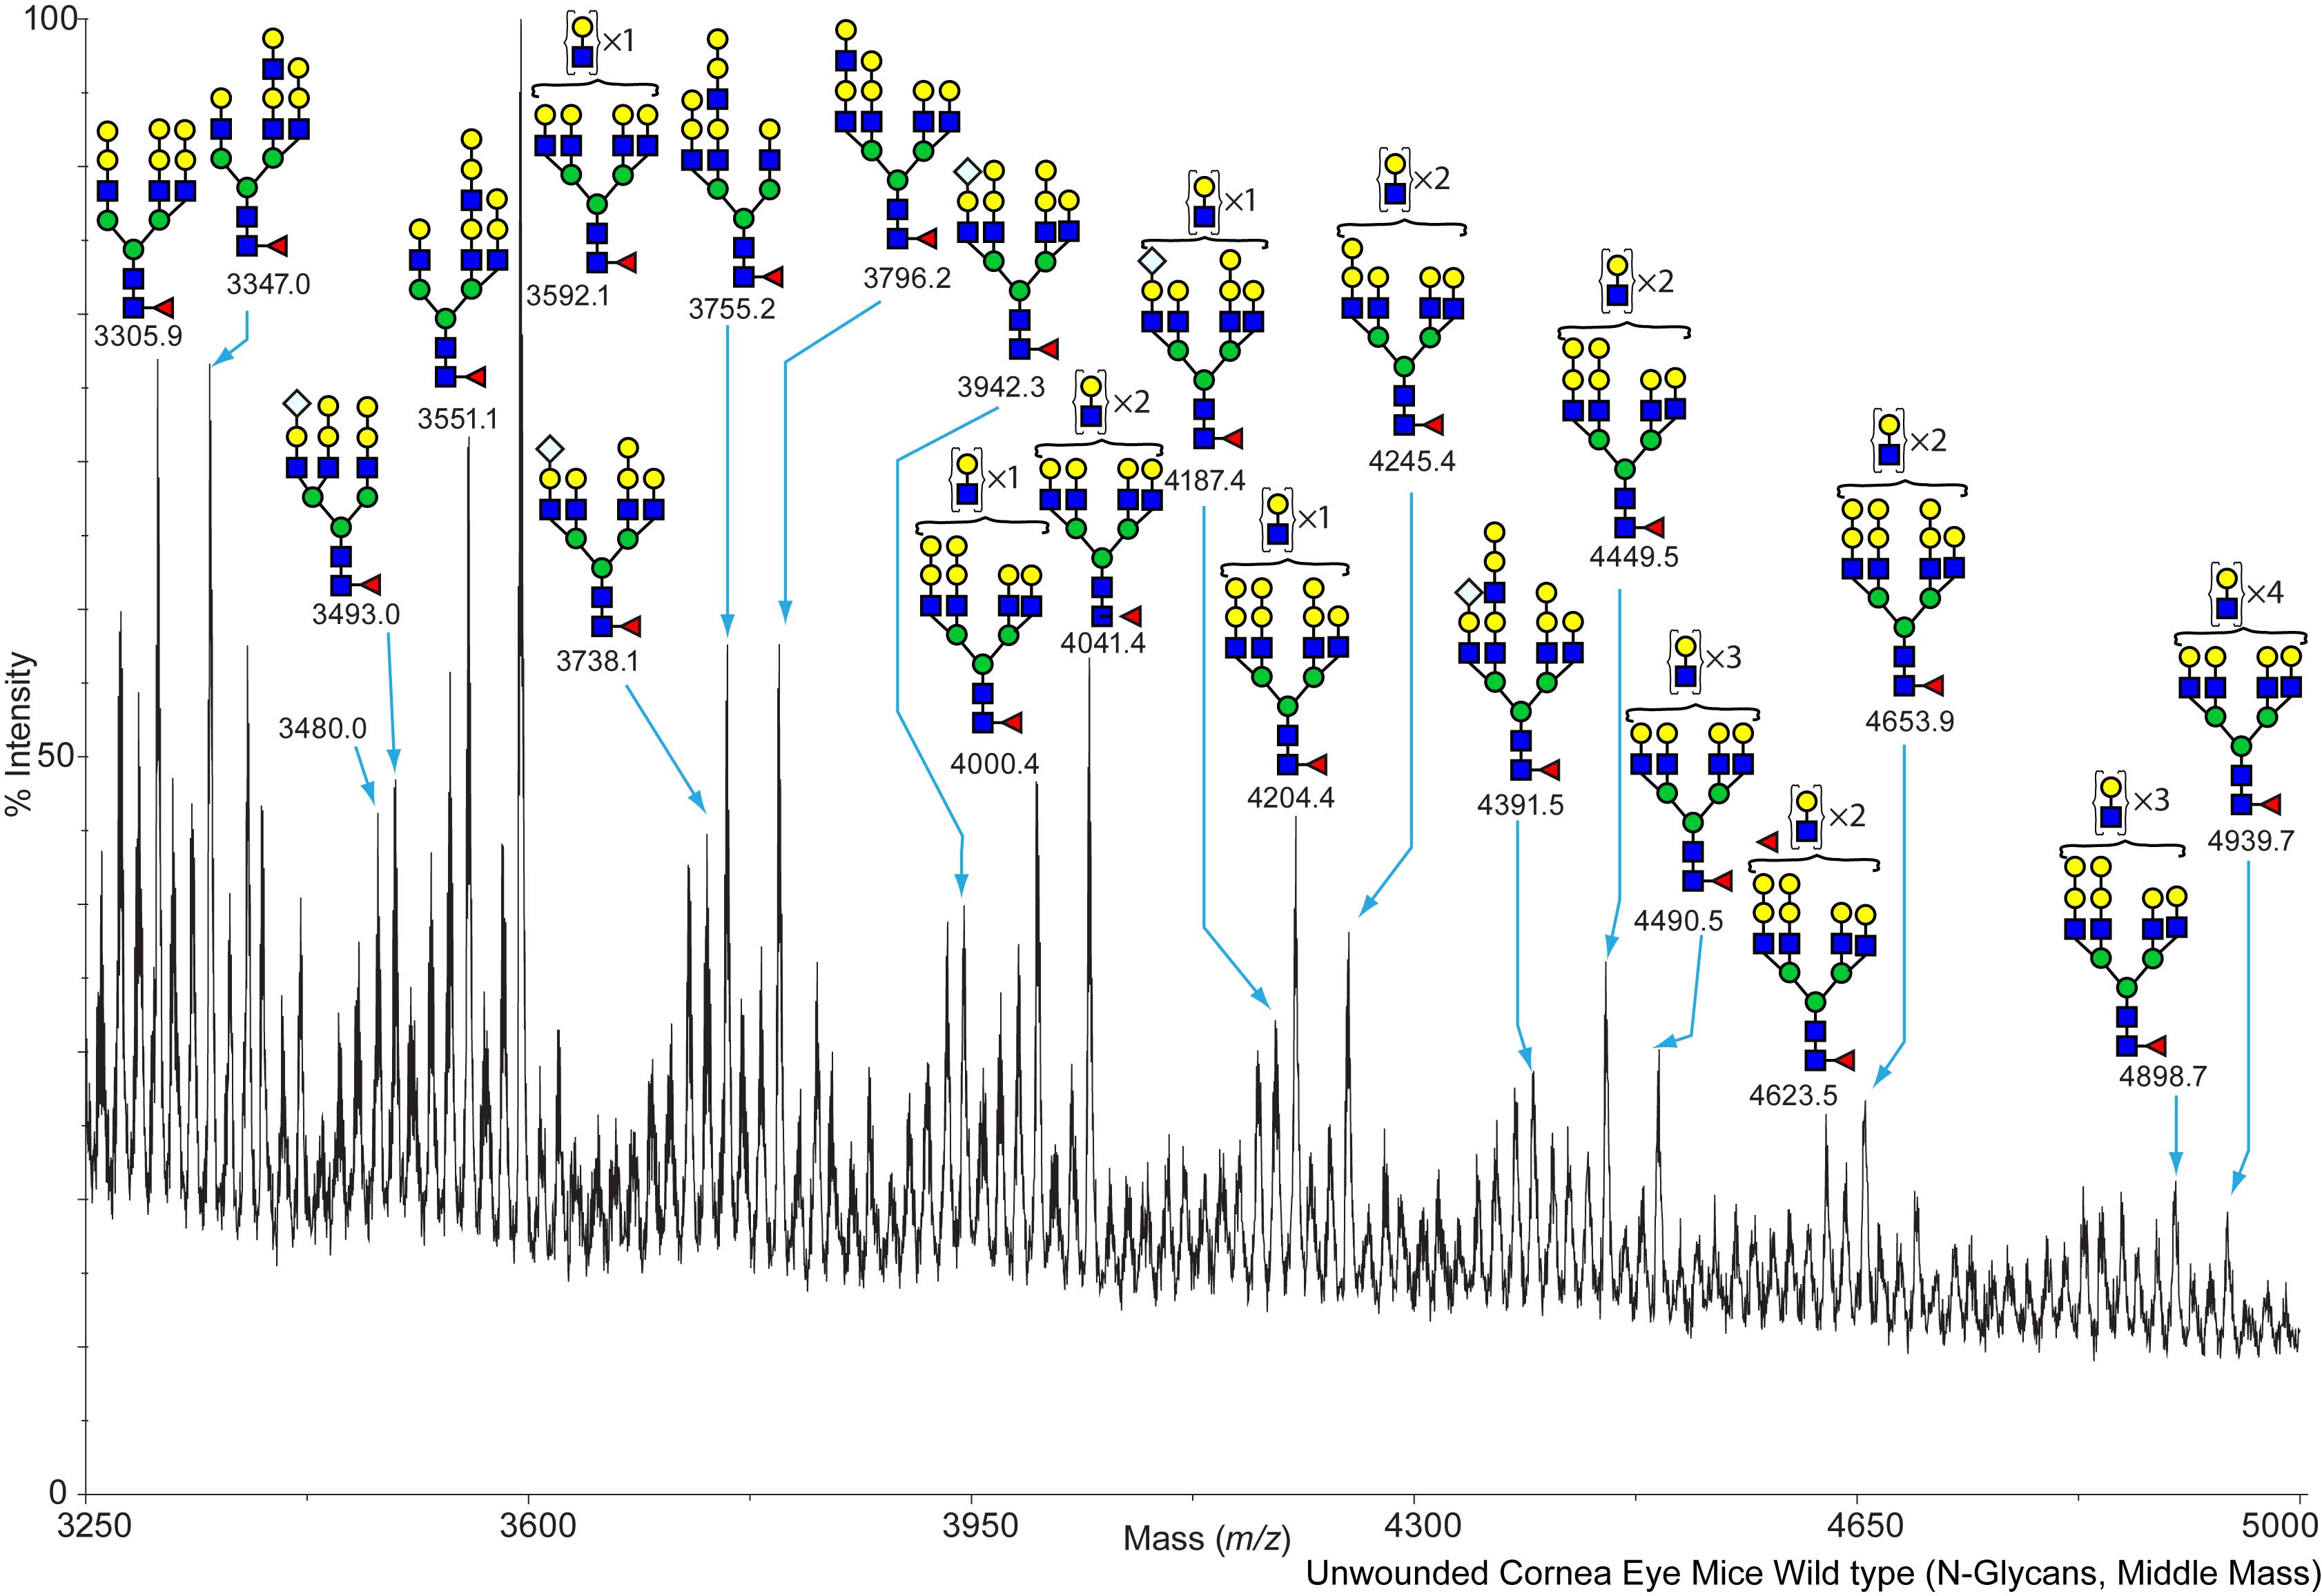
Mouse Wild Type Cornea Murine corneas, unwounded WT, NG N-Linked C57BL/6 Panjwani, Noorjahan View experimental details      
Annotated file for lower mass range in JPG formatAnnotated file for higher mass range in JPG format Annotated file for lower mass range in PDF formatAnnotated file for higher mass range in PDF format
View Mass Spectrum data as text View Mass Peak file   Interactive Mass Spectrum Viewer
cfg_rRequest_434
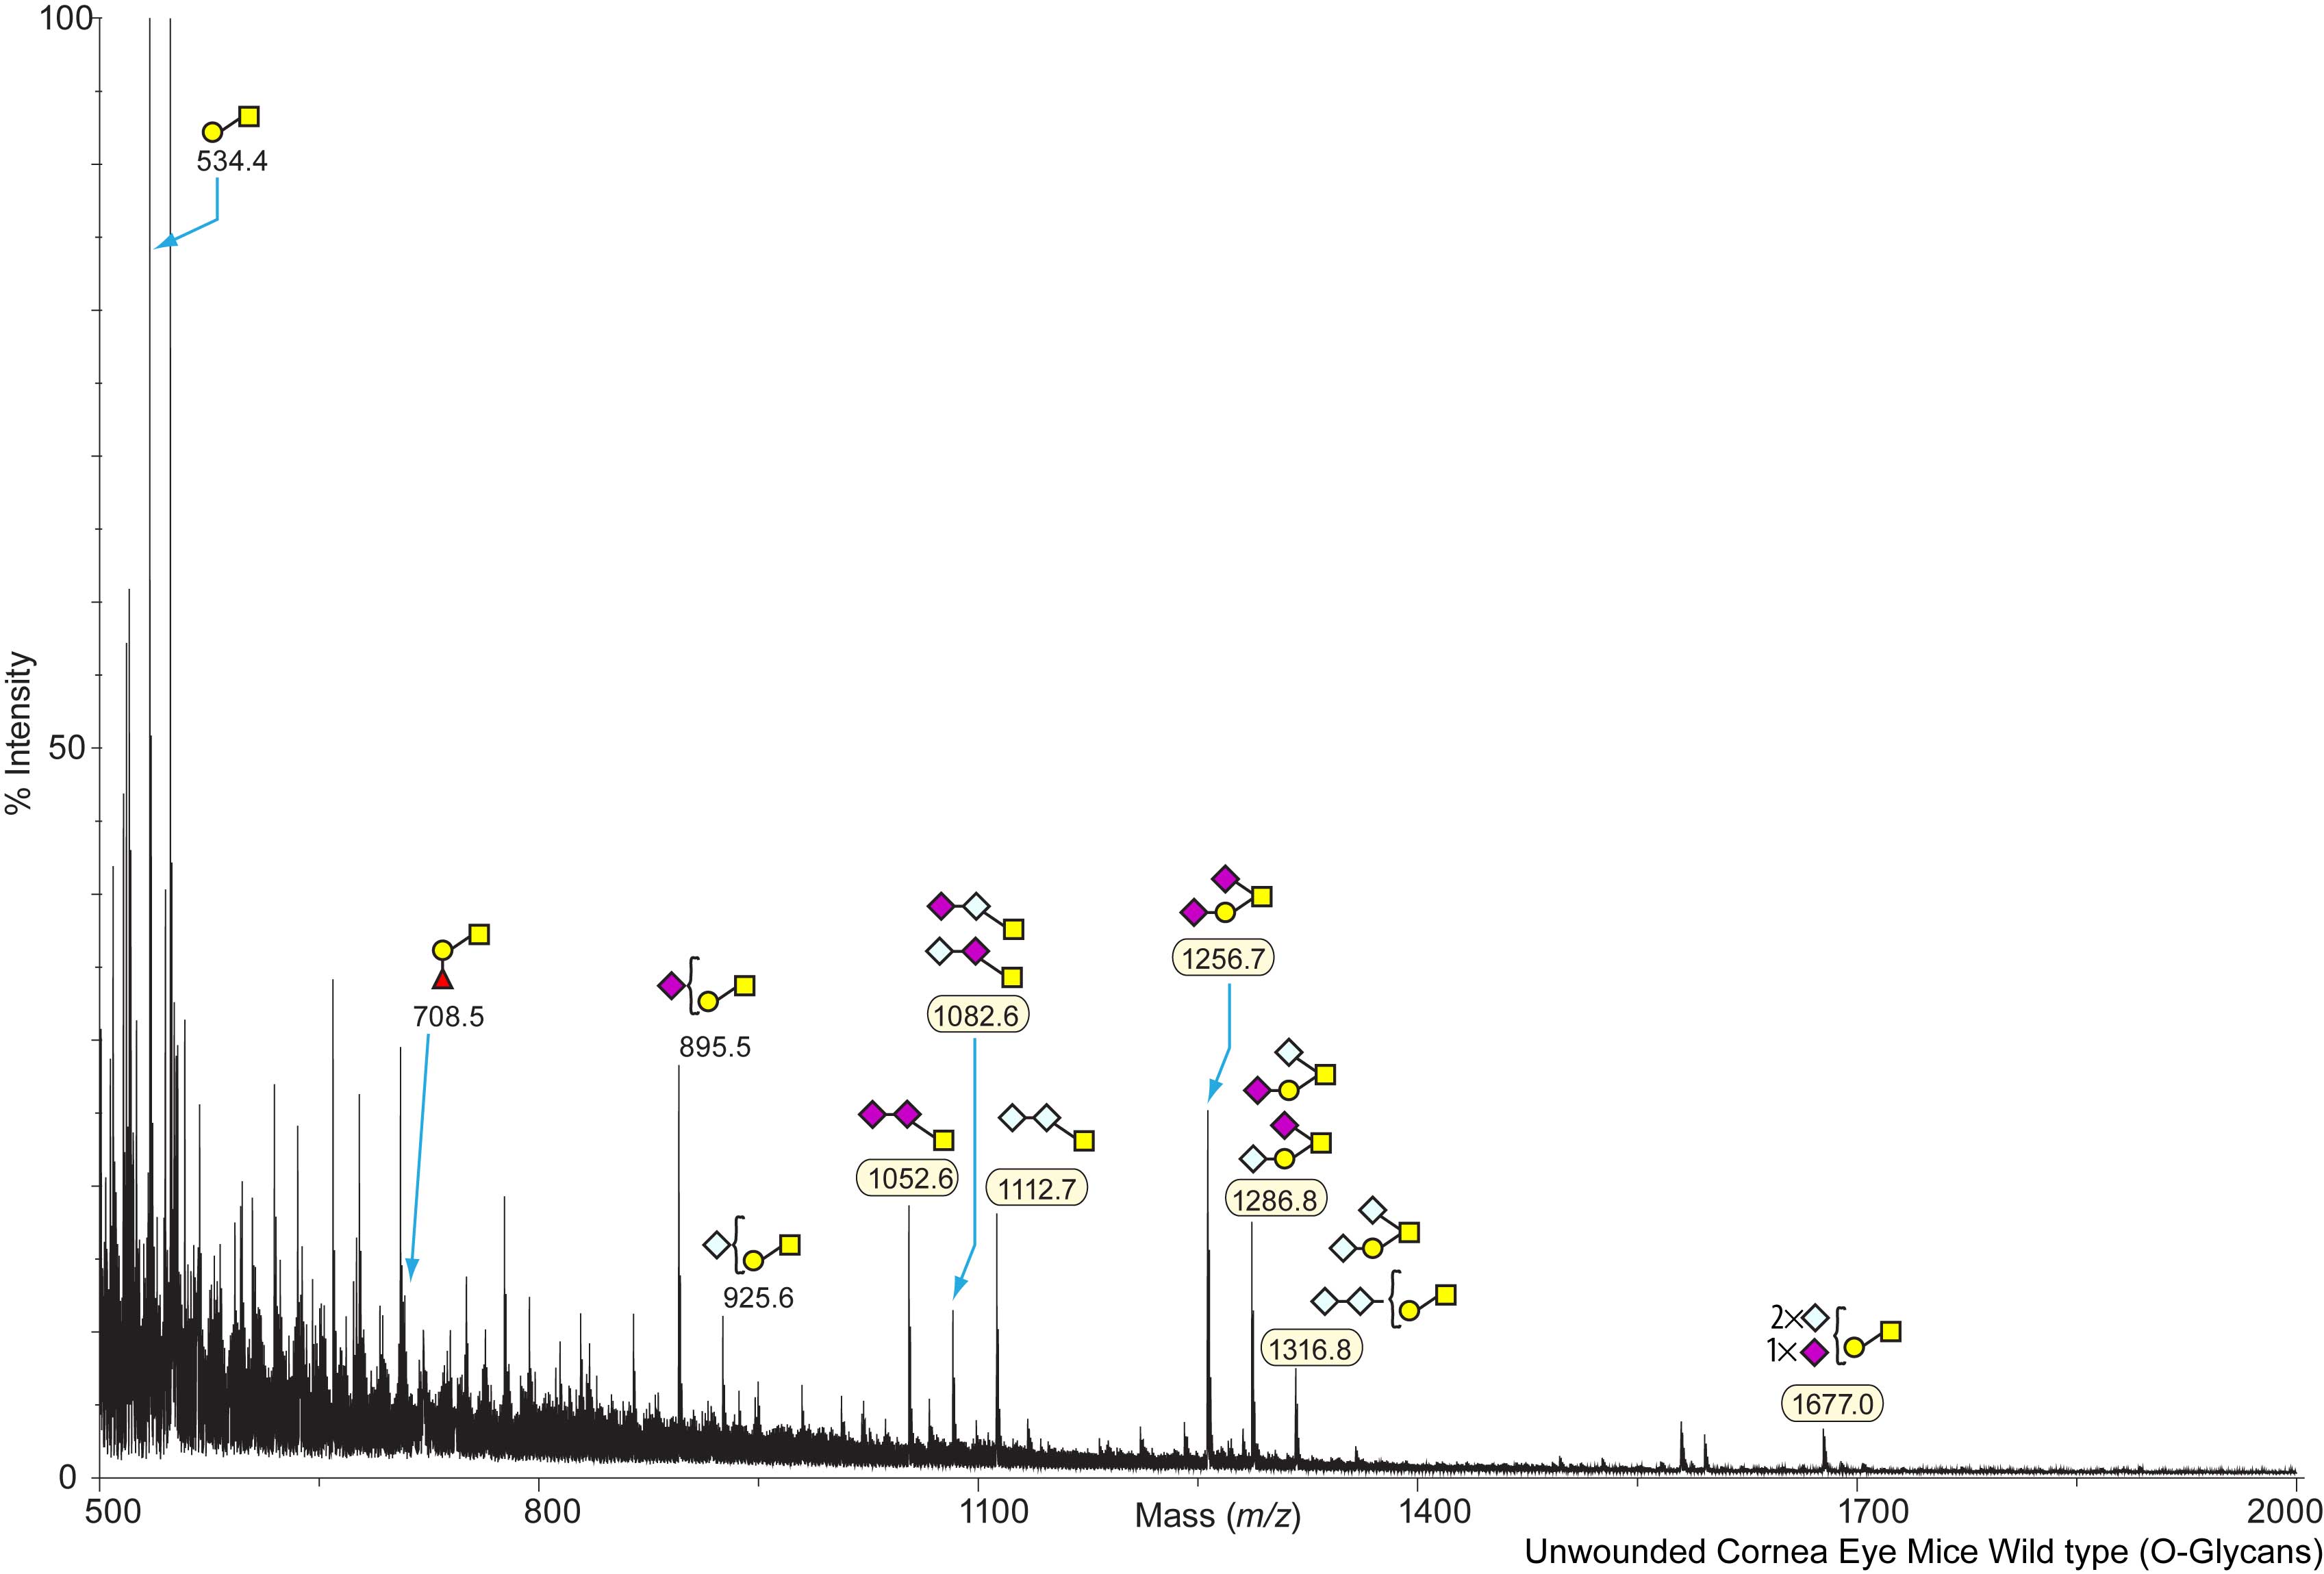
Mouse Wild Type Cornea Murine corneas, unwounded WT, OG O-Linked C57BL/6 Panjwani, Noorjahan View experimental details      
Annotated file in JPG format Annotated file in PDF format
View Mass Spectrum data as text View Mass Peak file   Interactive Mass Spectrum Viewer
cfg_rRequest_434
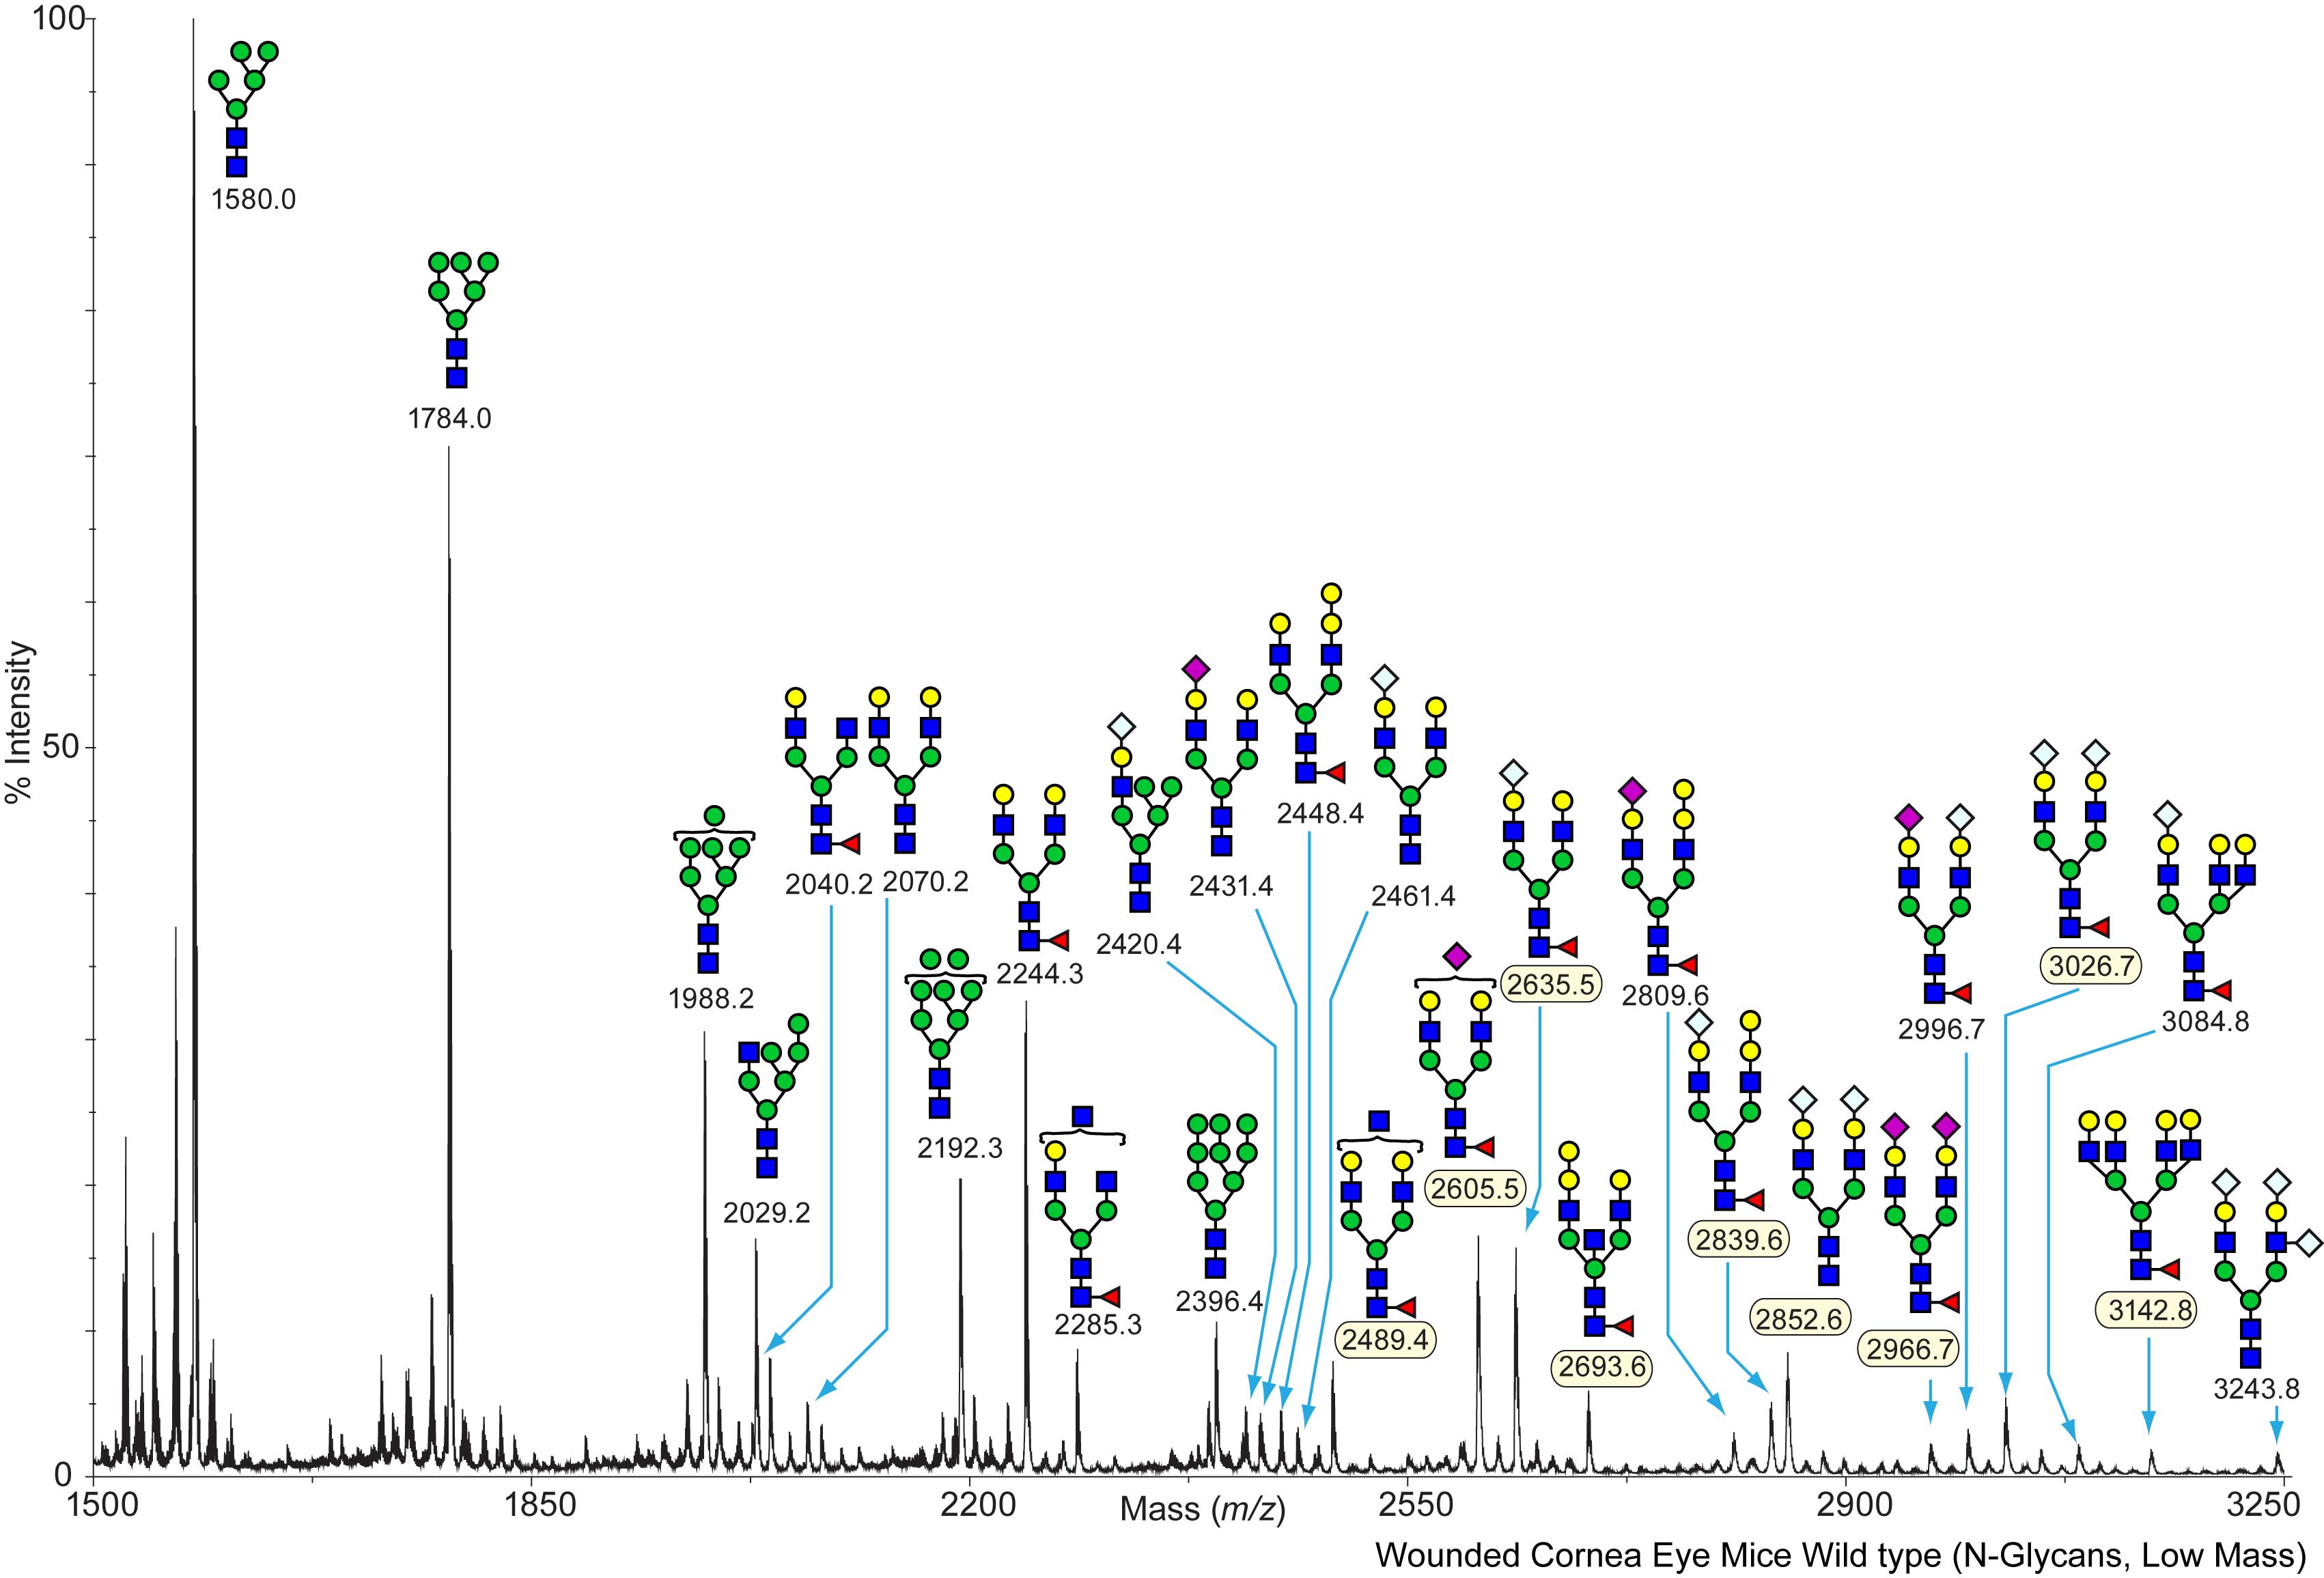
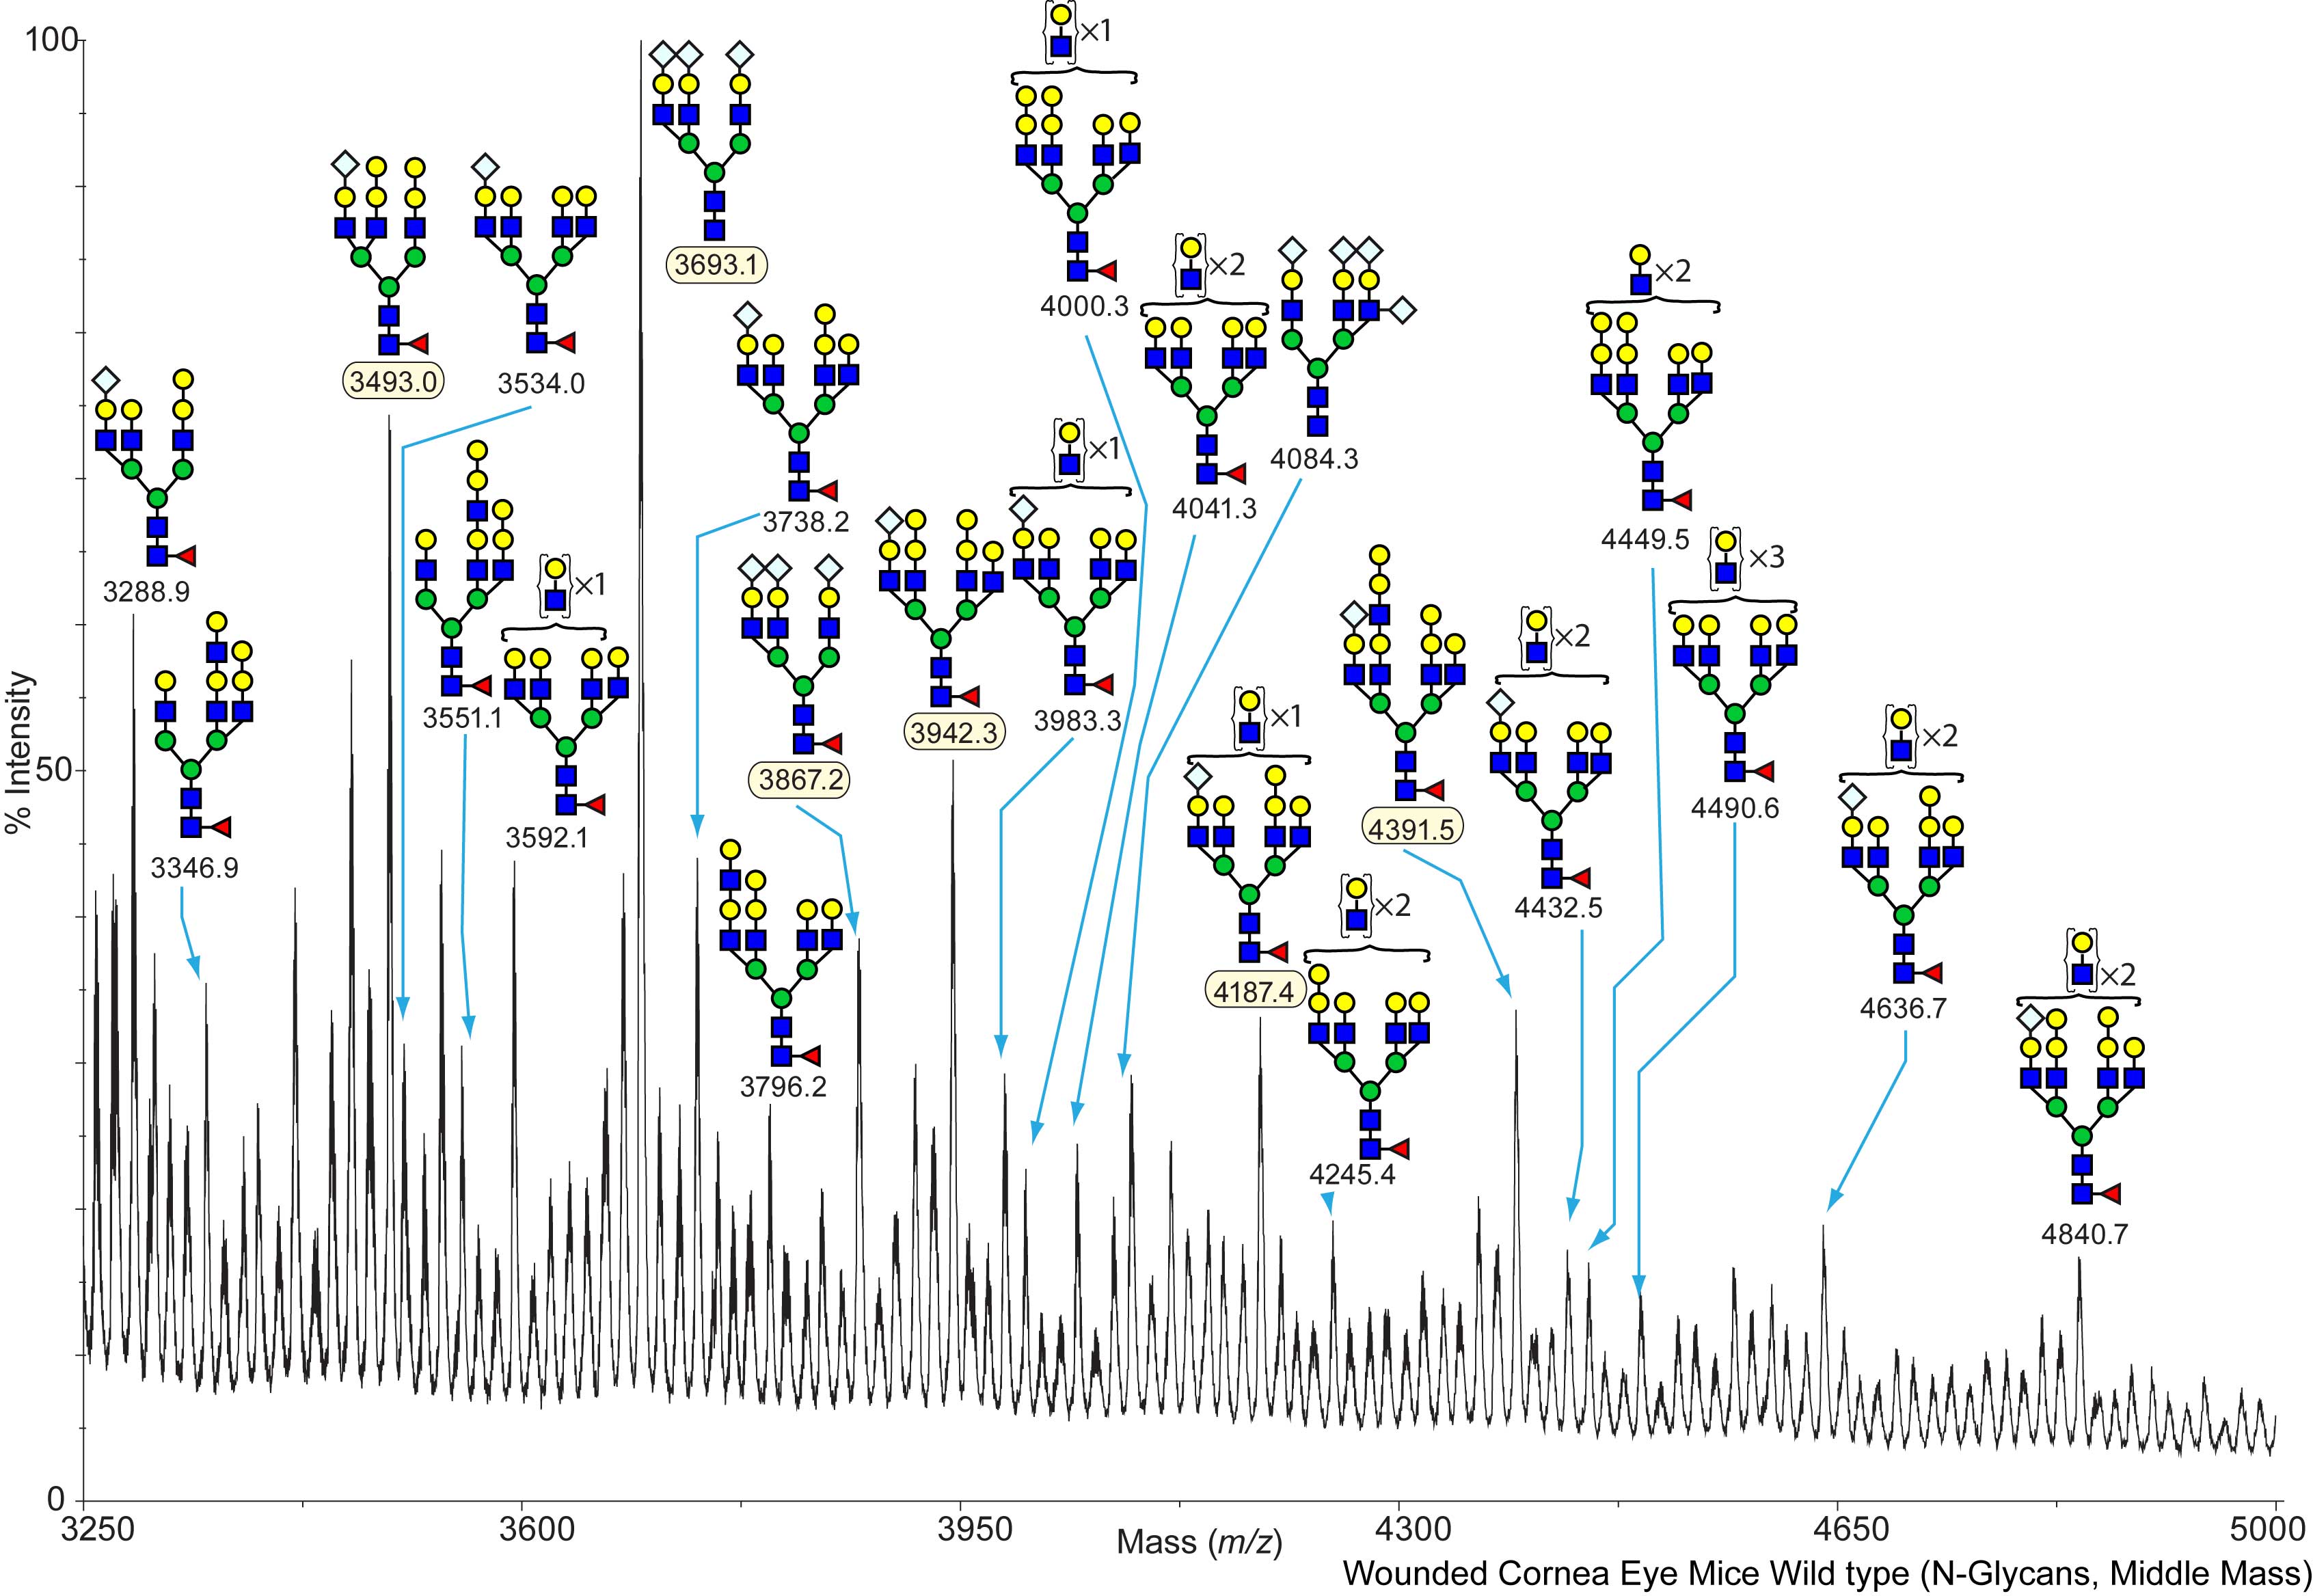
Mouse Wild Type Cornea Murine corneas, wounded WT, NG N-Linked C57BL/6 Panjwani, Noorjahan View experimental details      
Annotated file for lower mass range in JPG formatAnnotated file for higher mass range in JPG format Annotated file for lower mass range in PDF formatAnnotated file for higher mass range in PDF format
View Mass Spectrum data as text View Mass Peak file   Interactive Mass Spectrum Viewer
cfg_rRequest_434
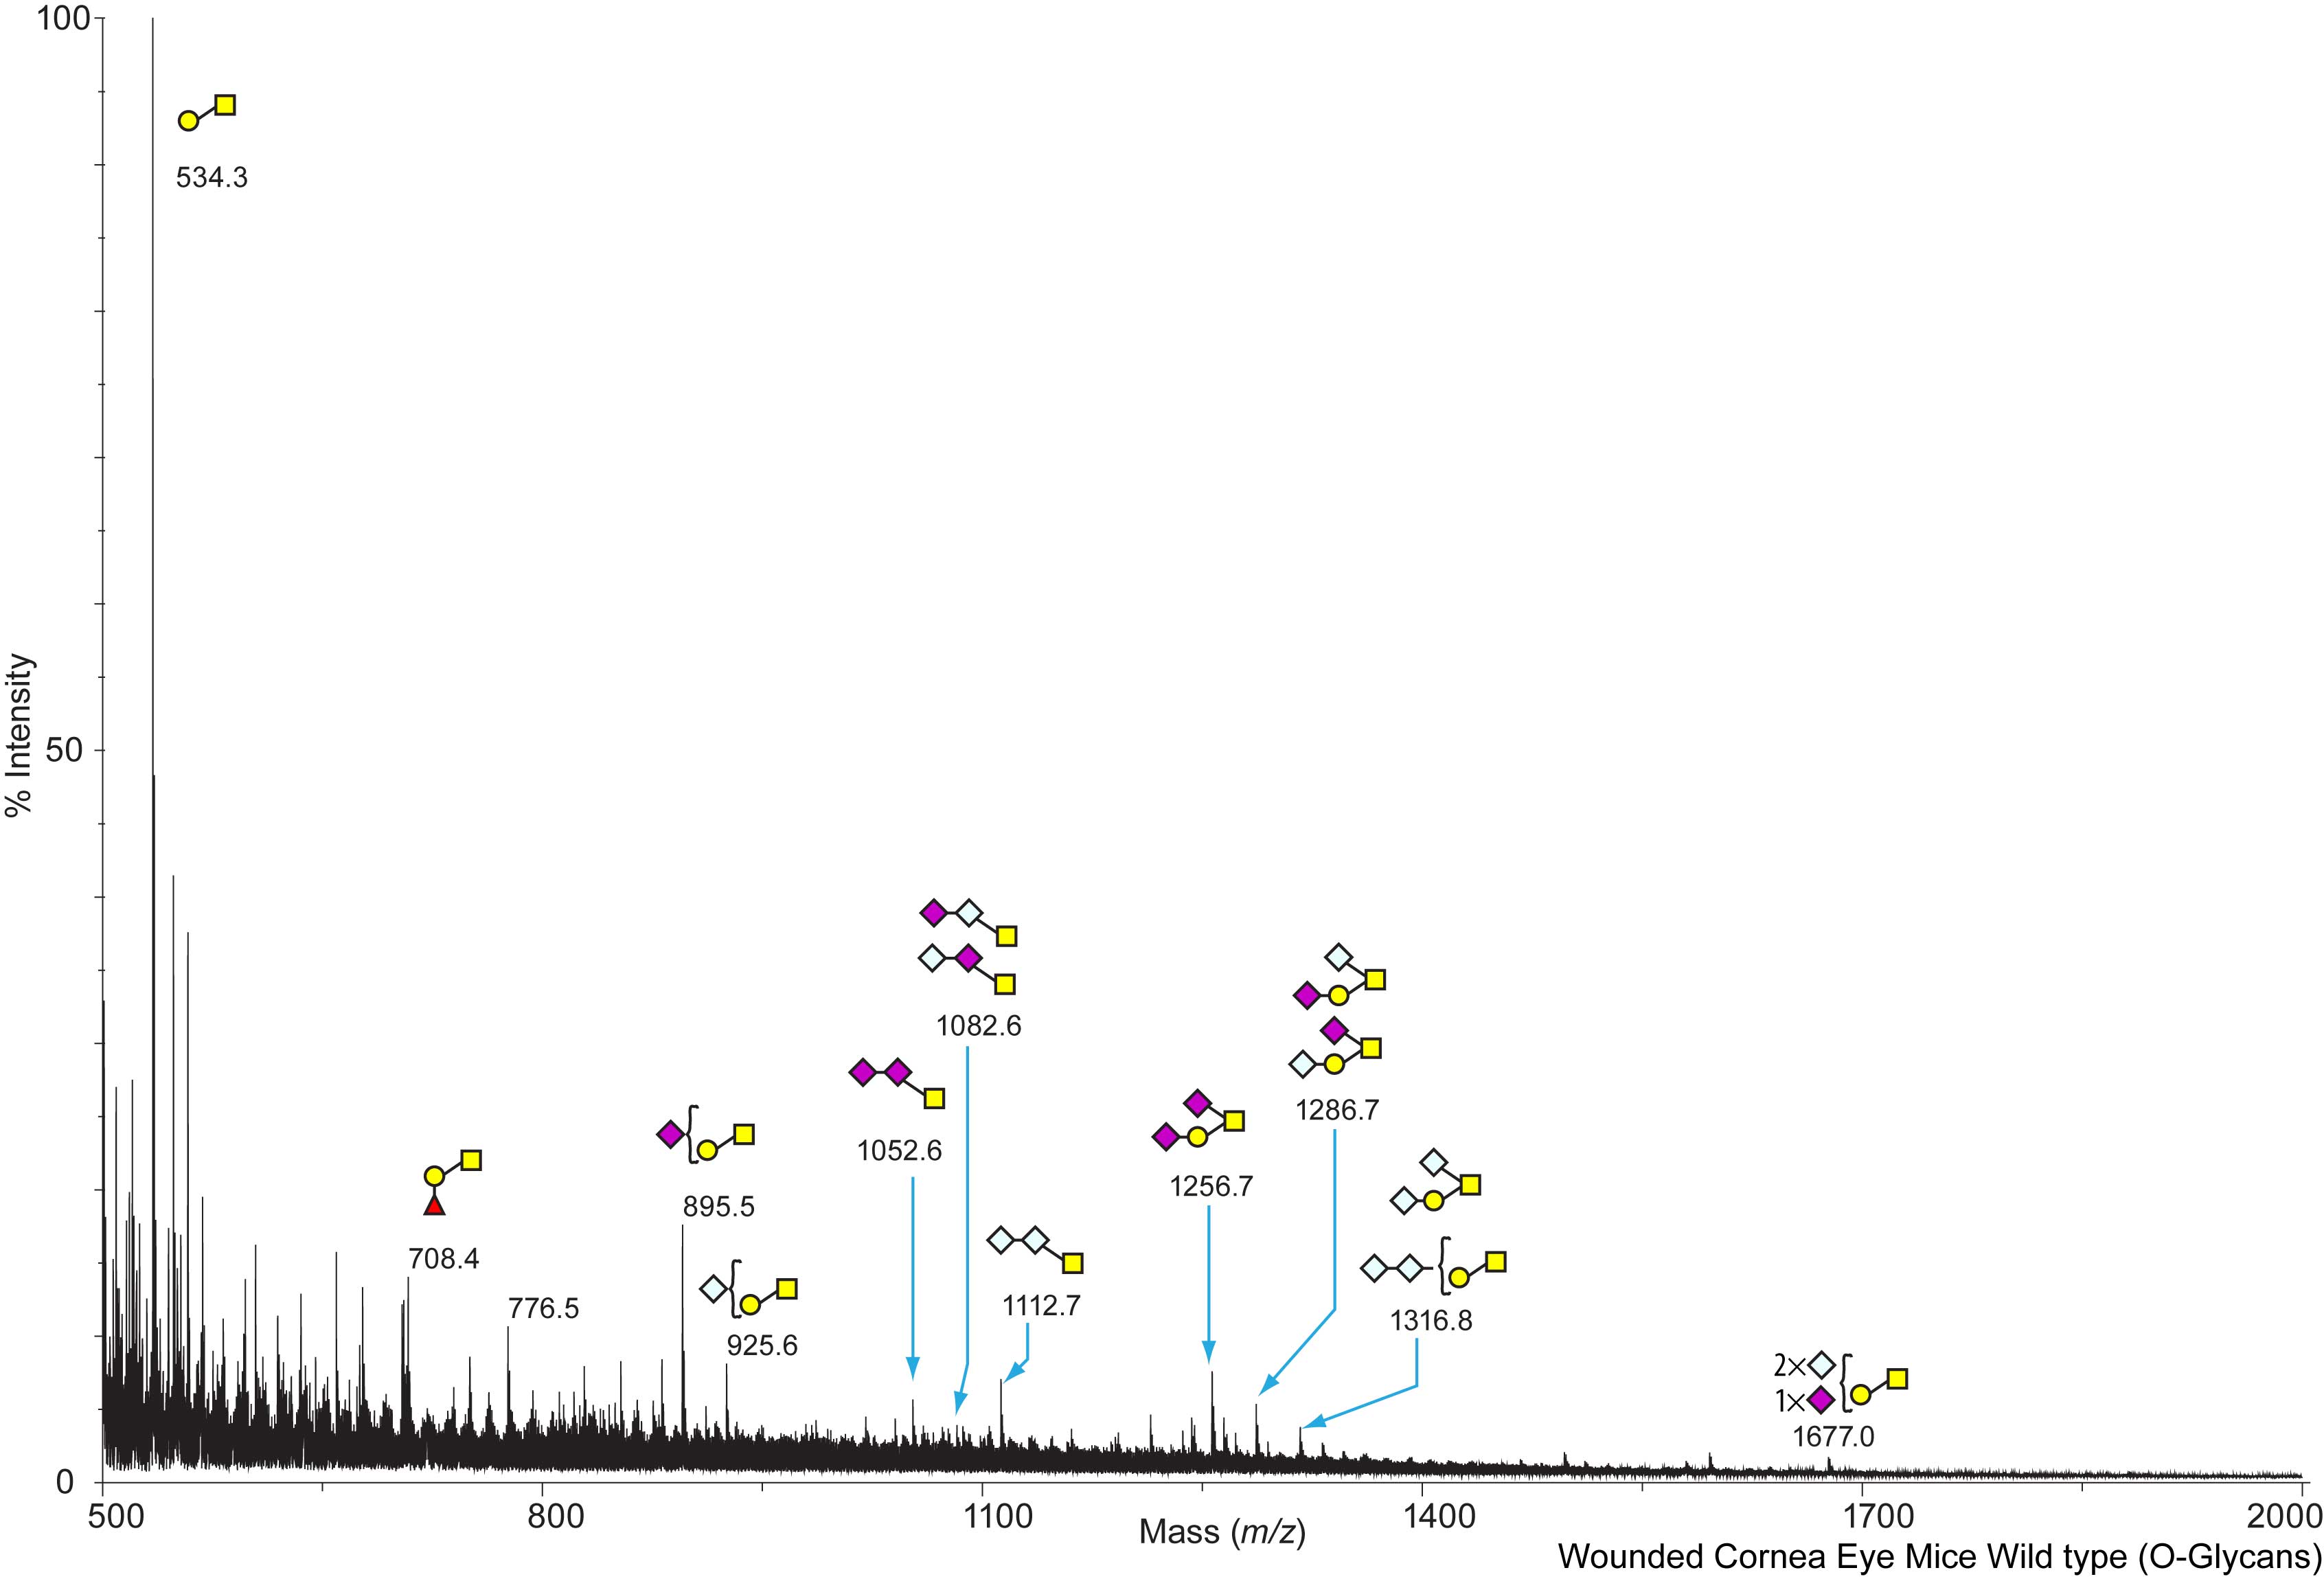
Mouse Wild Type Cornea Murine corneas, wounded WT, OG O-Linked C57BL/6 Panjwani, Noorjahan View experimental details      
Annotated file in JPG format Annotated file in PDF format
View Mass Spectrum data as text View Mass Peak file   Interactive Mass Spectrum Viewer
cfg_rRequest_434
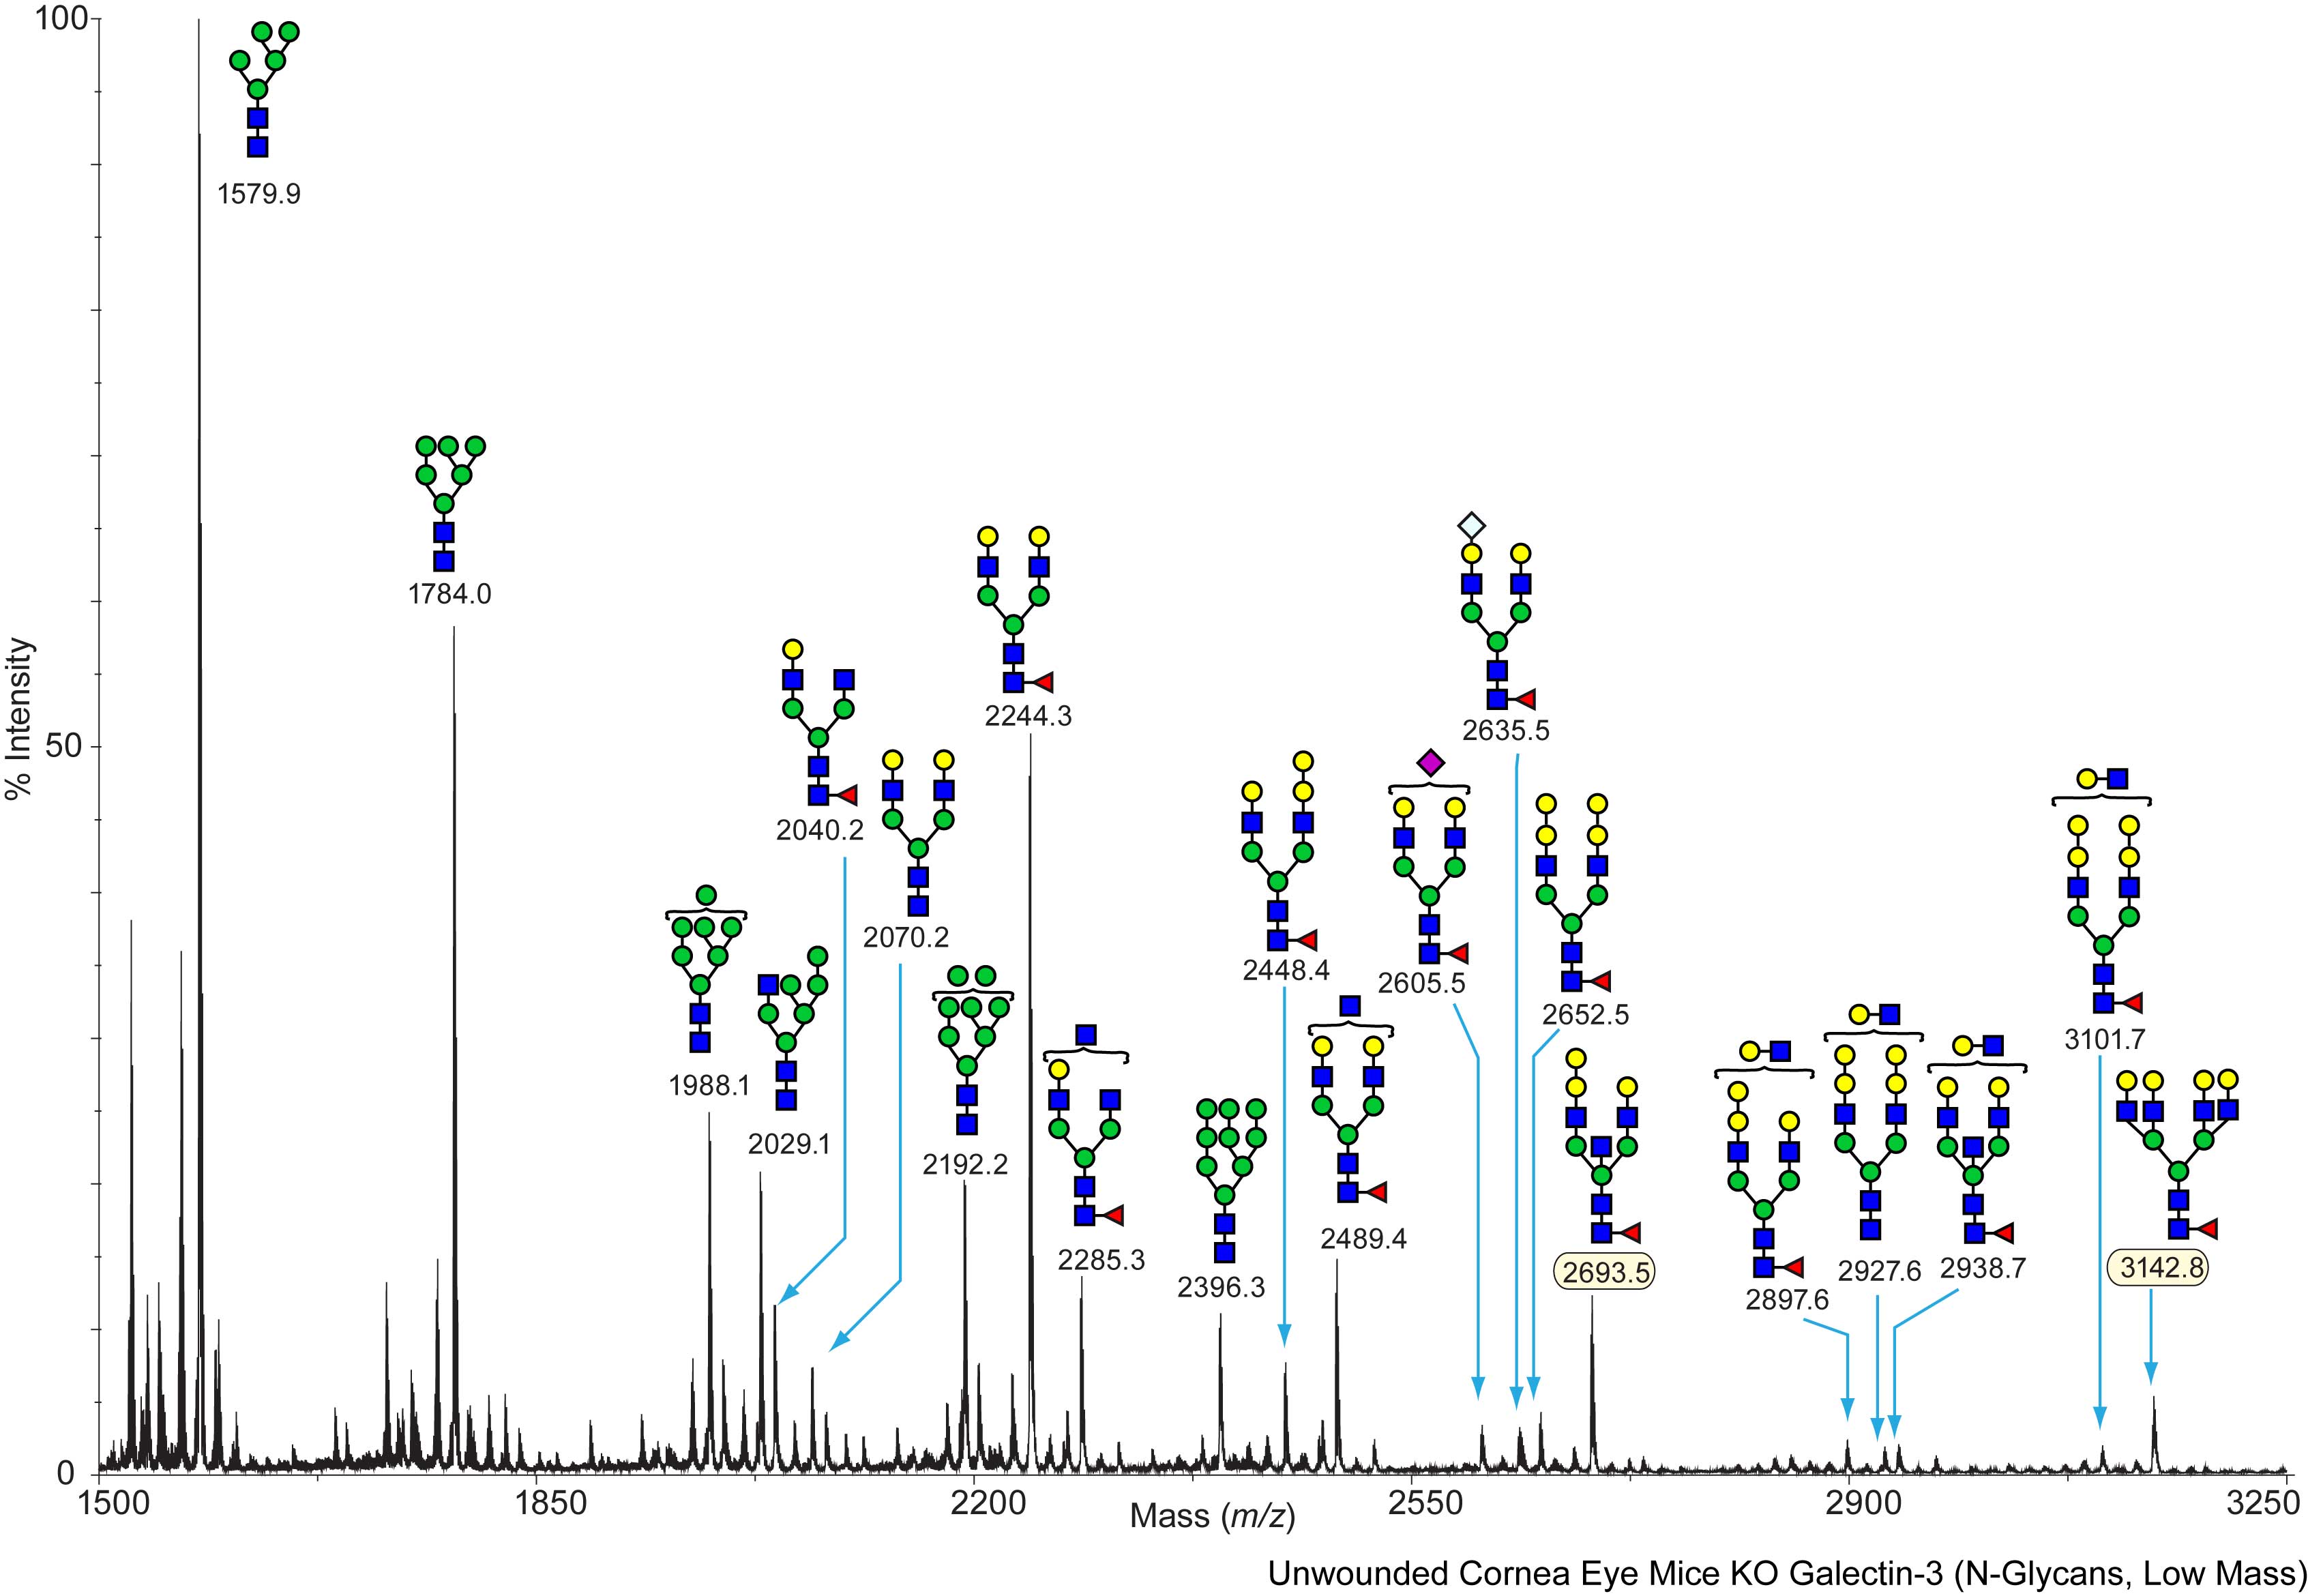
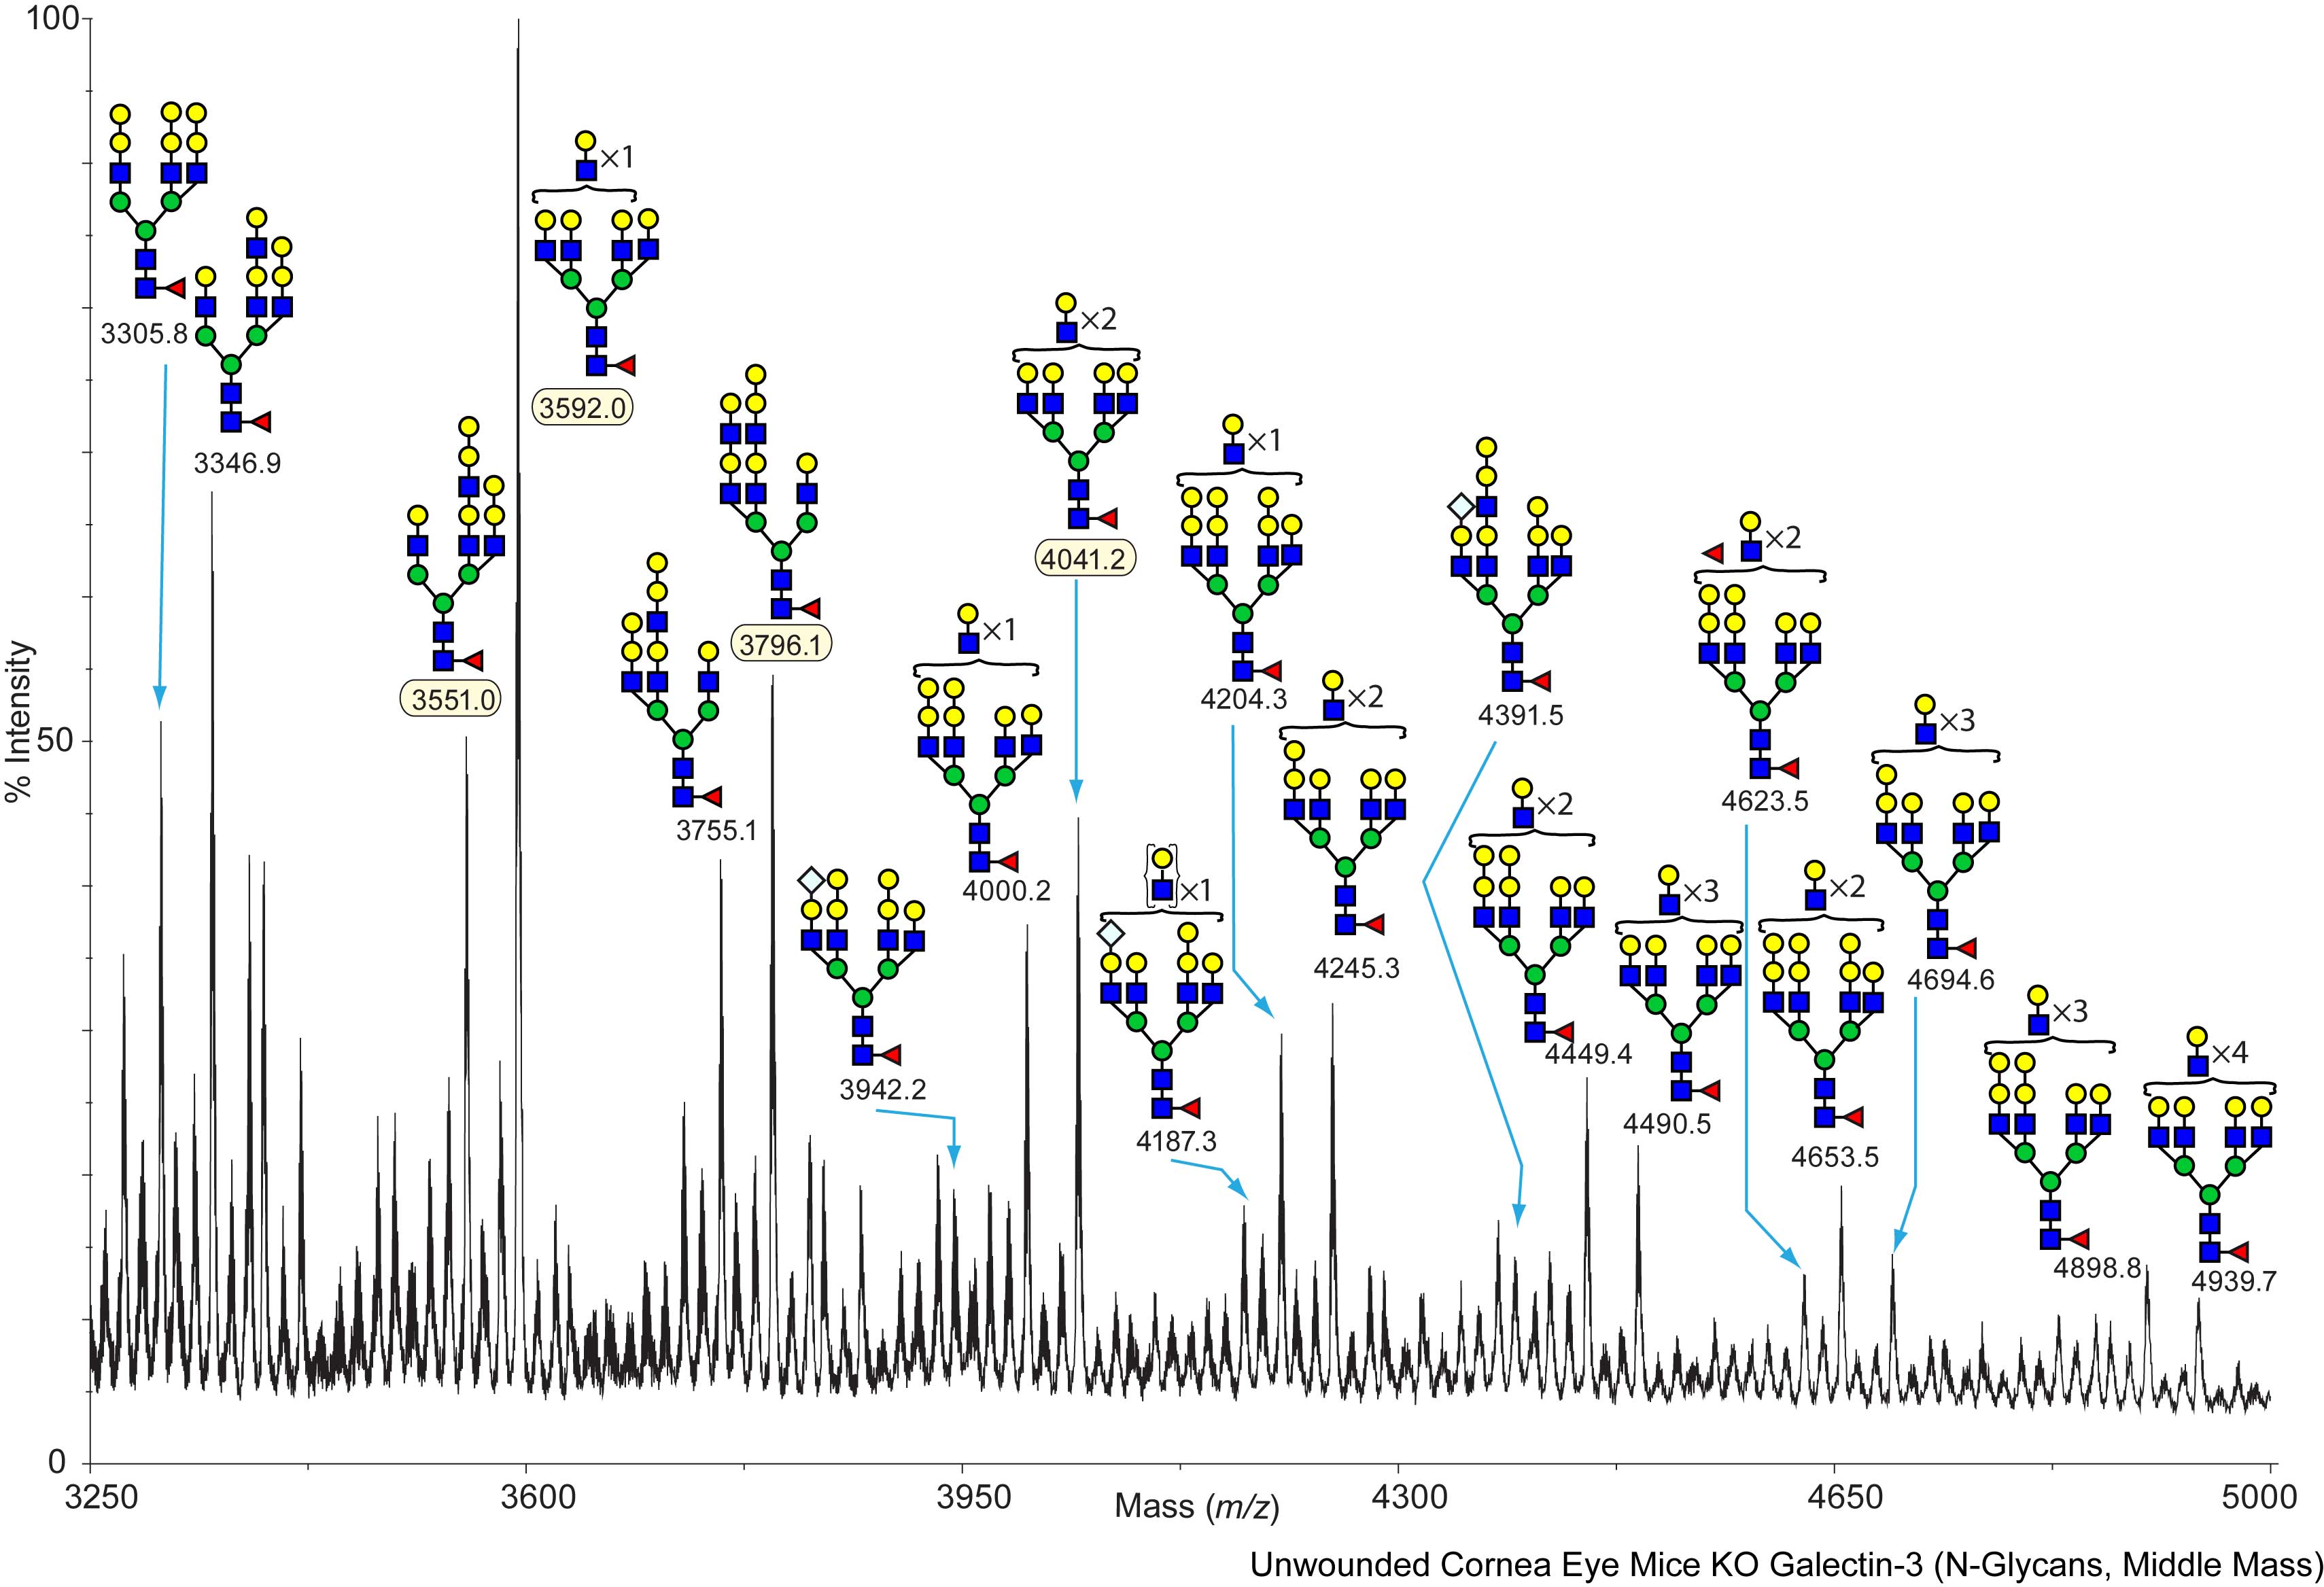
Mouse Galectin-3 KO Cornea Murine corneas, unwounded Galectin-3 KO, NG N-Linked C57BL/6 Panjwani, Noorjahan View experimental details      
Annotated file for lower mass range in JPG formatAnnotated file for higher mass range in JPG format Annotated file for lower mass range in PDF formatAnnotated file for higher mass range in PDF format
View Mass Spectrum data as text View Mass Peak file   Interactive Mass Spectrum Viewer
cfg_rRequest_434
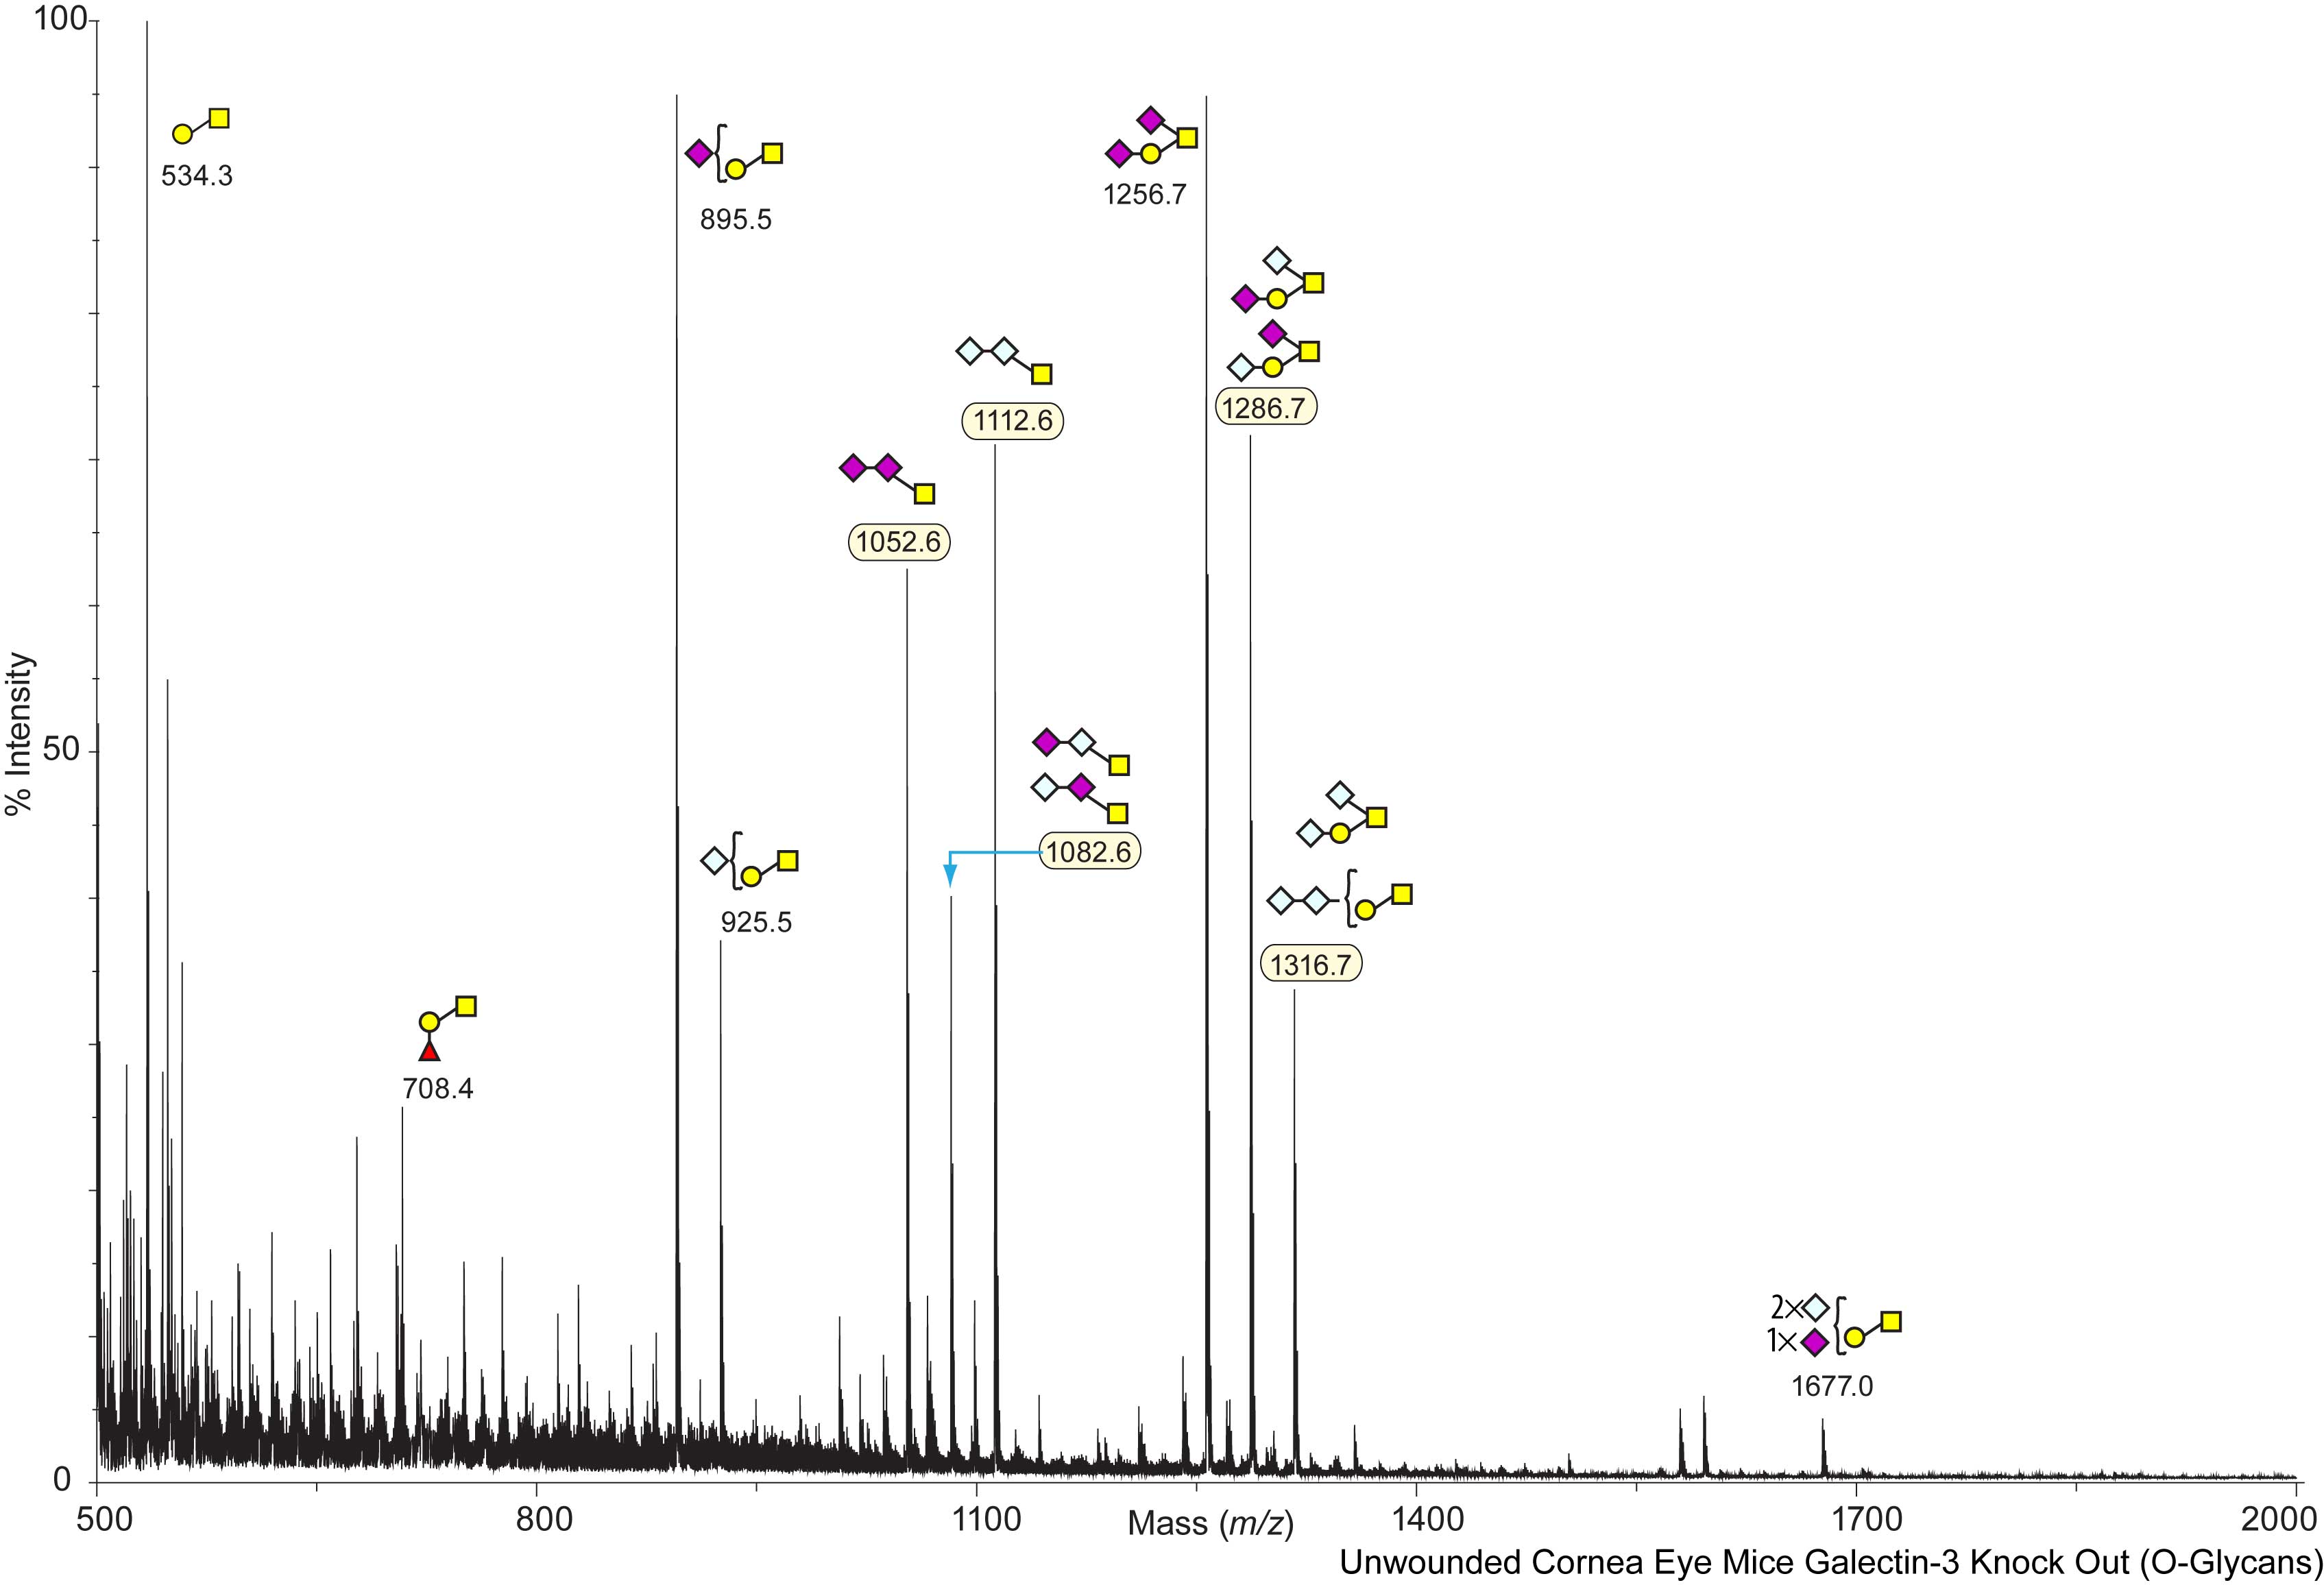
Mouse Galectin-3 KO Cornea Murine corneas, unwounded Galectin-3 KO, OG O-Linked C57BL/6 Panjwani, Noorjahan View experimental details      
Annotated file in JPG format Annotated file in PDF format
View Mass Spectrum data as text View Mass Peak file   Interactive Mass Spectrum Viewer
cfg_rRequest_434
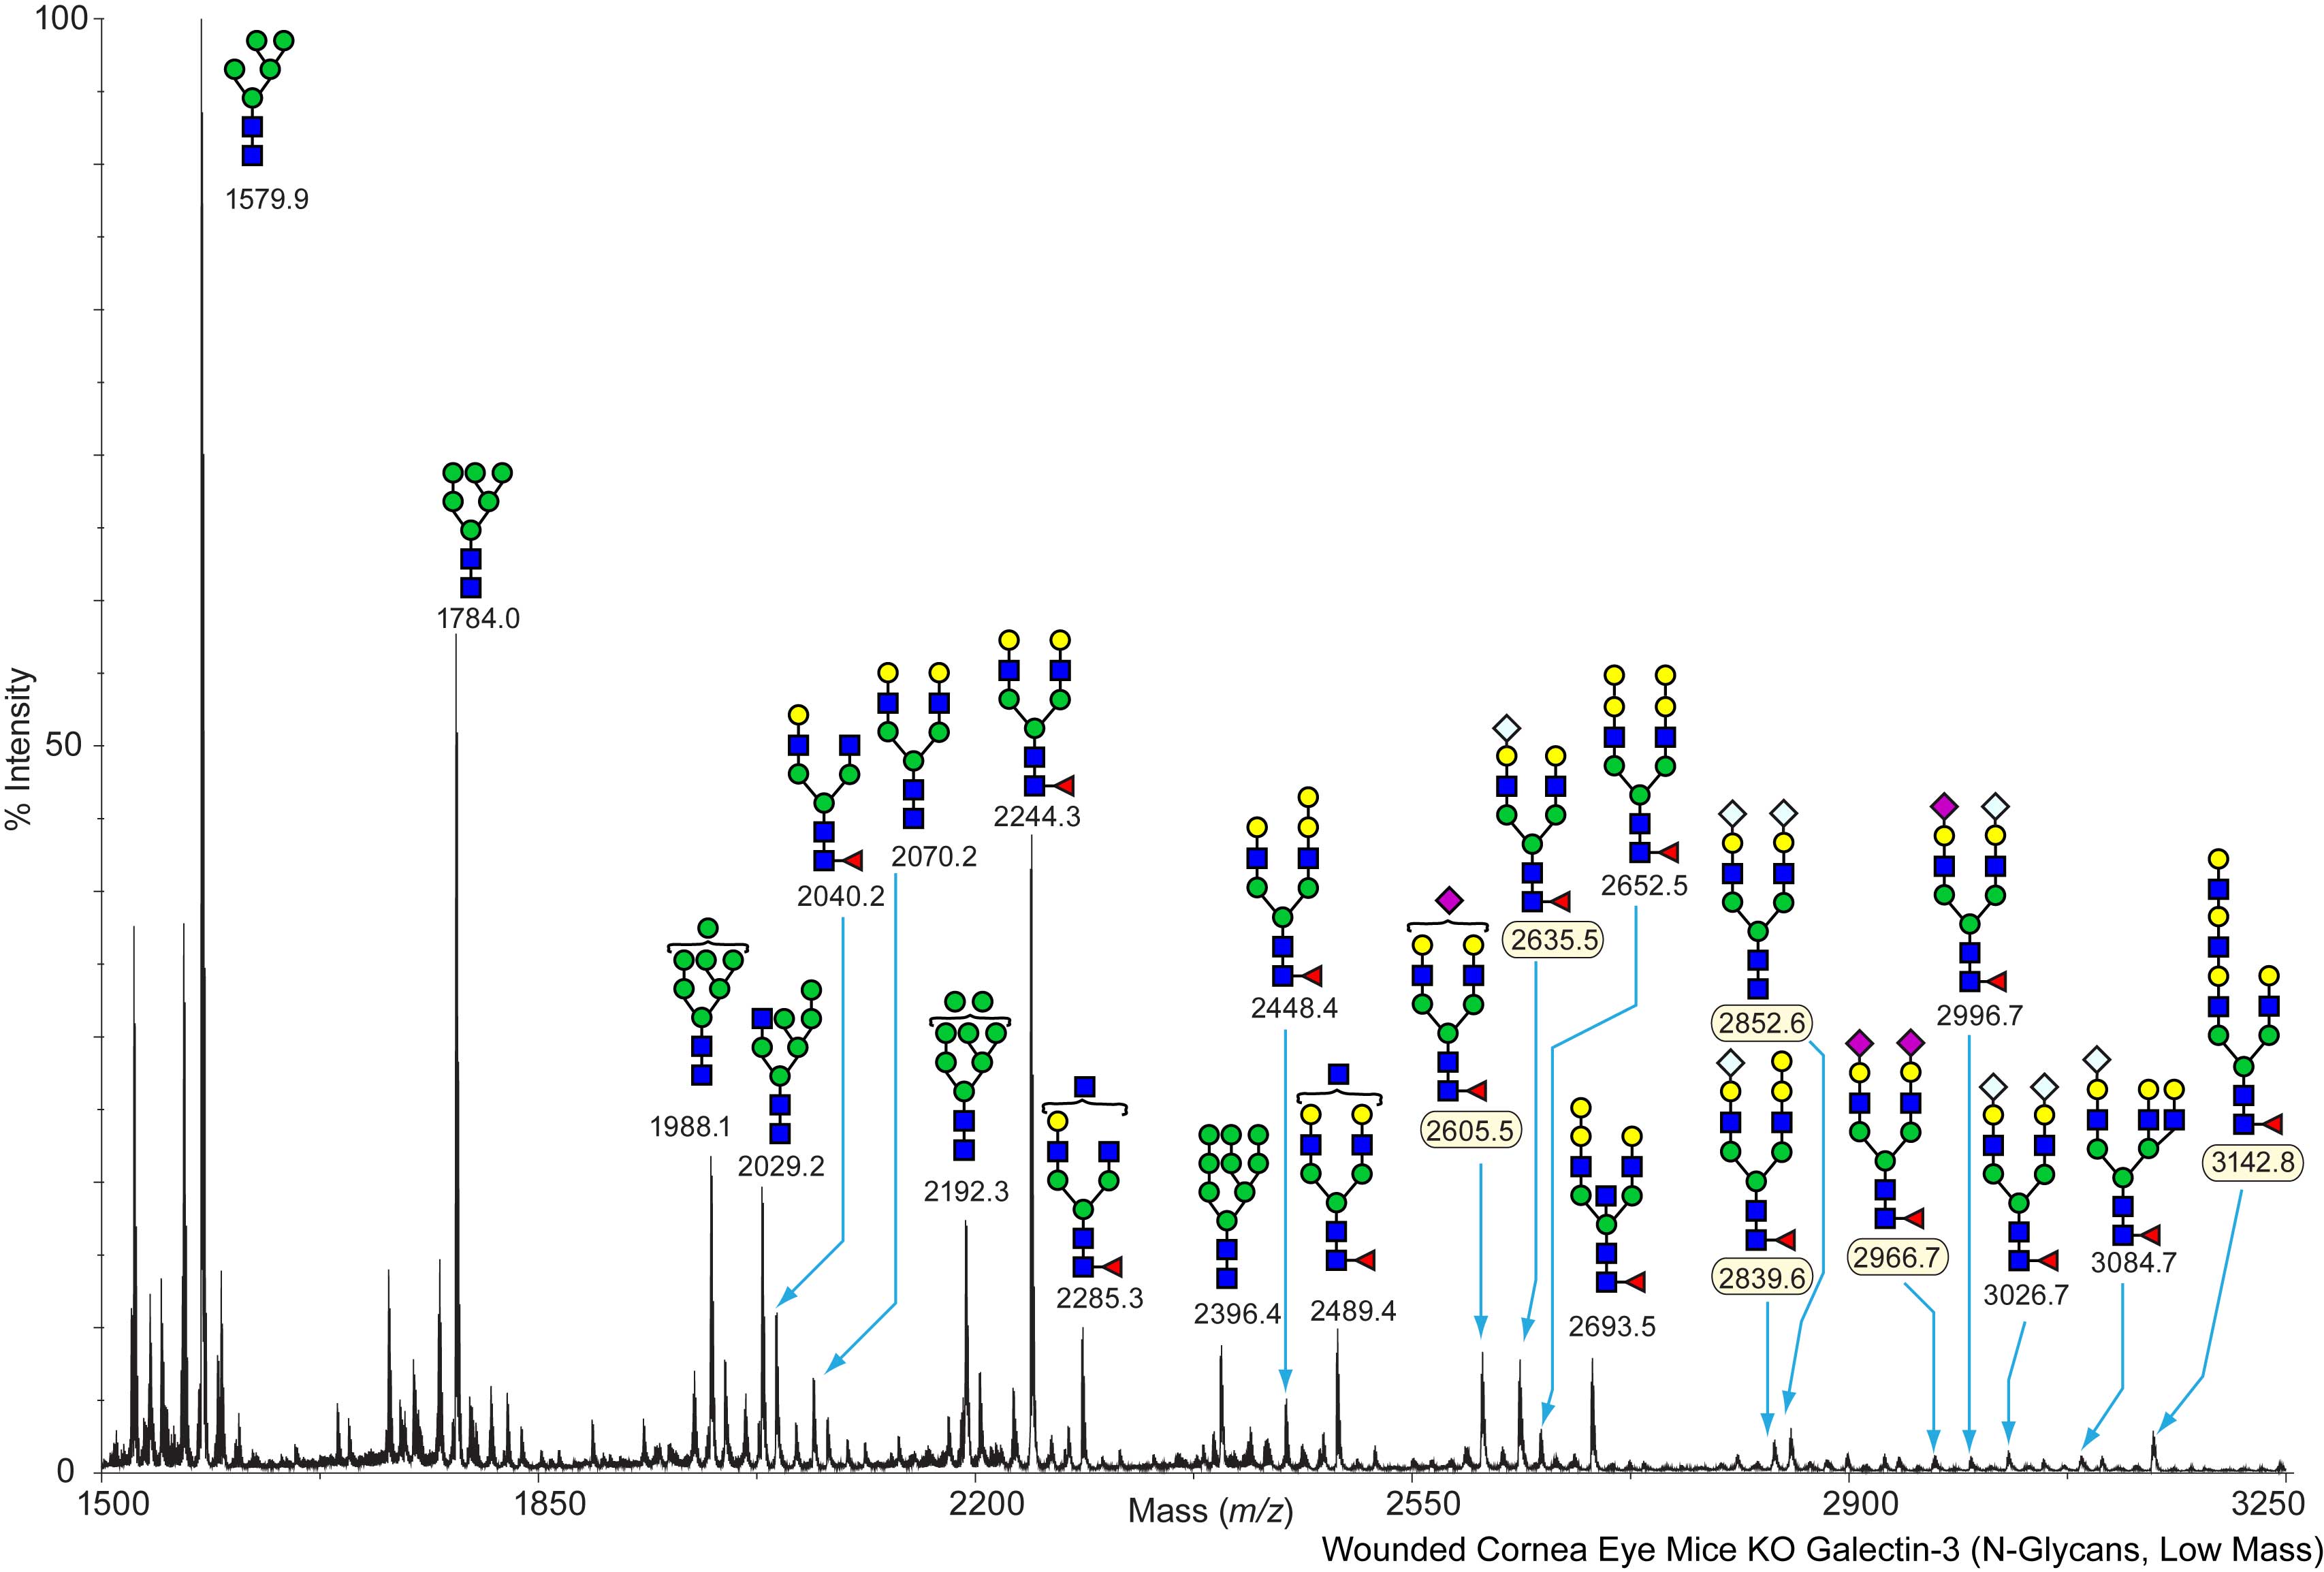
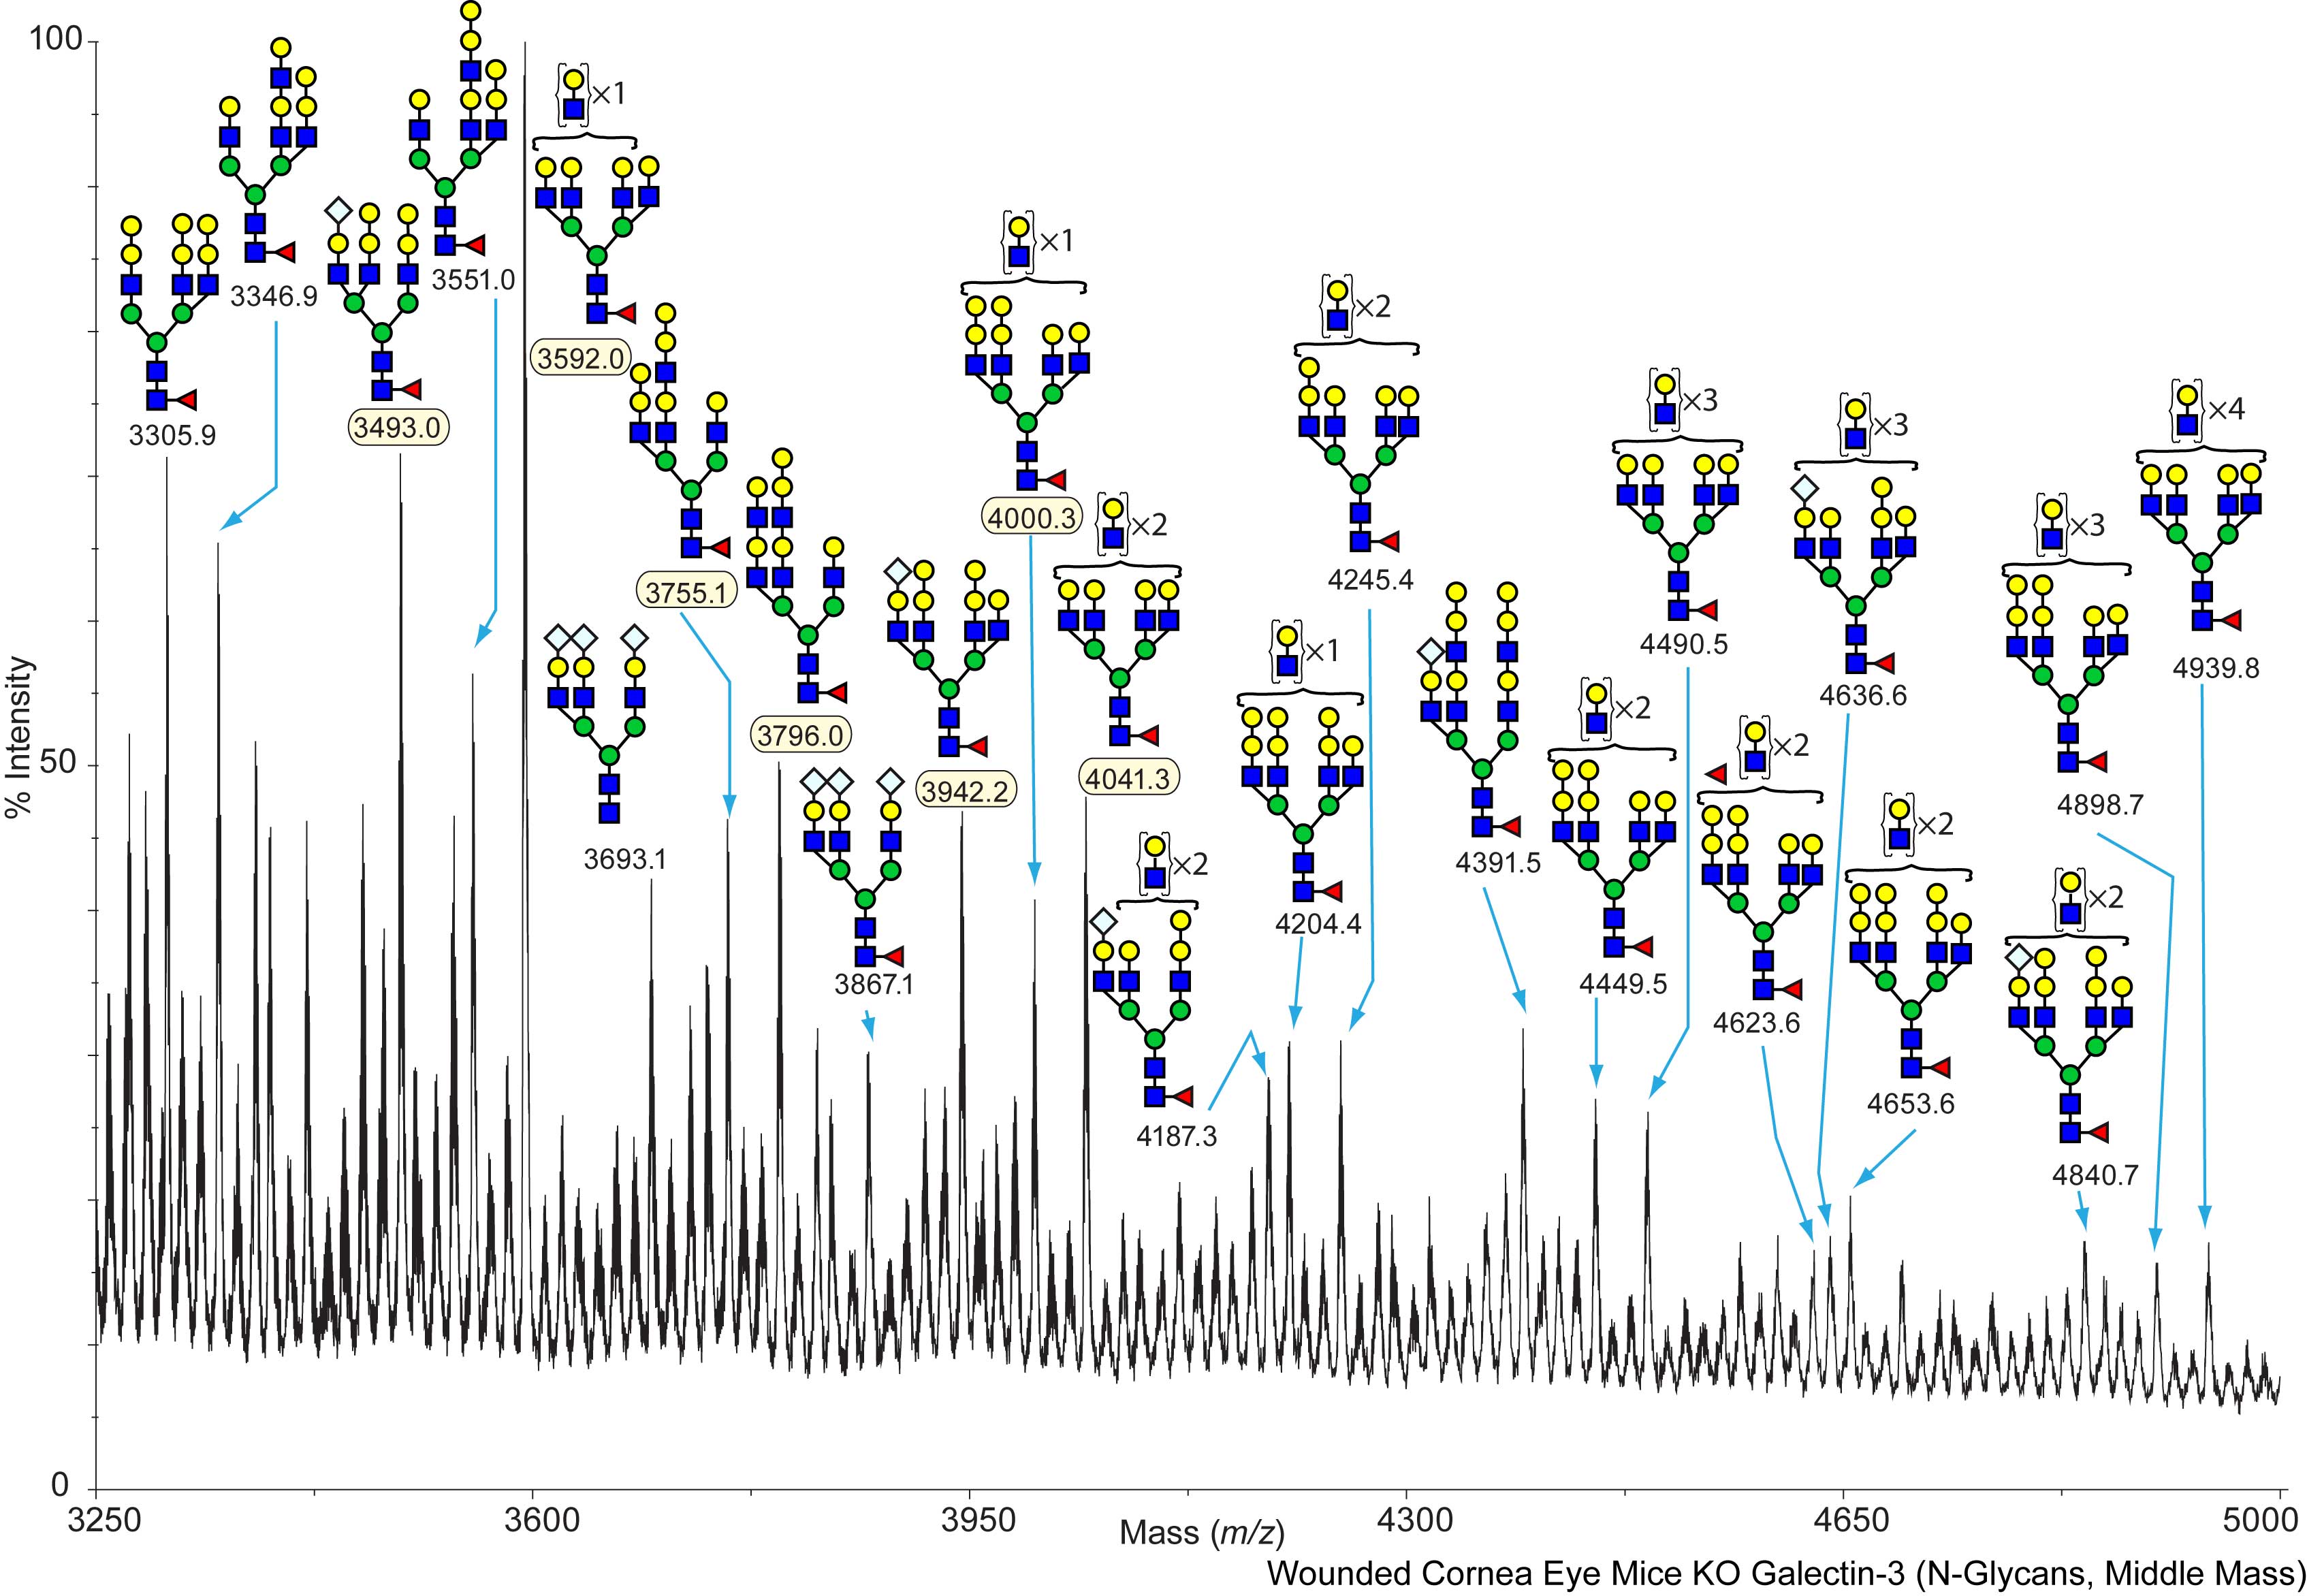
Mouse Galectin-3 KO Cornea Murine corneas, wounded Galectin-3 KO, NG N-Linked C57BL/6 Panjwani, Noorjahan View experimental details      
Annotated file for lower mass range in JPG formatAnnotated file for higher mass range in JPG format Annotated file for lower mass range in PDF formatAnnotated file for higher mass range in PDF format
View Mass Spectrum data as text View Mass Peak file   Interactive Mass Spectrum Viewer
cfg_rRequest_434
Mouse Galectin-3 KO Cornea Murine corneas, wounded Galectin-3 KO, OG O-Linked C57BL/6 Panjwani, Noorjahan View experimental details      
Annotated file in JPG format Annotated file in PDF format
View Mass Spectrum data as text View Mass Peak file   Interactive Mass Spectrum Viewer
cfg_rRequest_434
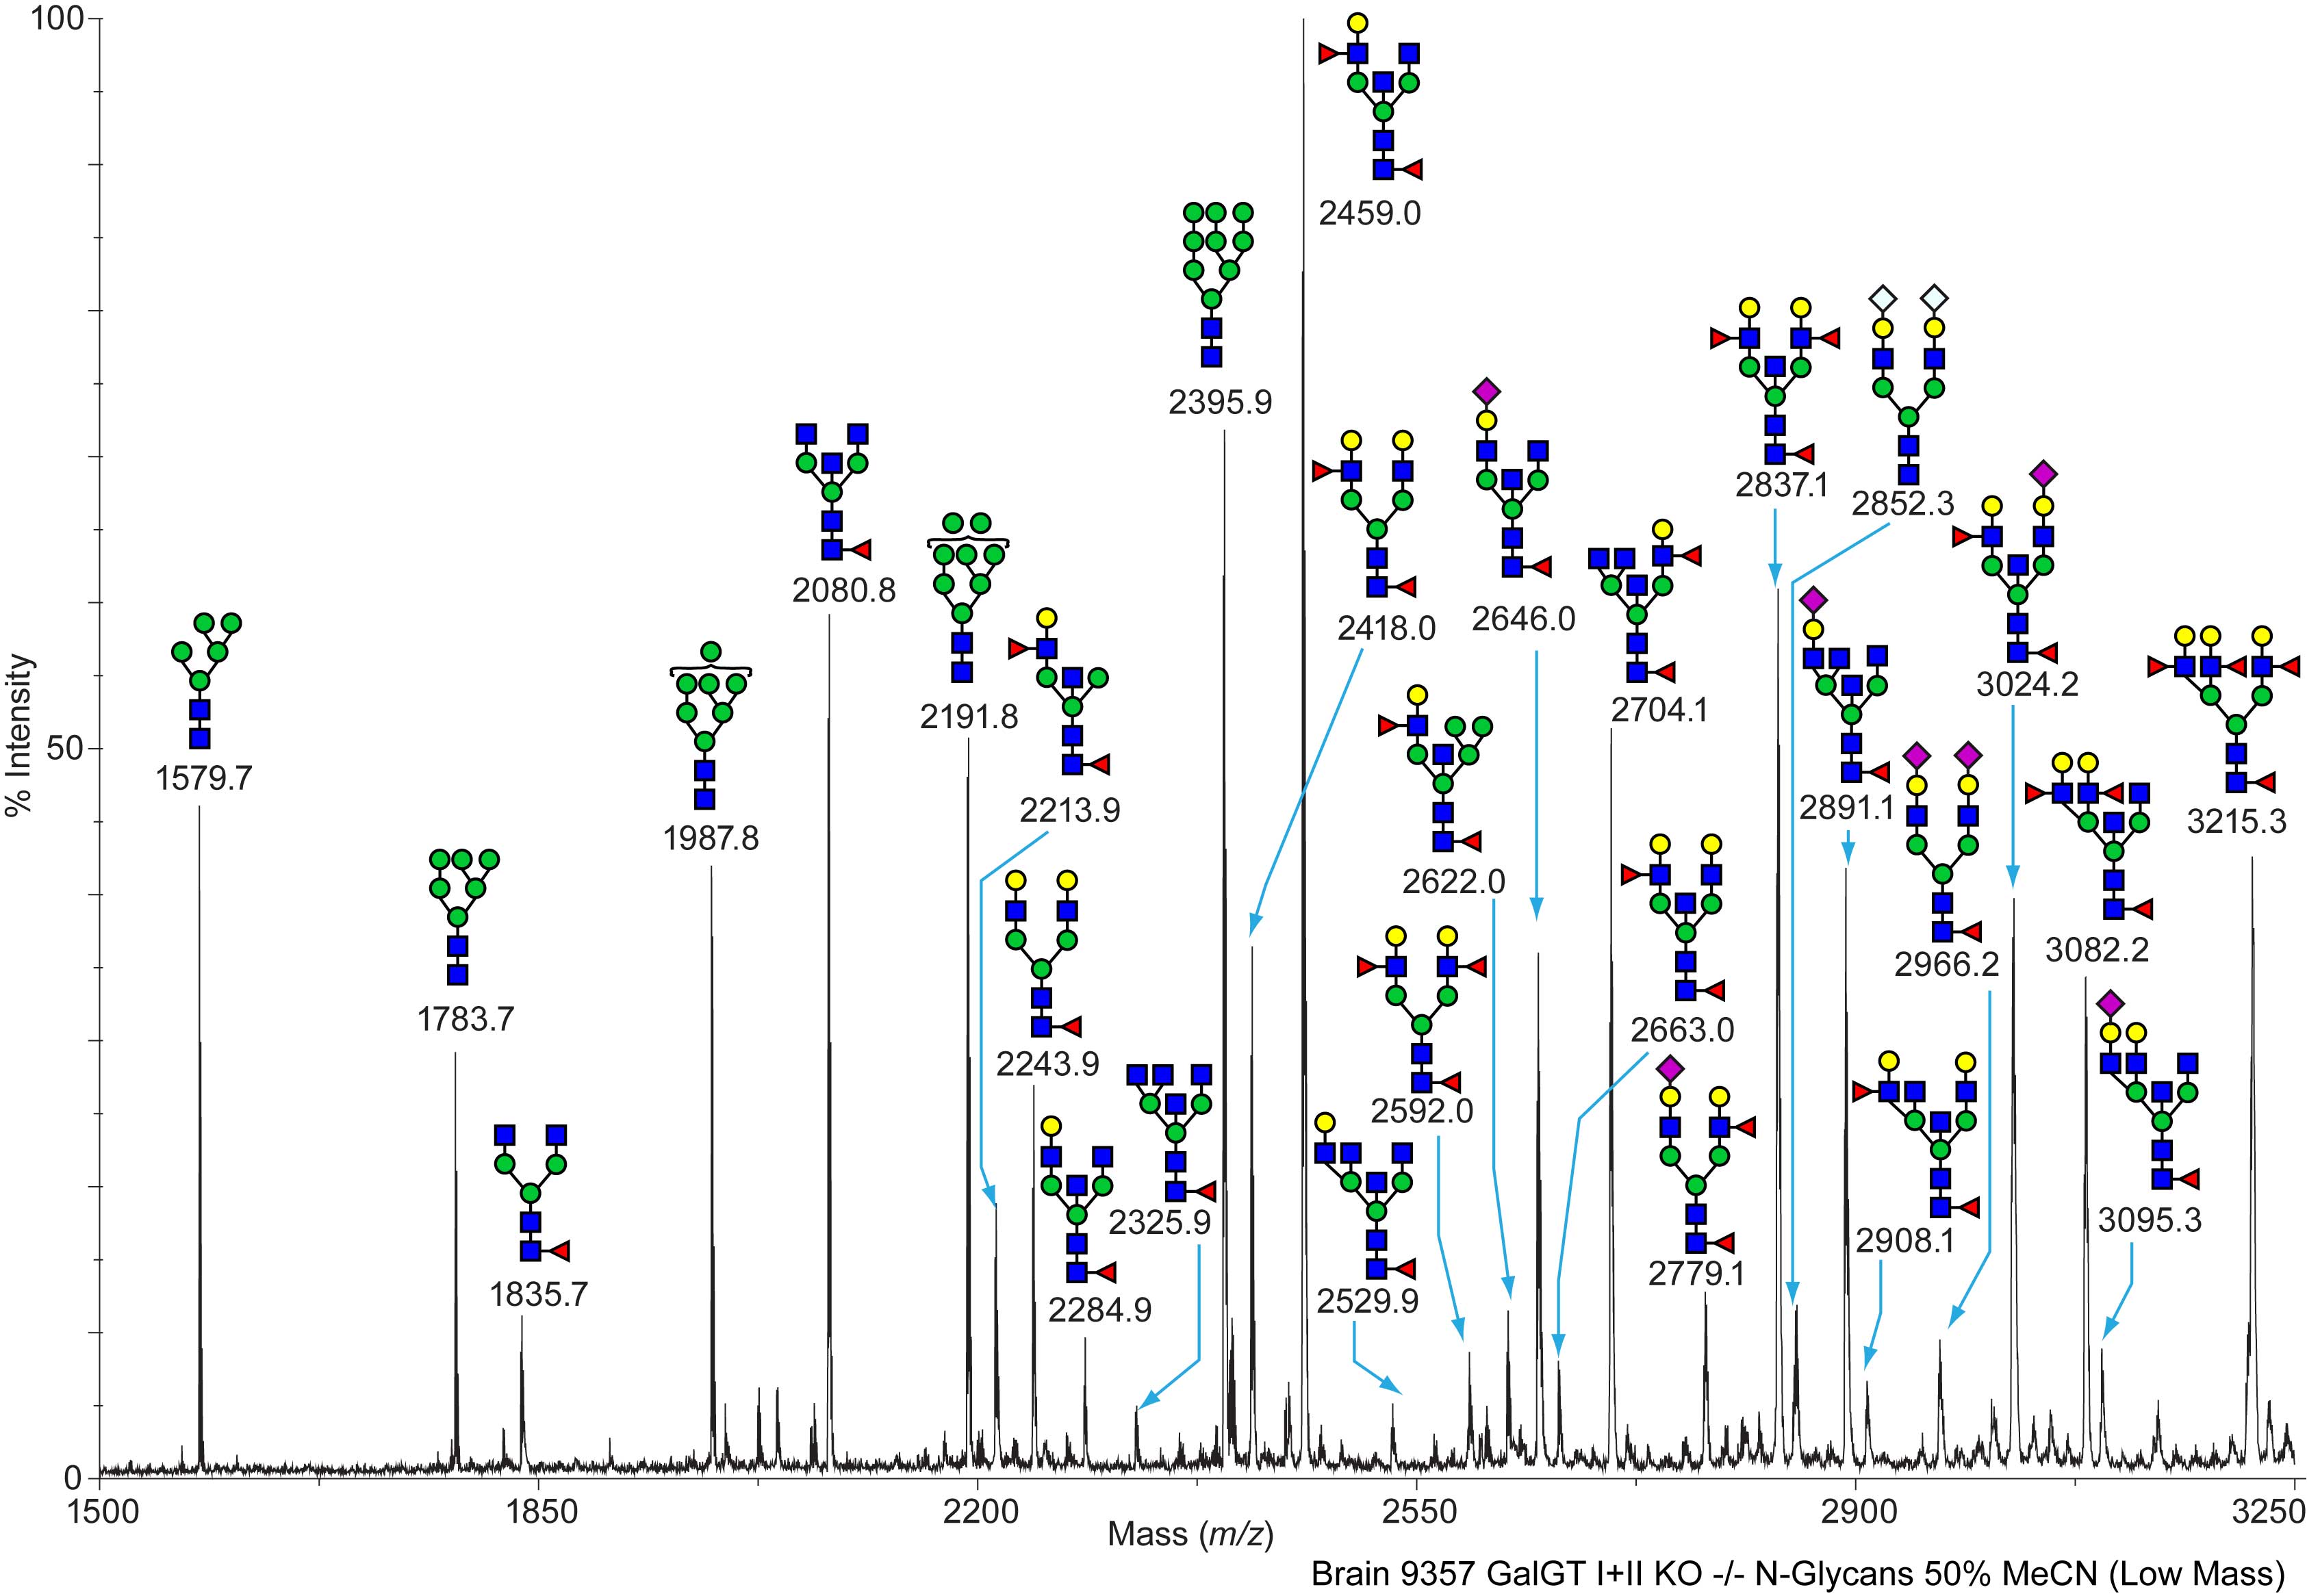
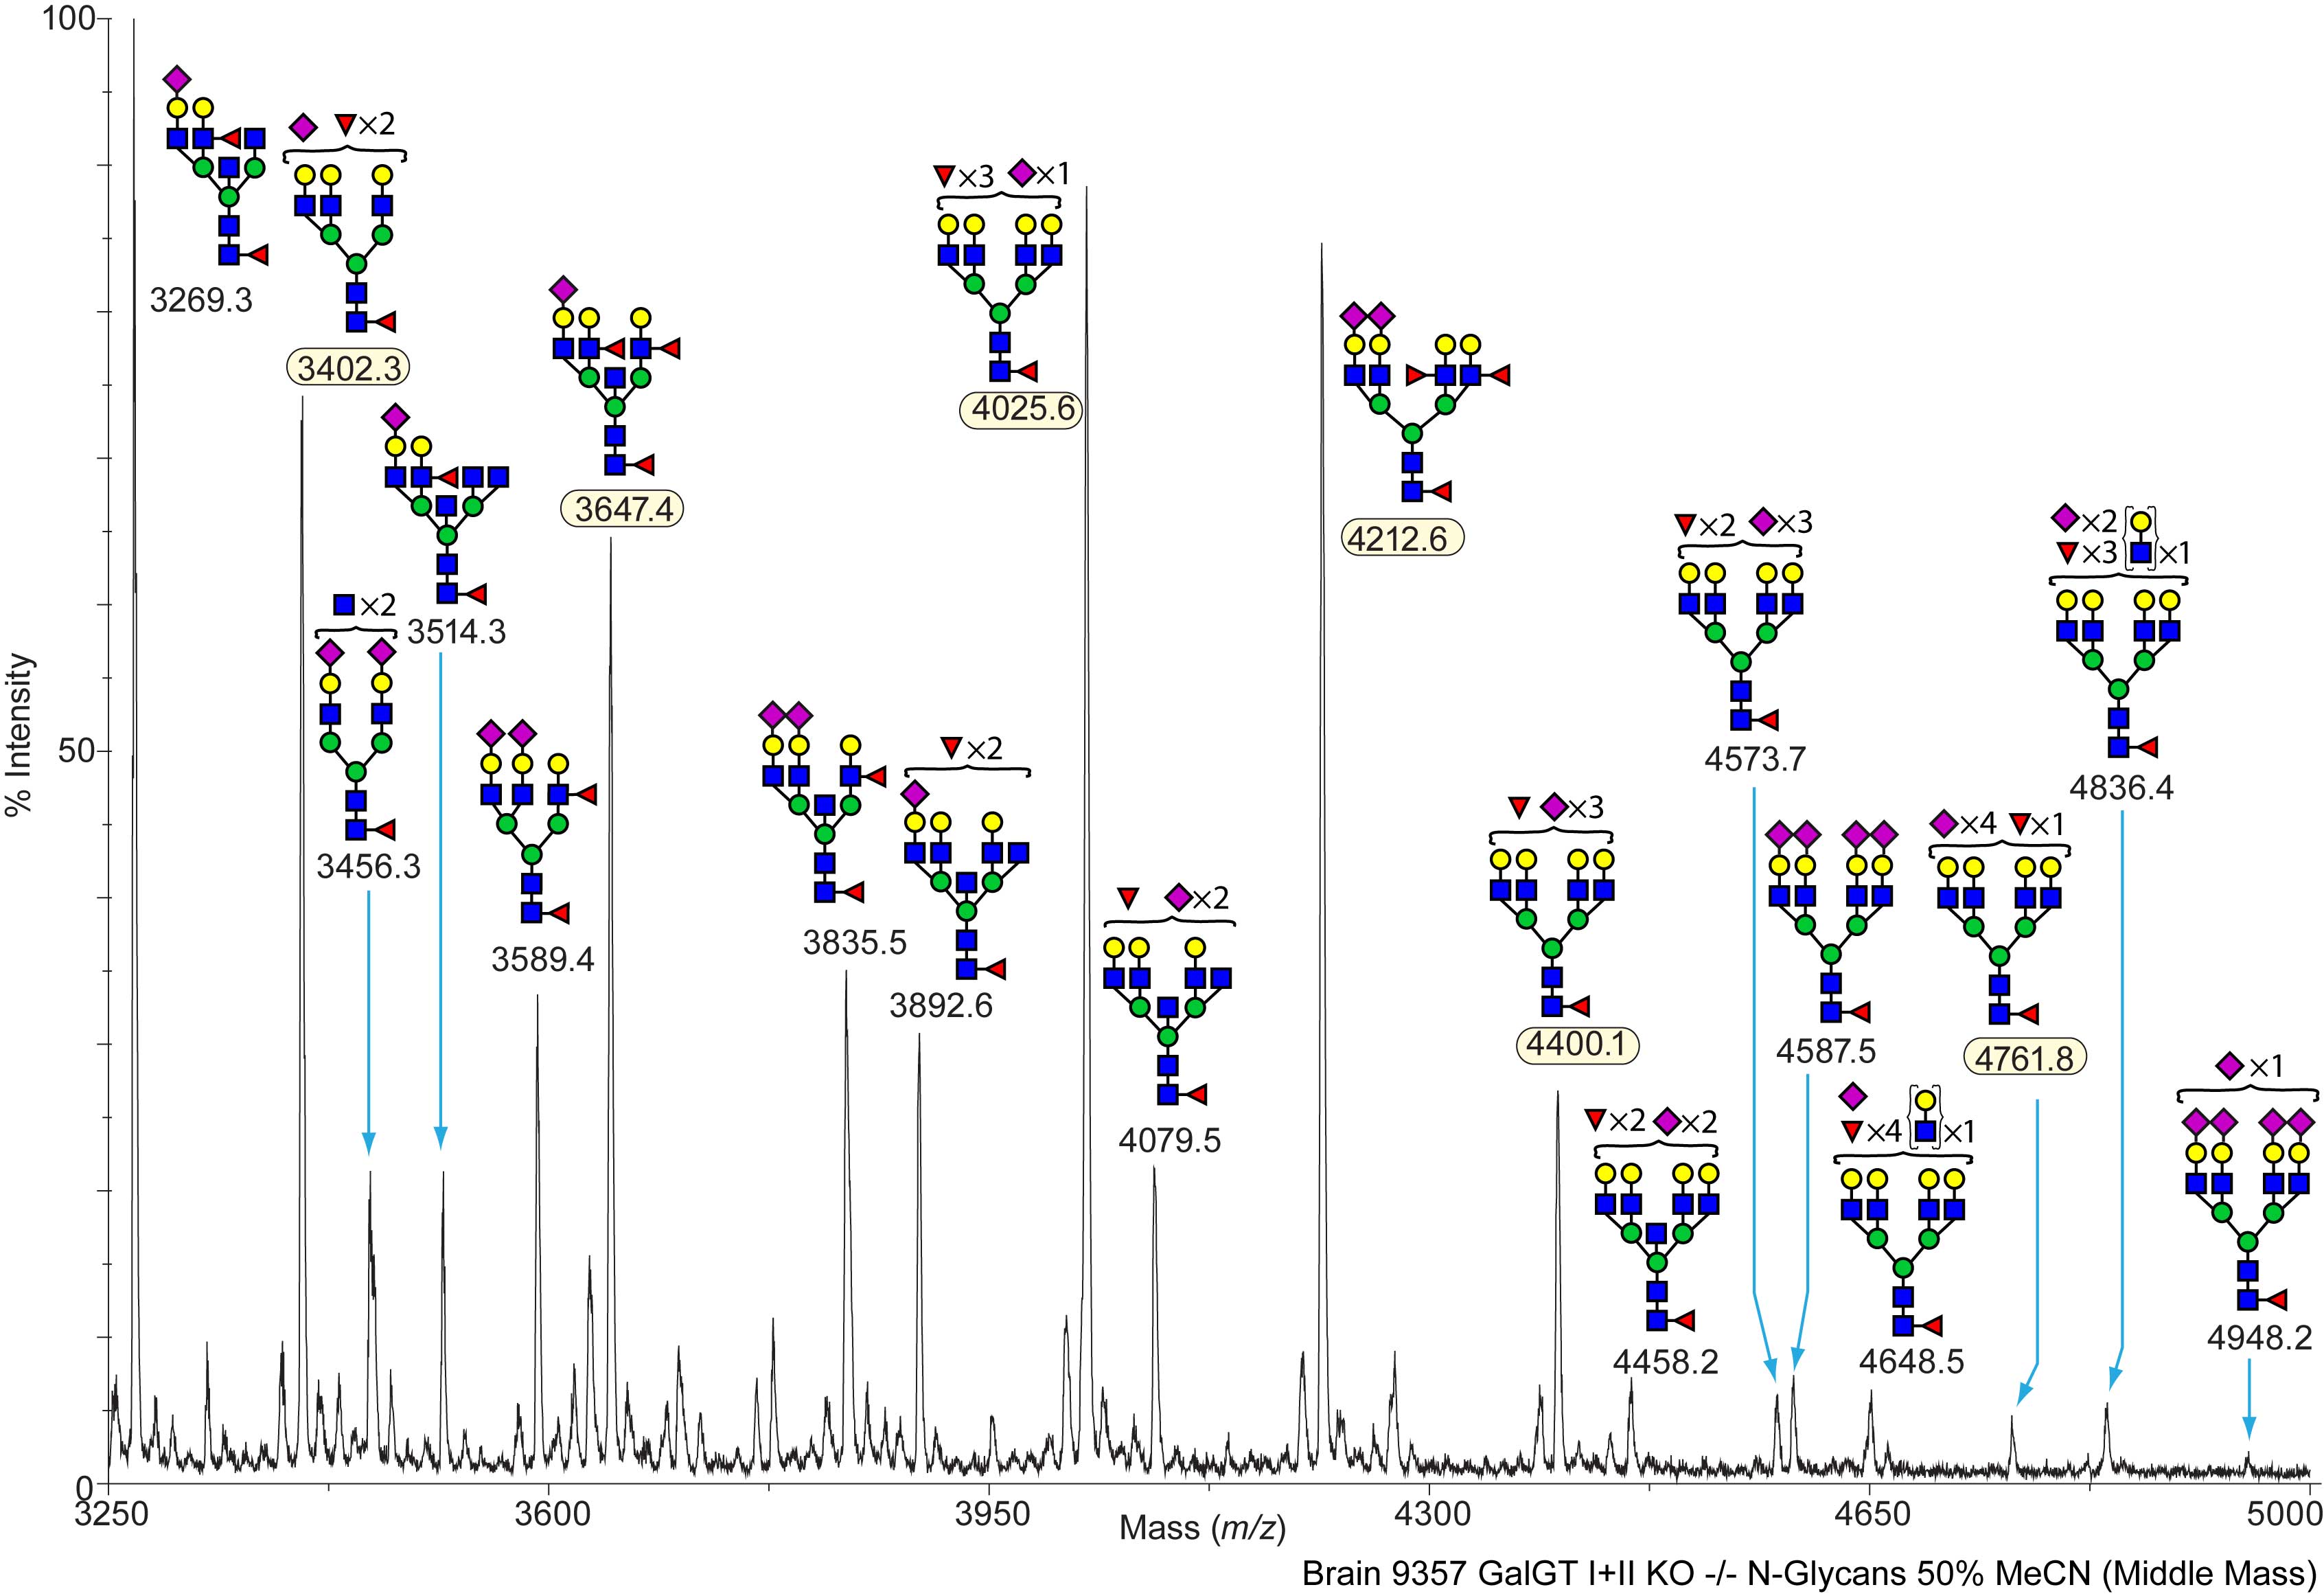
Mouse Wild Type Brain Brain B4galnt1(-/-)/B4galnt2(-/-) DKO Colony Code (GD) Mouse 9357 NG N-Linked C57BL/6 View experimental details      
Annotated file for lower mass range in JPG formatAnnotated file for higher mass range in JPG format Annotated file for lower mass range in PDF formatAnnotated file for higher mass range in PDF format
View Mass Spectrum data as text View Mass Peak file   Interactive Mass Spectrum Viewer
cfg_rRequest_2118
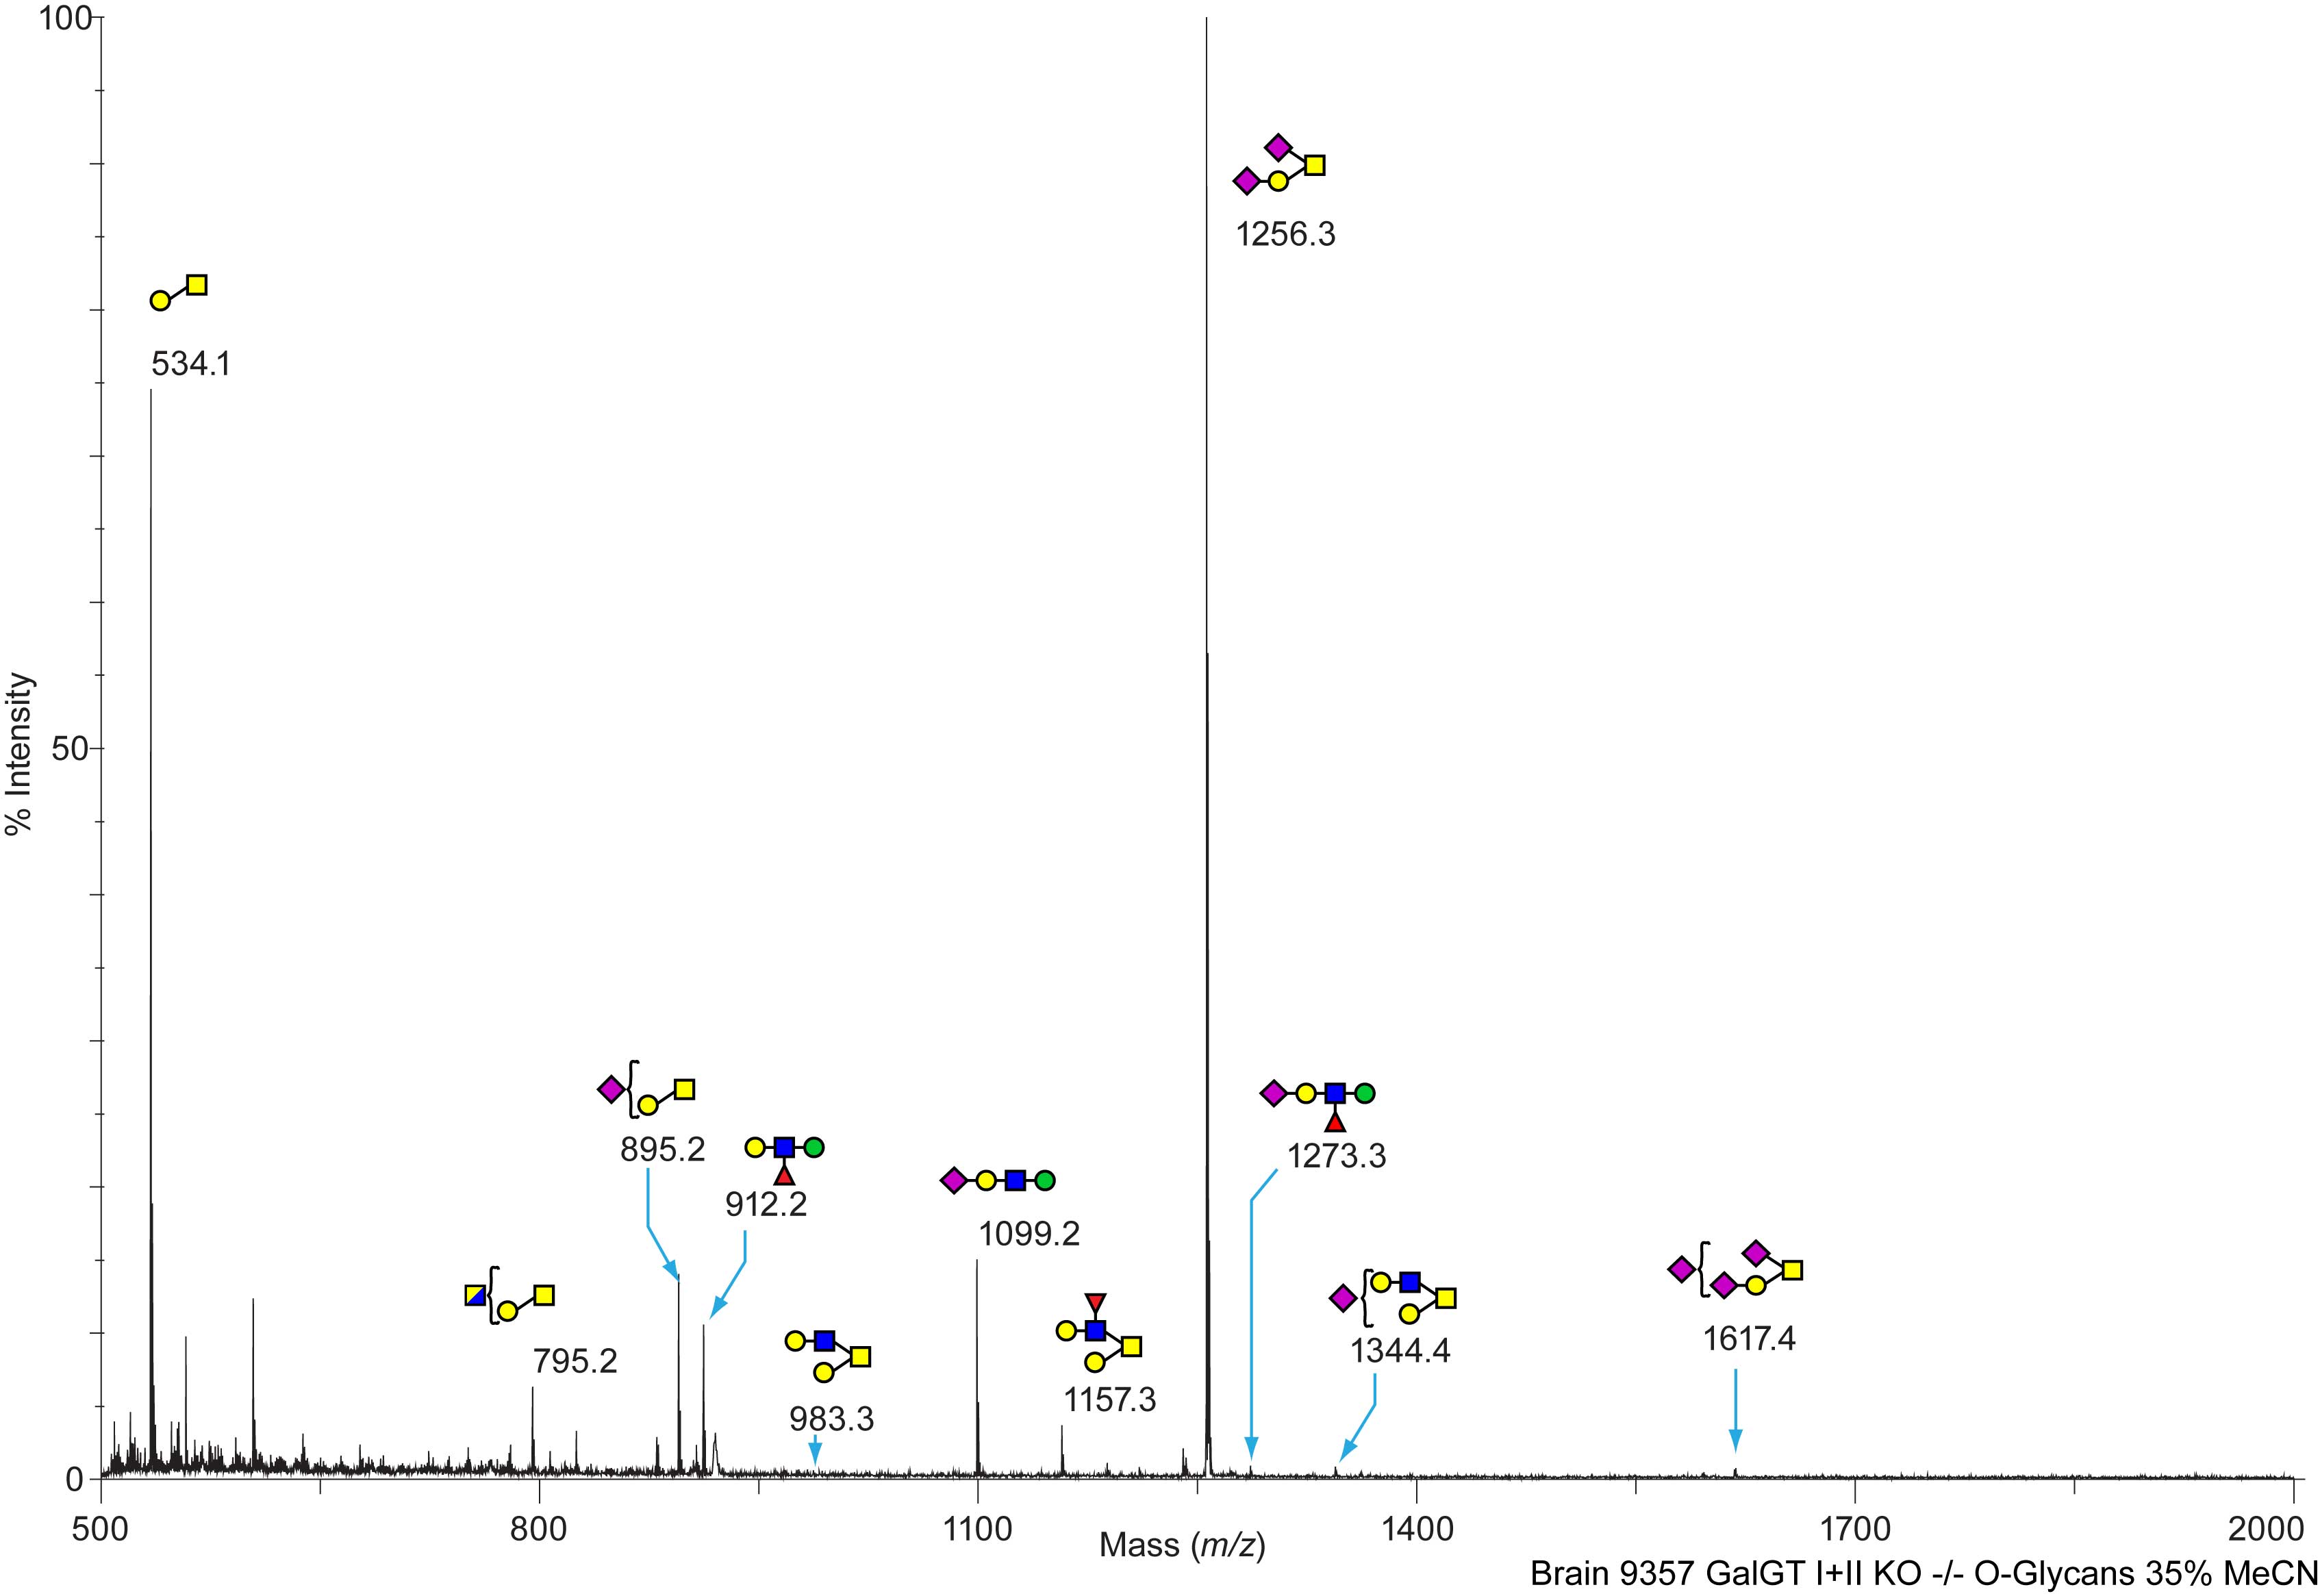
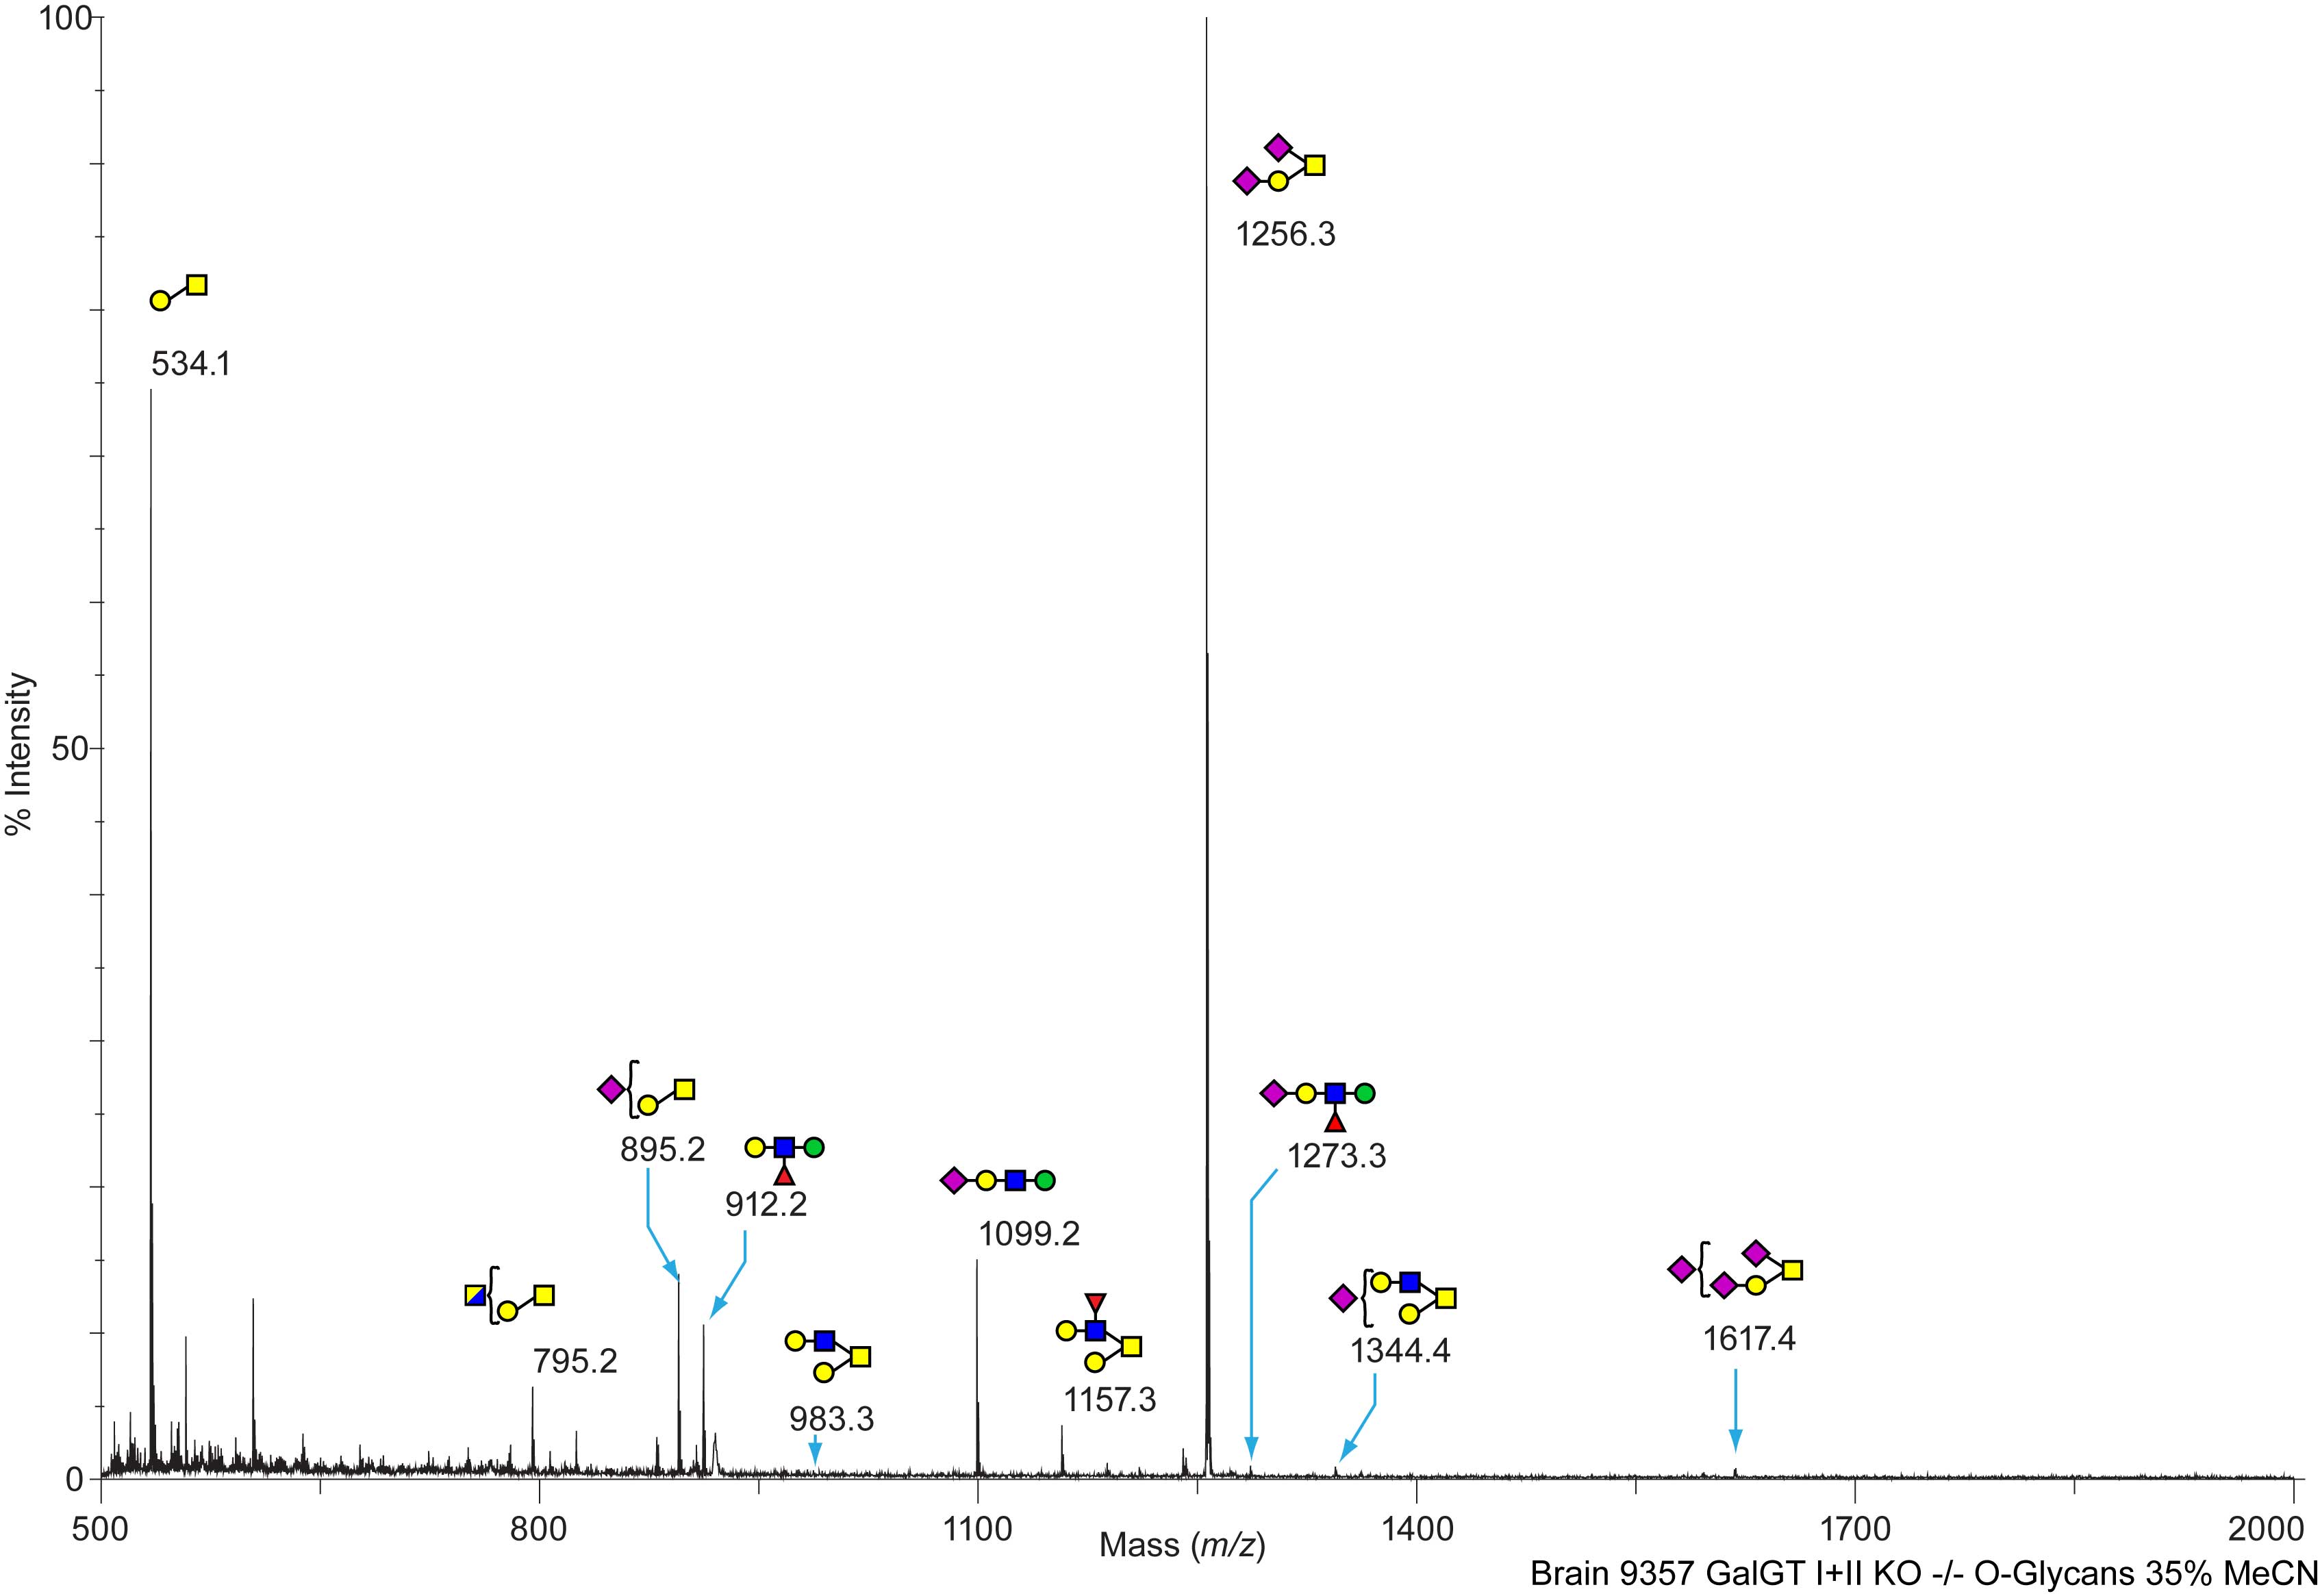
Mouse Wild Type Brain Brain B4galnt1(-/-)/B4galnt2(-/-) DKO Colony Code (GD) Mouse 9357 OG O-Linked C57BL/6 View experimental details      
Annotated file in JPG format Annotated file in PDF format
View Mass Spectrum data as text      
cfg_rRequest_2118
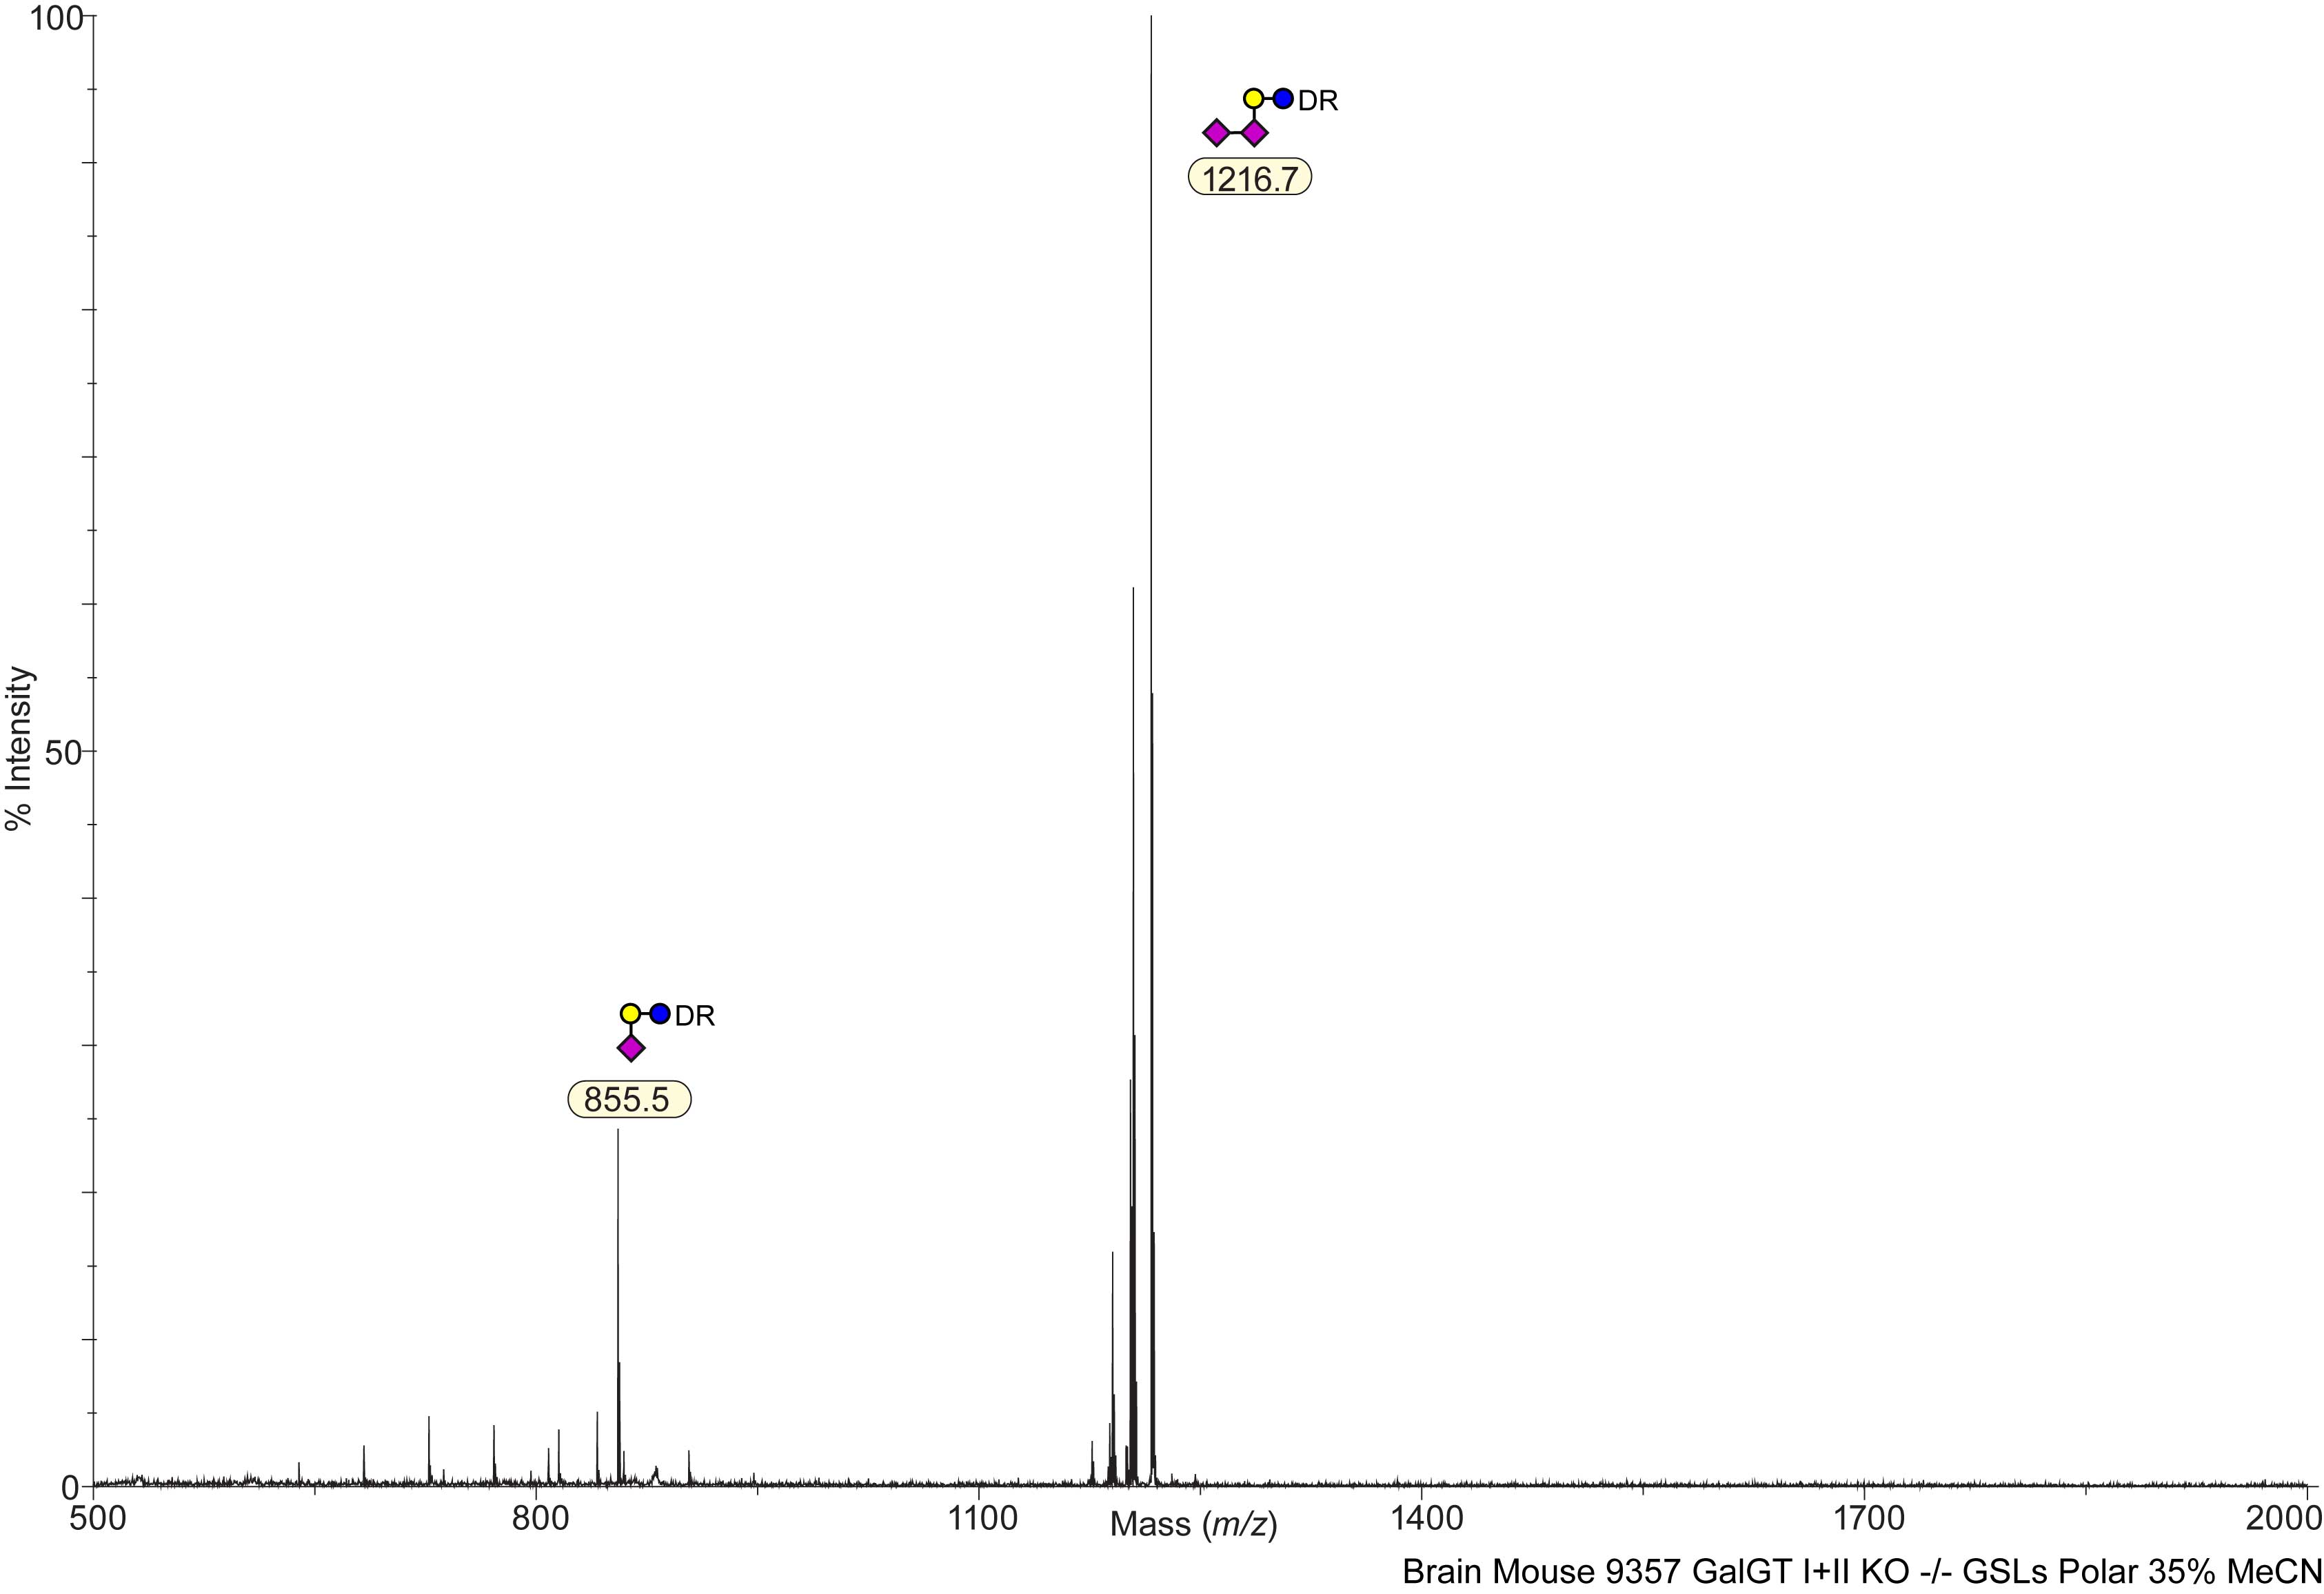
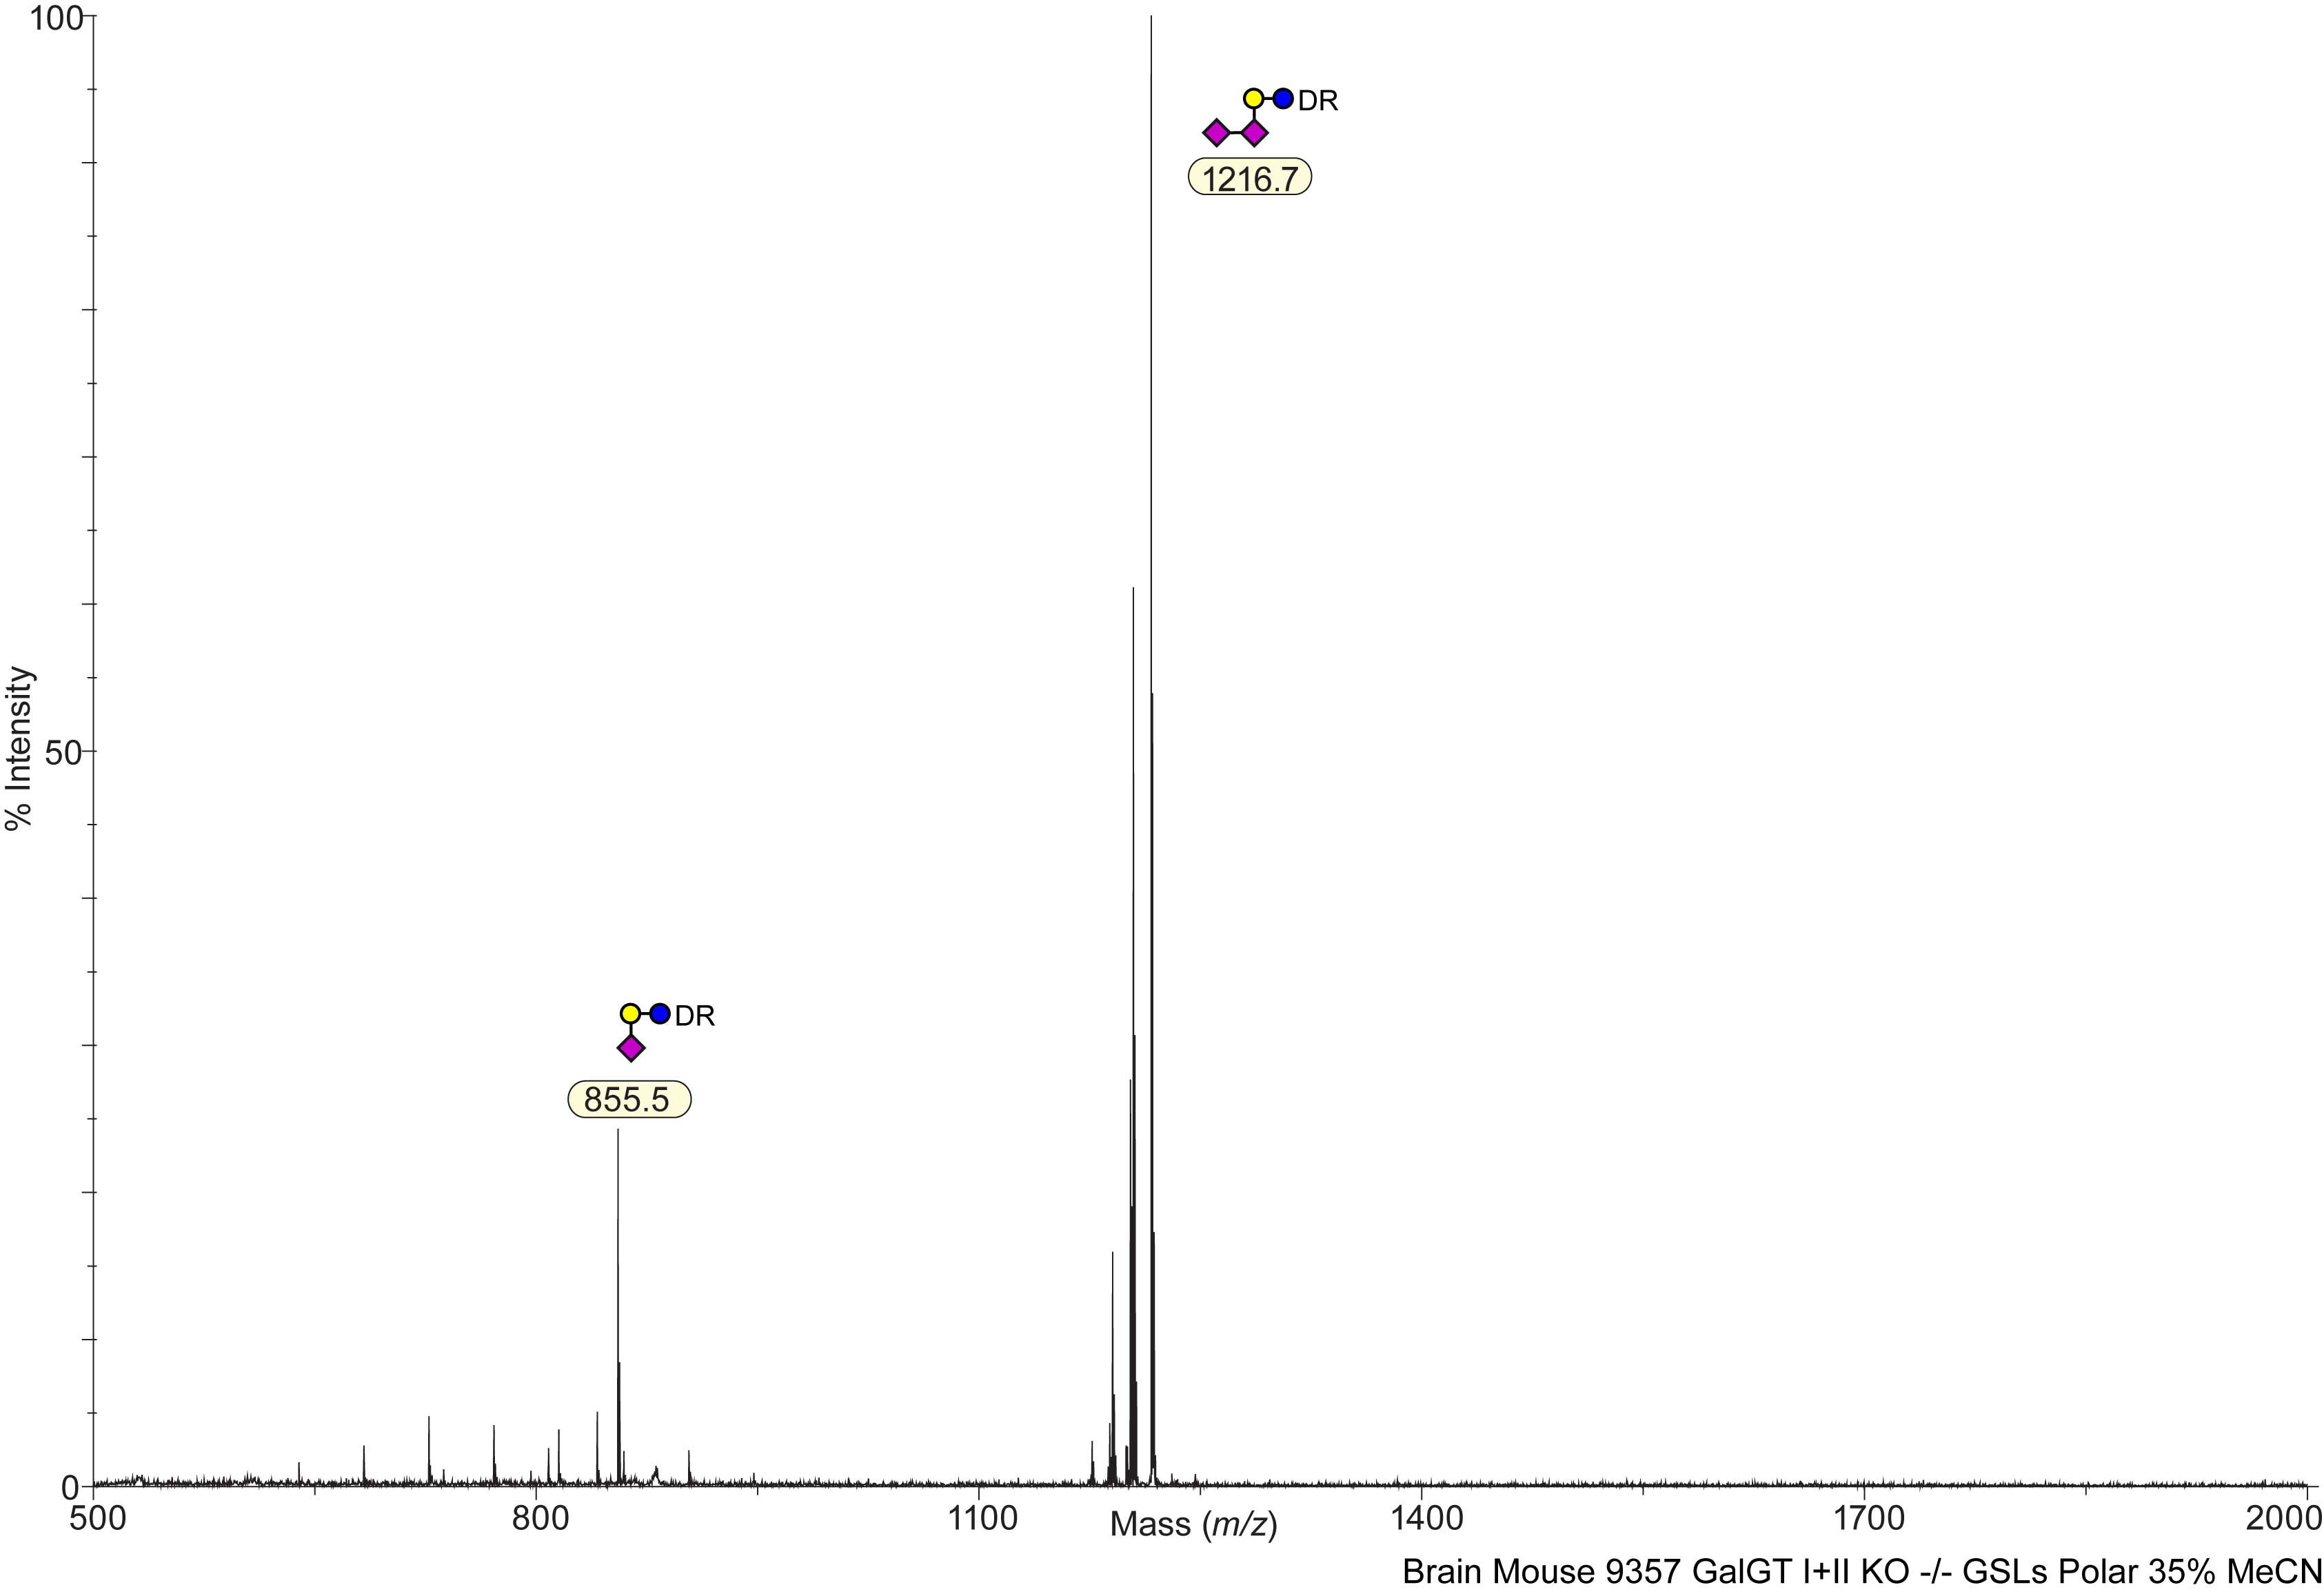
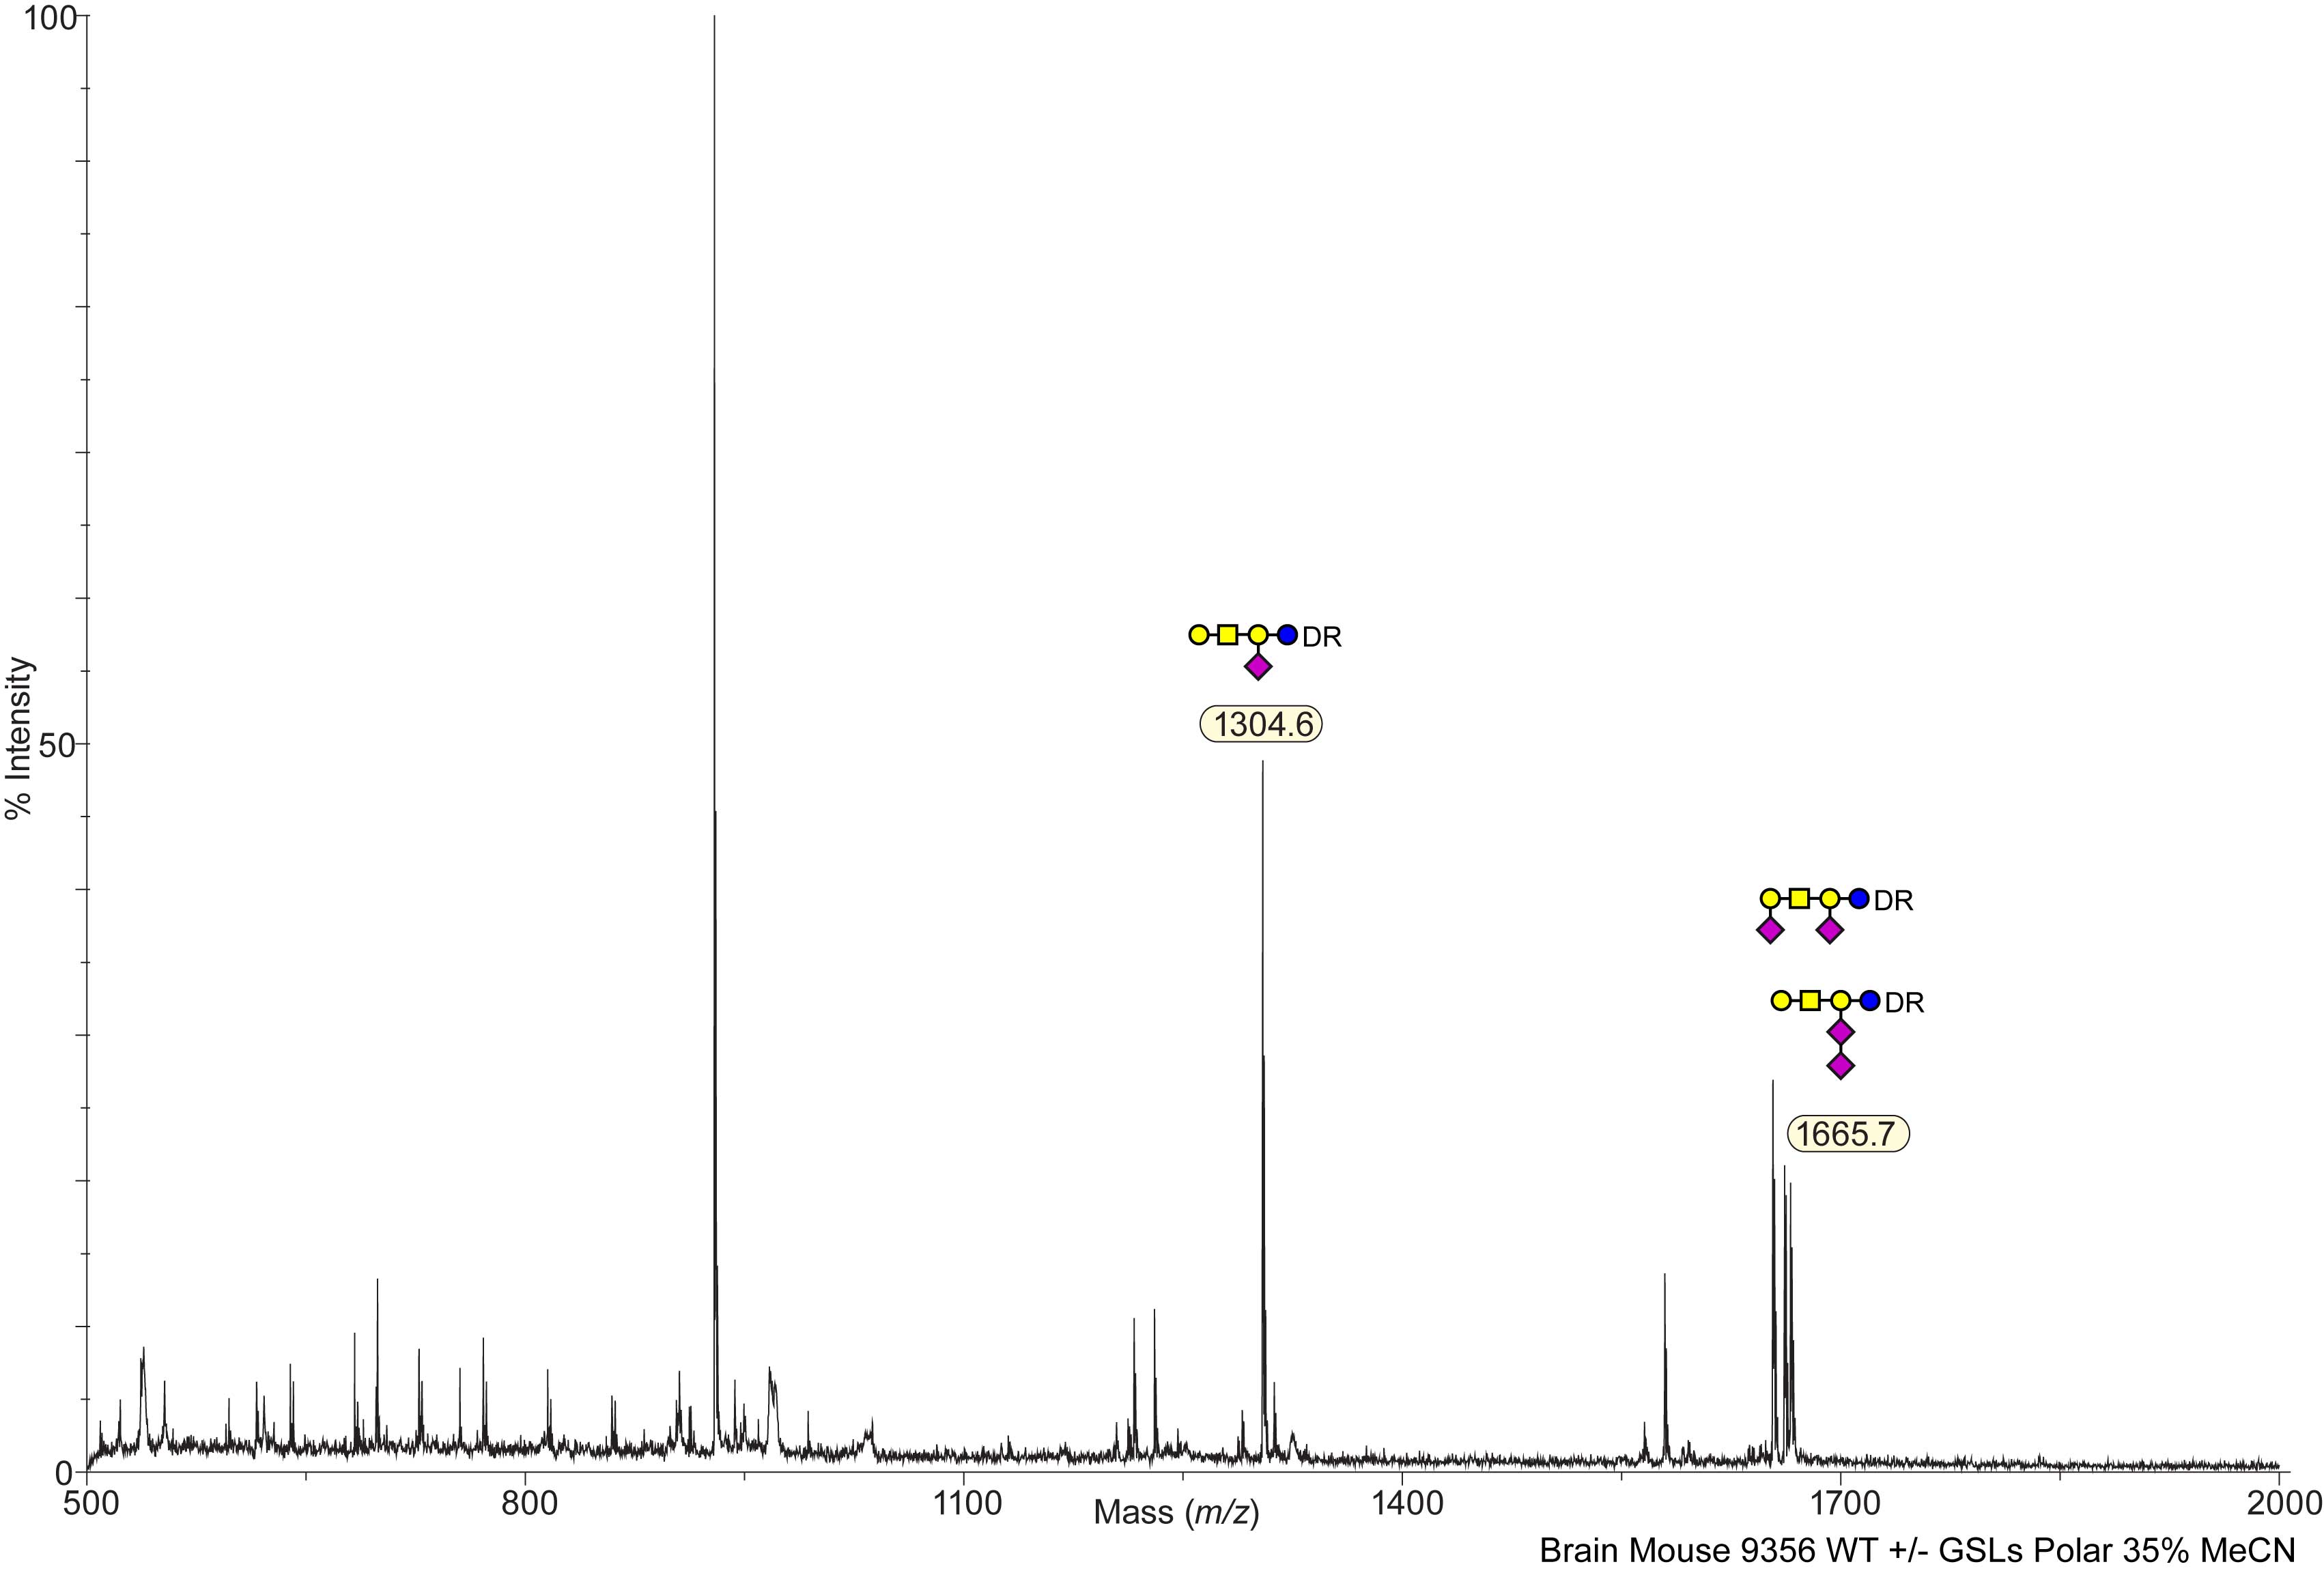
Mouse Wild Type Brain Brain B4galnt1(-/-)/B4galnt2(-/-) DKO Colony Code (GD) Mouse 9357 PGL Polar Glycolipids C57BL/6 View experimental details      
Annotated file in JPG format Annotated file in PDF format
View Mass Spectrum data as text View Mass Peak file   Interactive Mass Spectrum Viewer
cfg_rRequest_2118
Mouse Wild Type Brain Brain B4galnt1(-/-)/B4galnt2(-/-) DKO Colony Code(GD) Mouse 9357 NPGL Non-Polar Glycolipids C57BL/6 View experimental details      
   
View Mass Spectrum data as text      
cfg_rRequest_2118
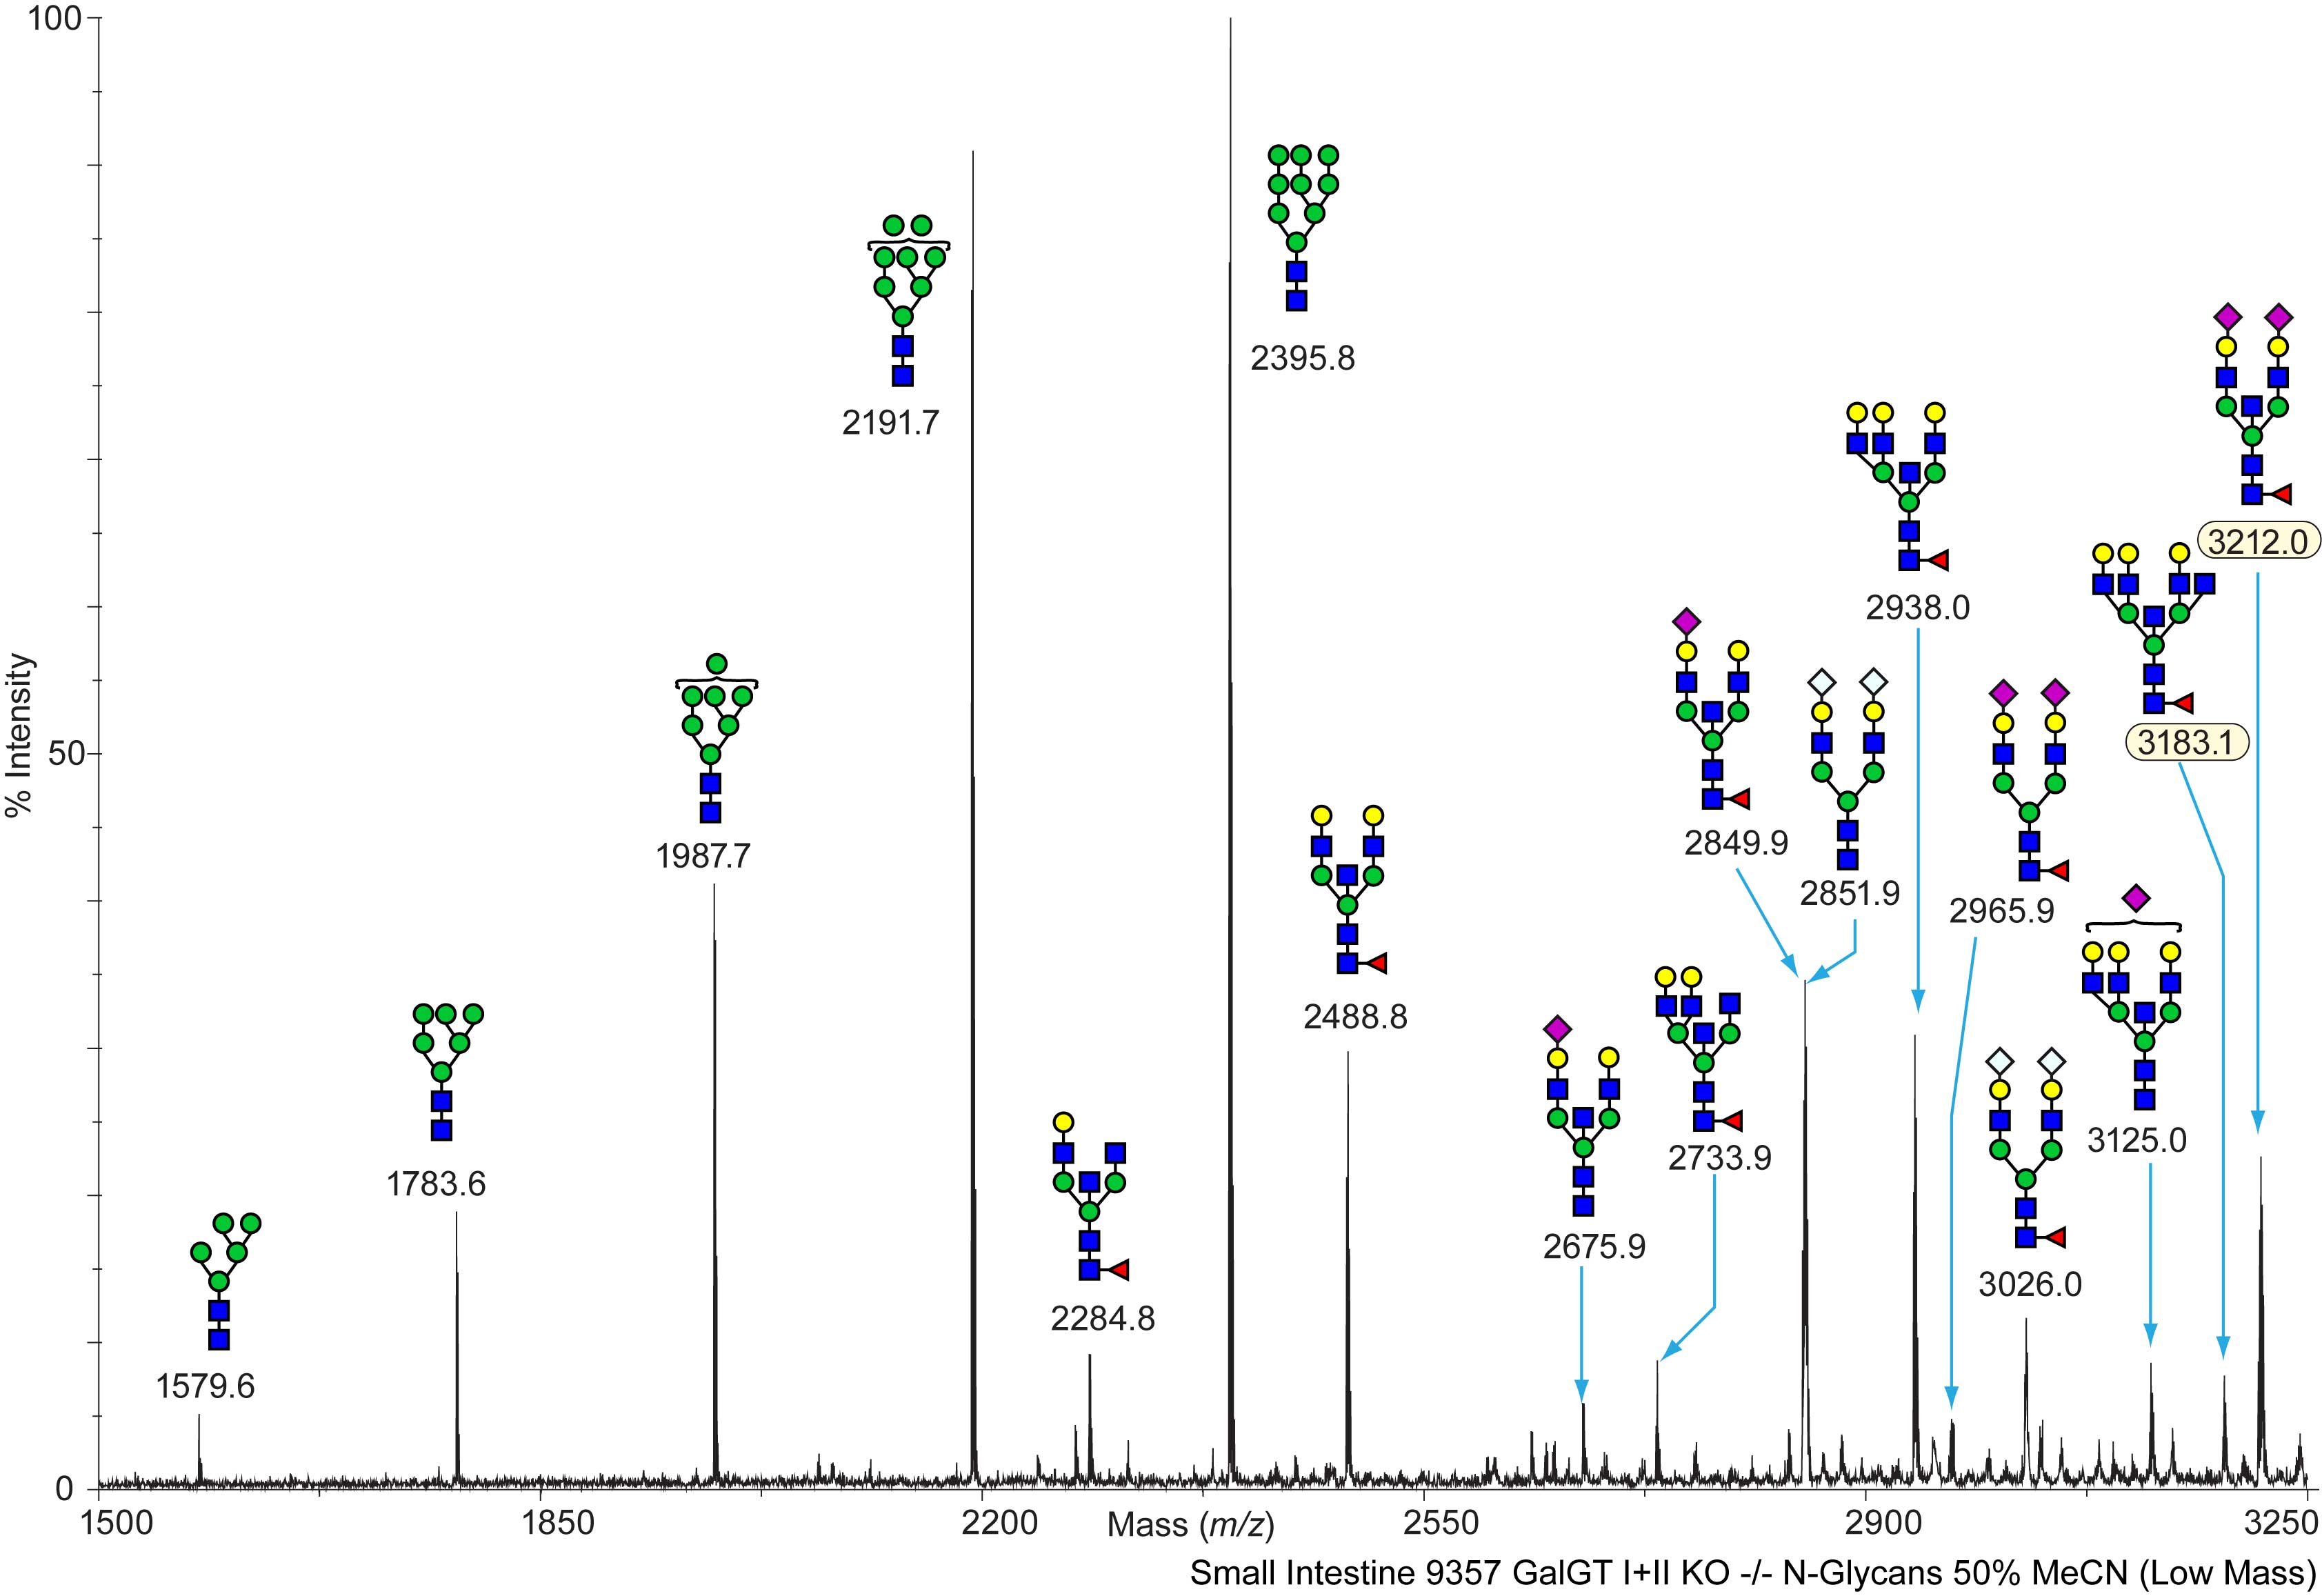
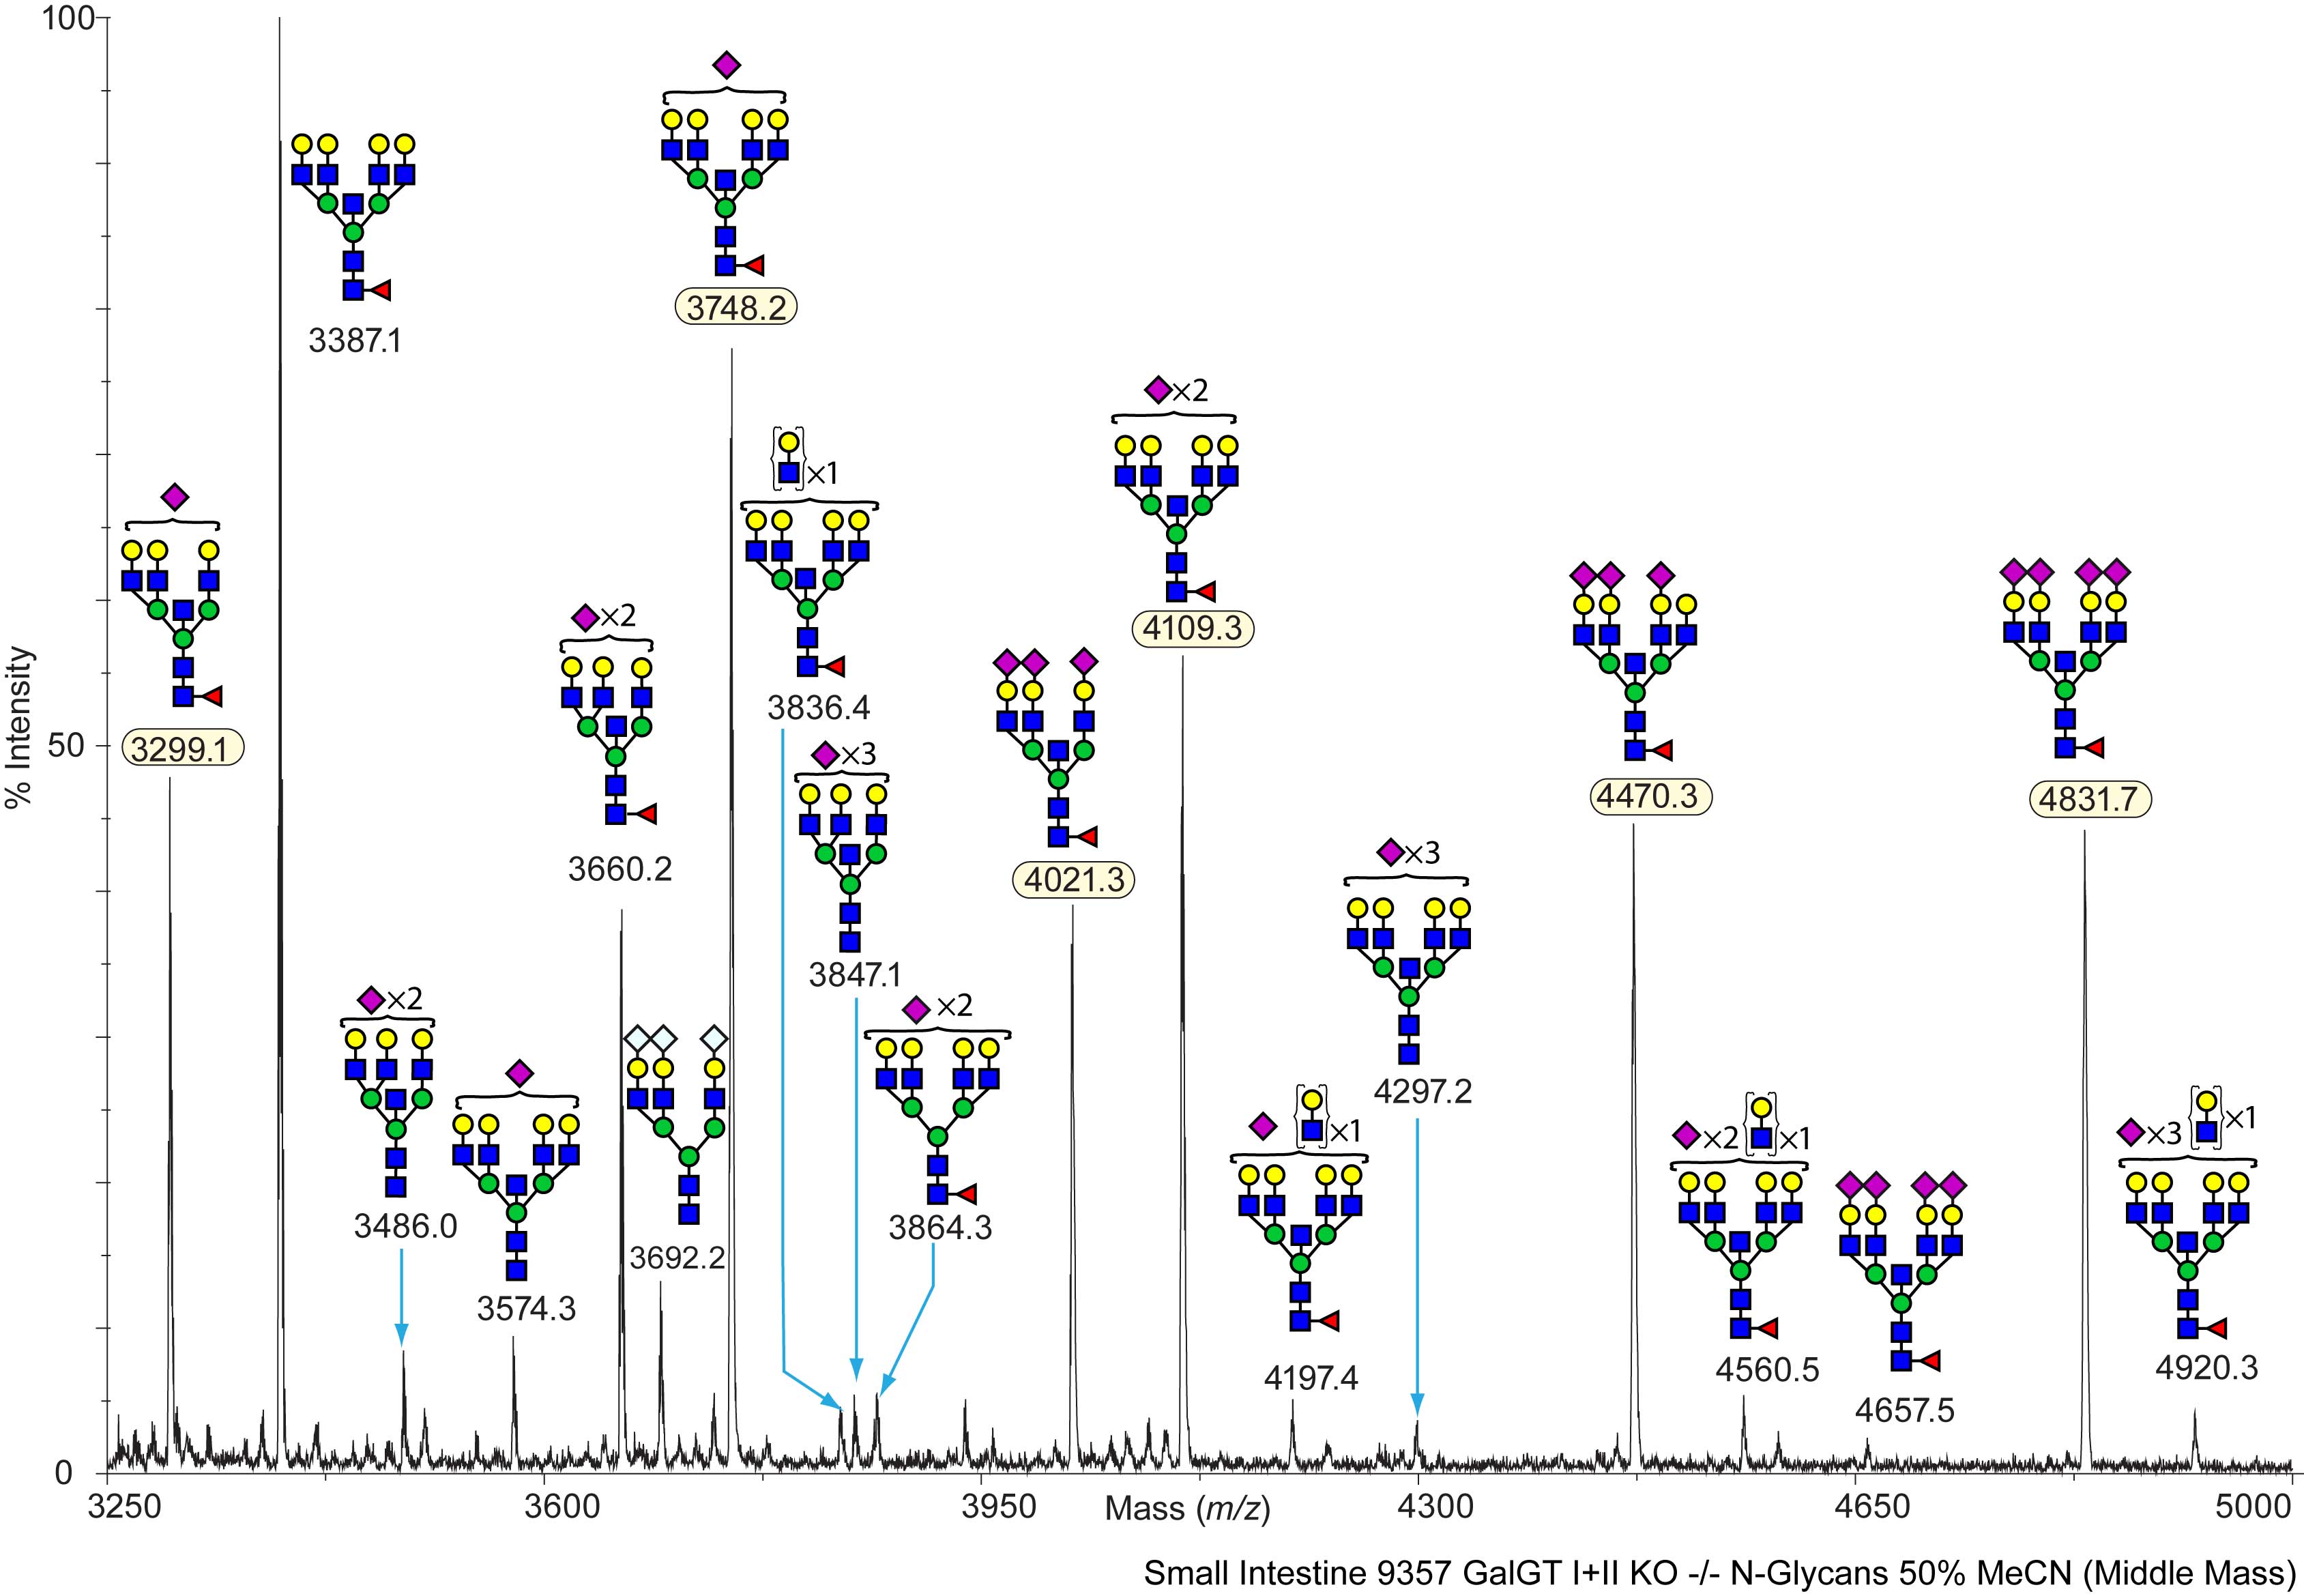
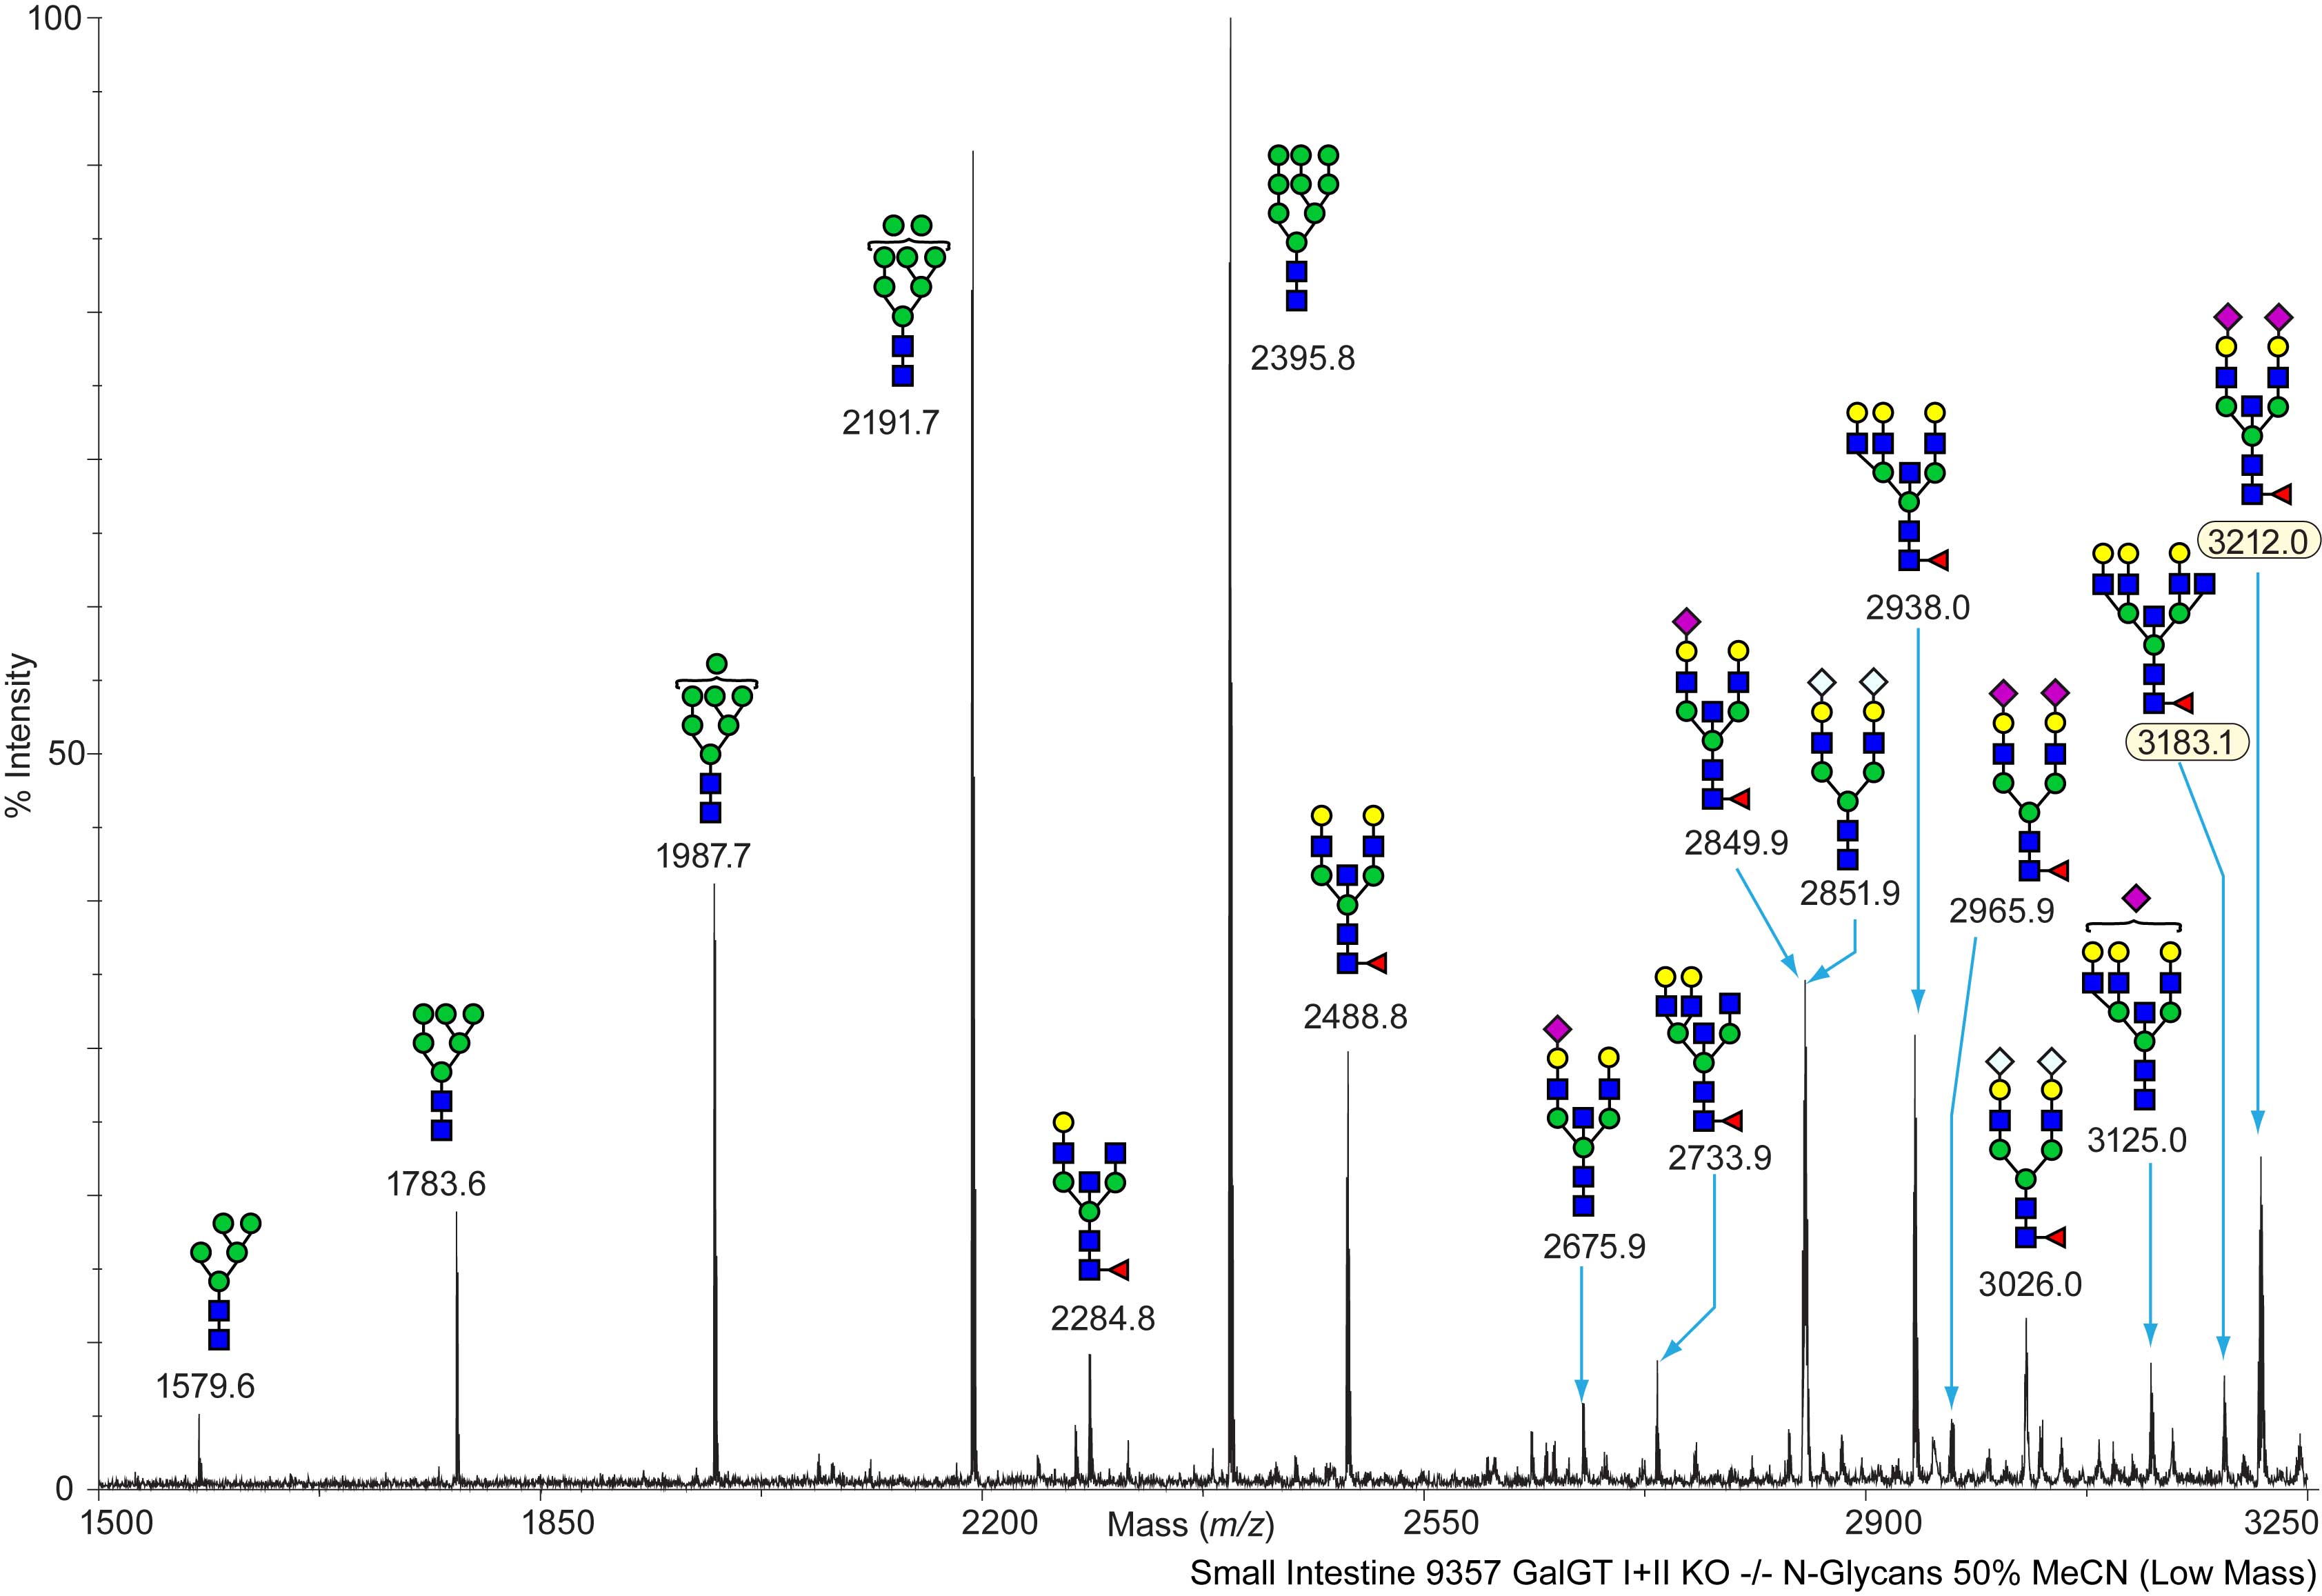
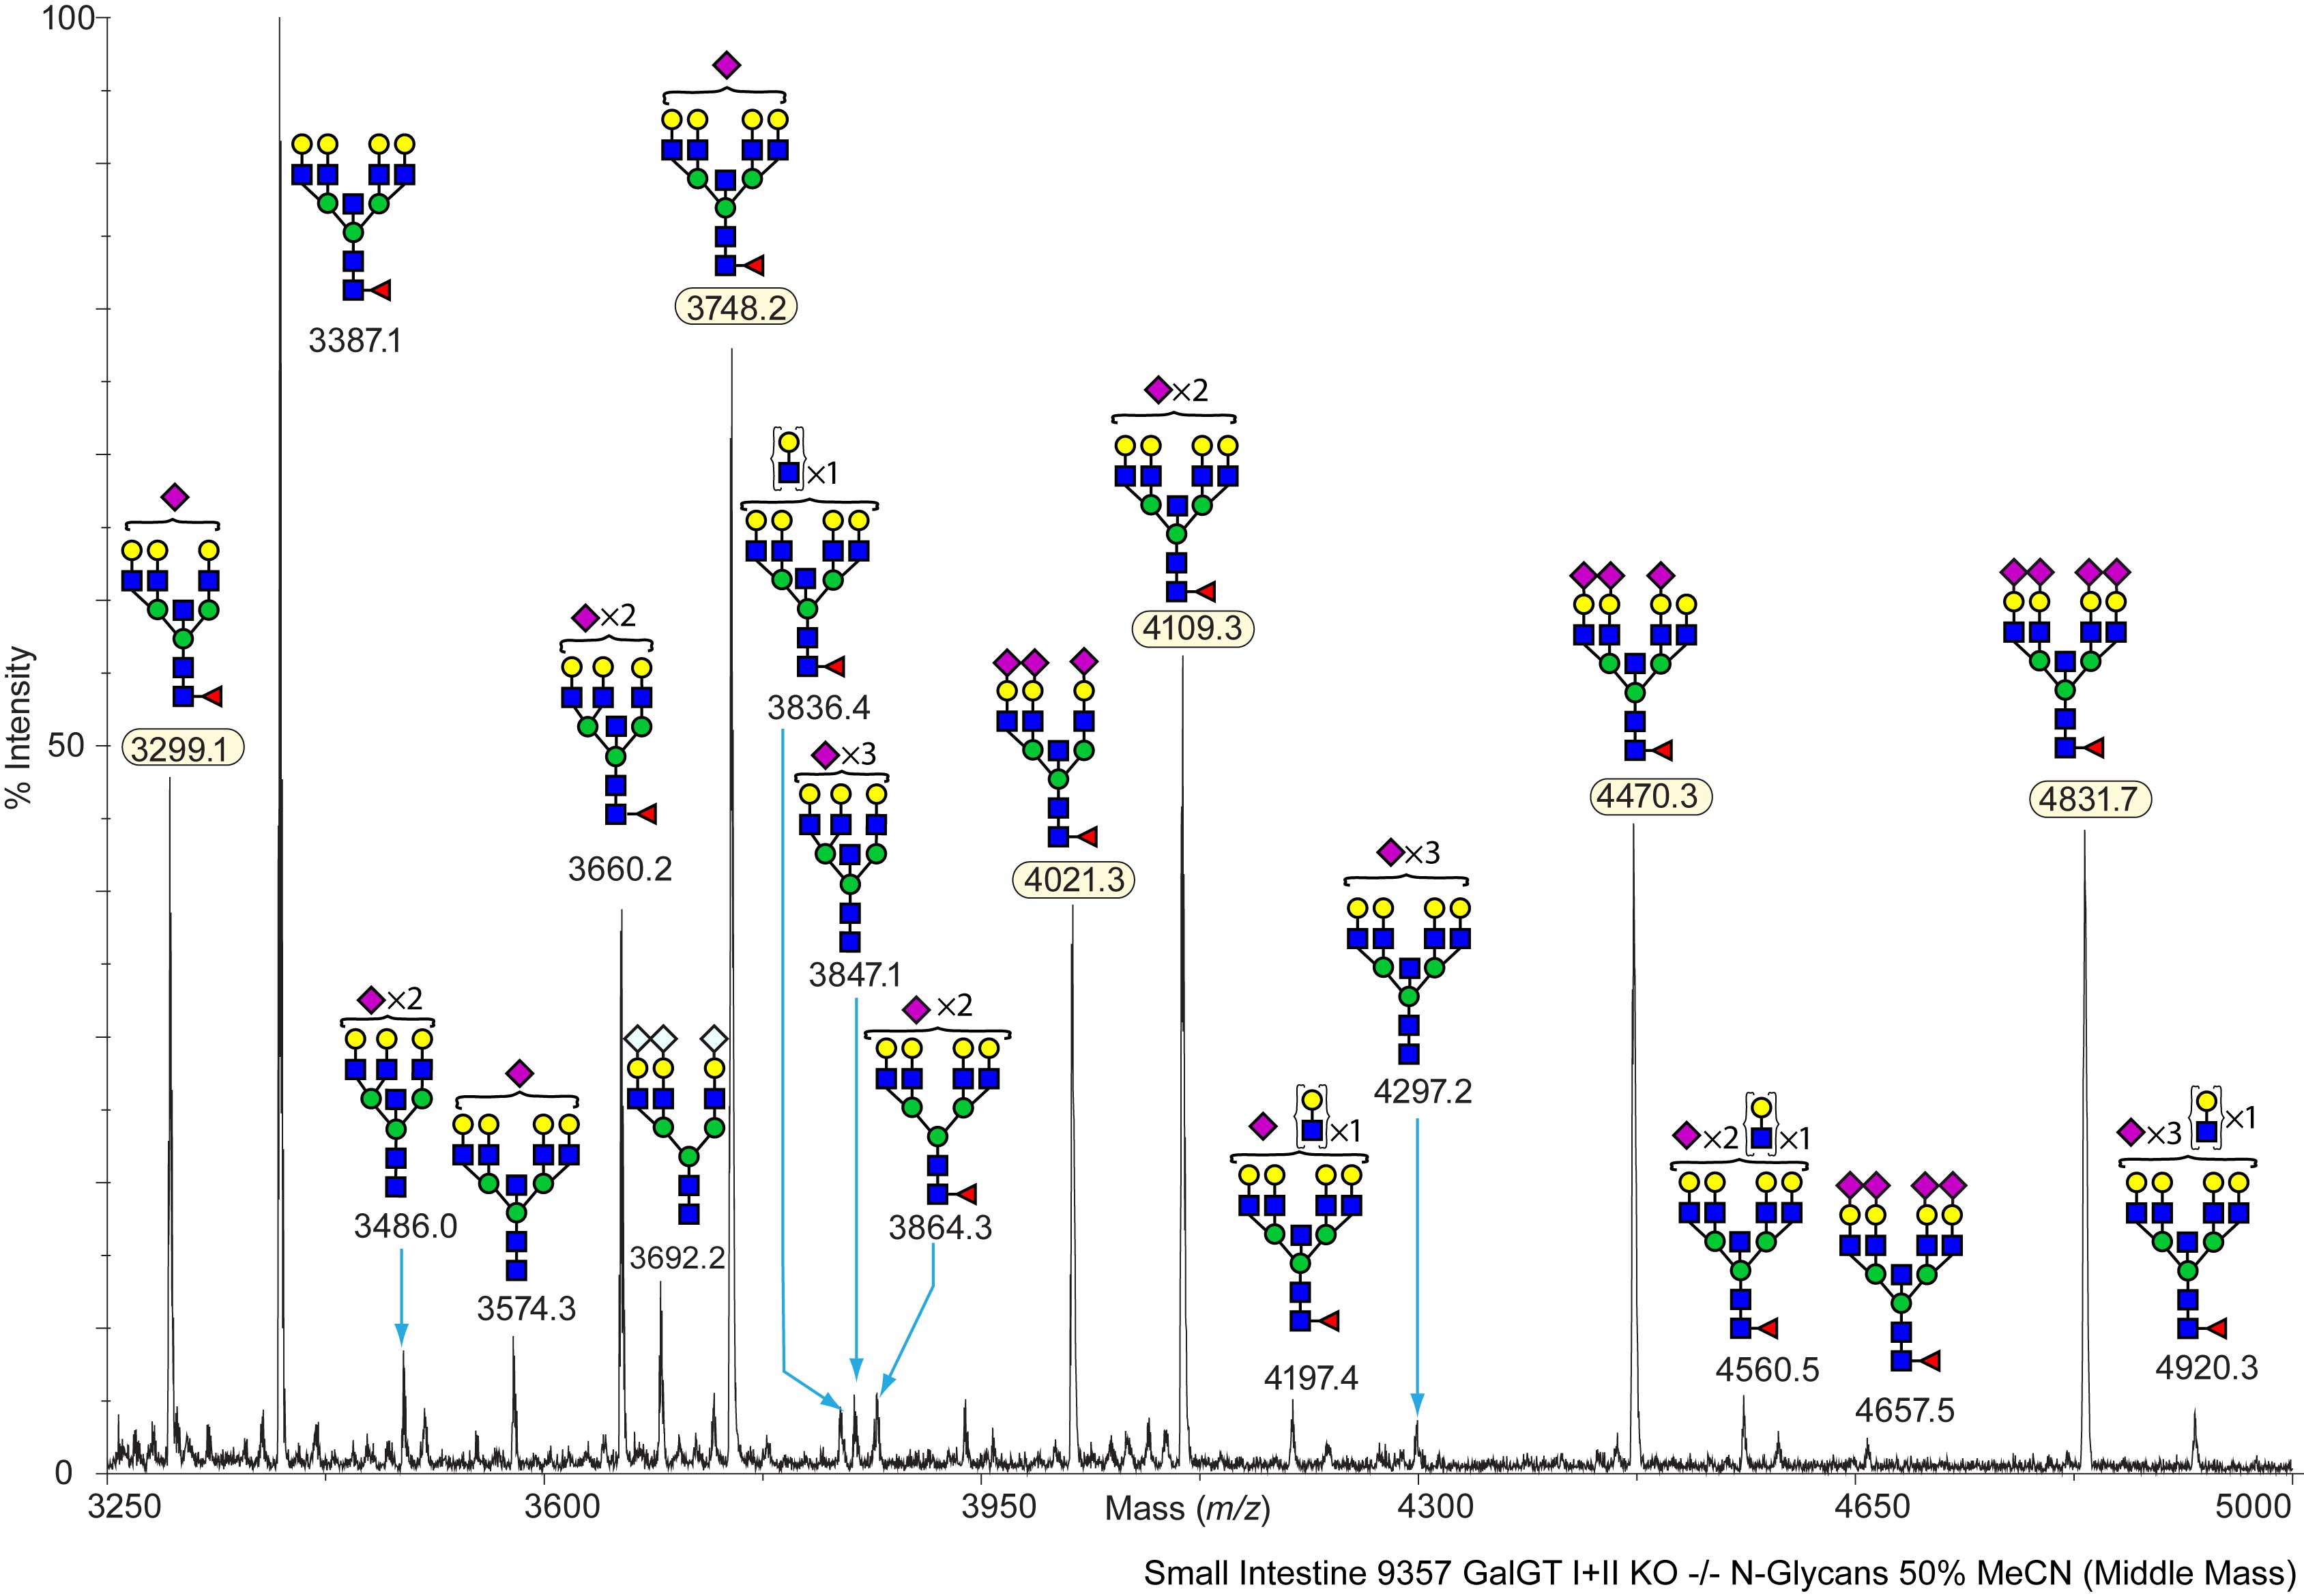
Mouse Wild Type Small Intestine Small Intestine B4galnt1(-/-)/B4galnt2(-/-) DKO Colony Code (GD) Mouse 9357 NG N-Linked C57BL/6 View experimental details      
Annotated file for lower mass range in JPG formatAnnotated file for higher mass range in JPG format Annotated file for lower mass range in PDF formatAnnotated file for higher mass range in PDF format
View Mass Spectrum data as text      
cfg_rRequest_2118
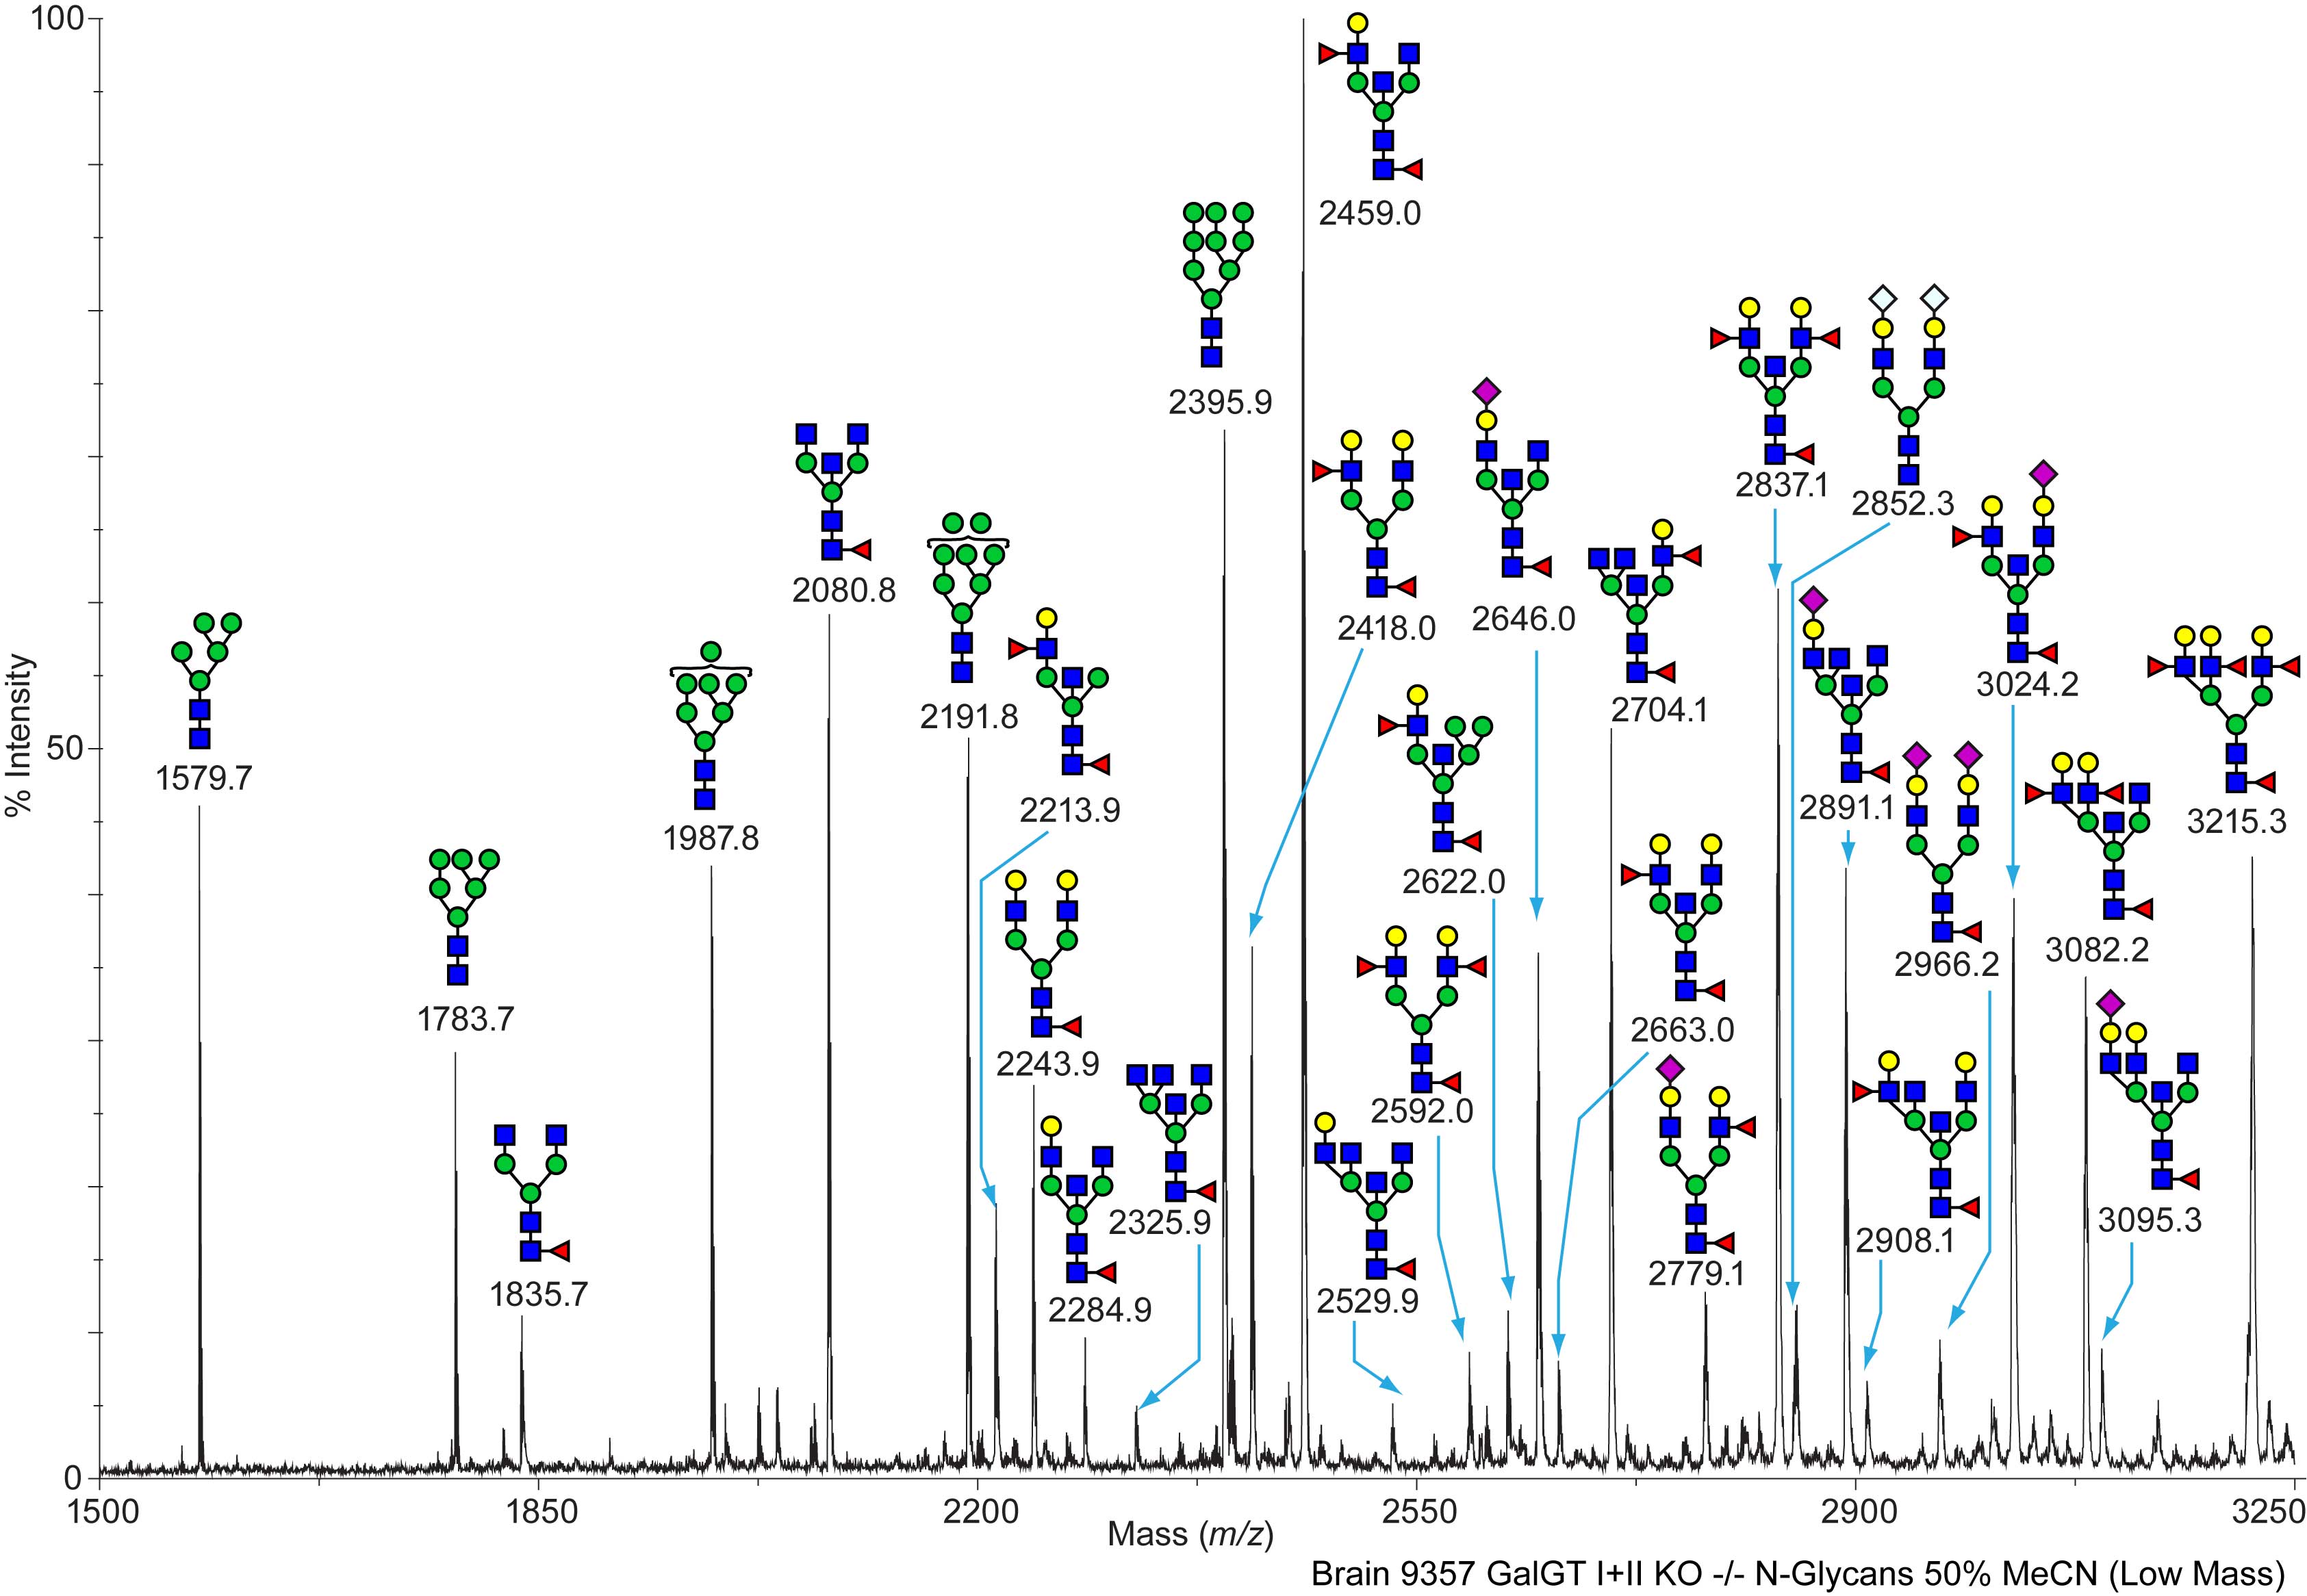
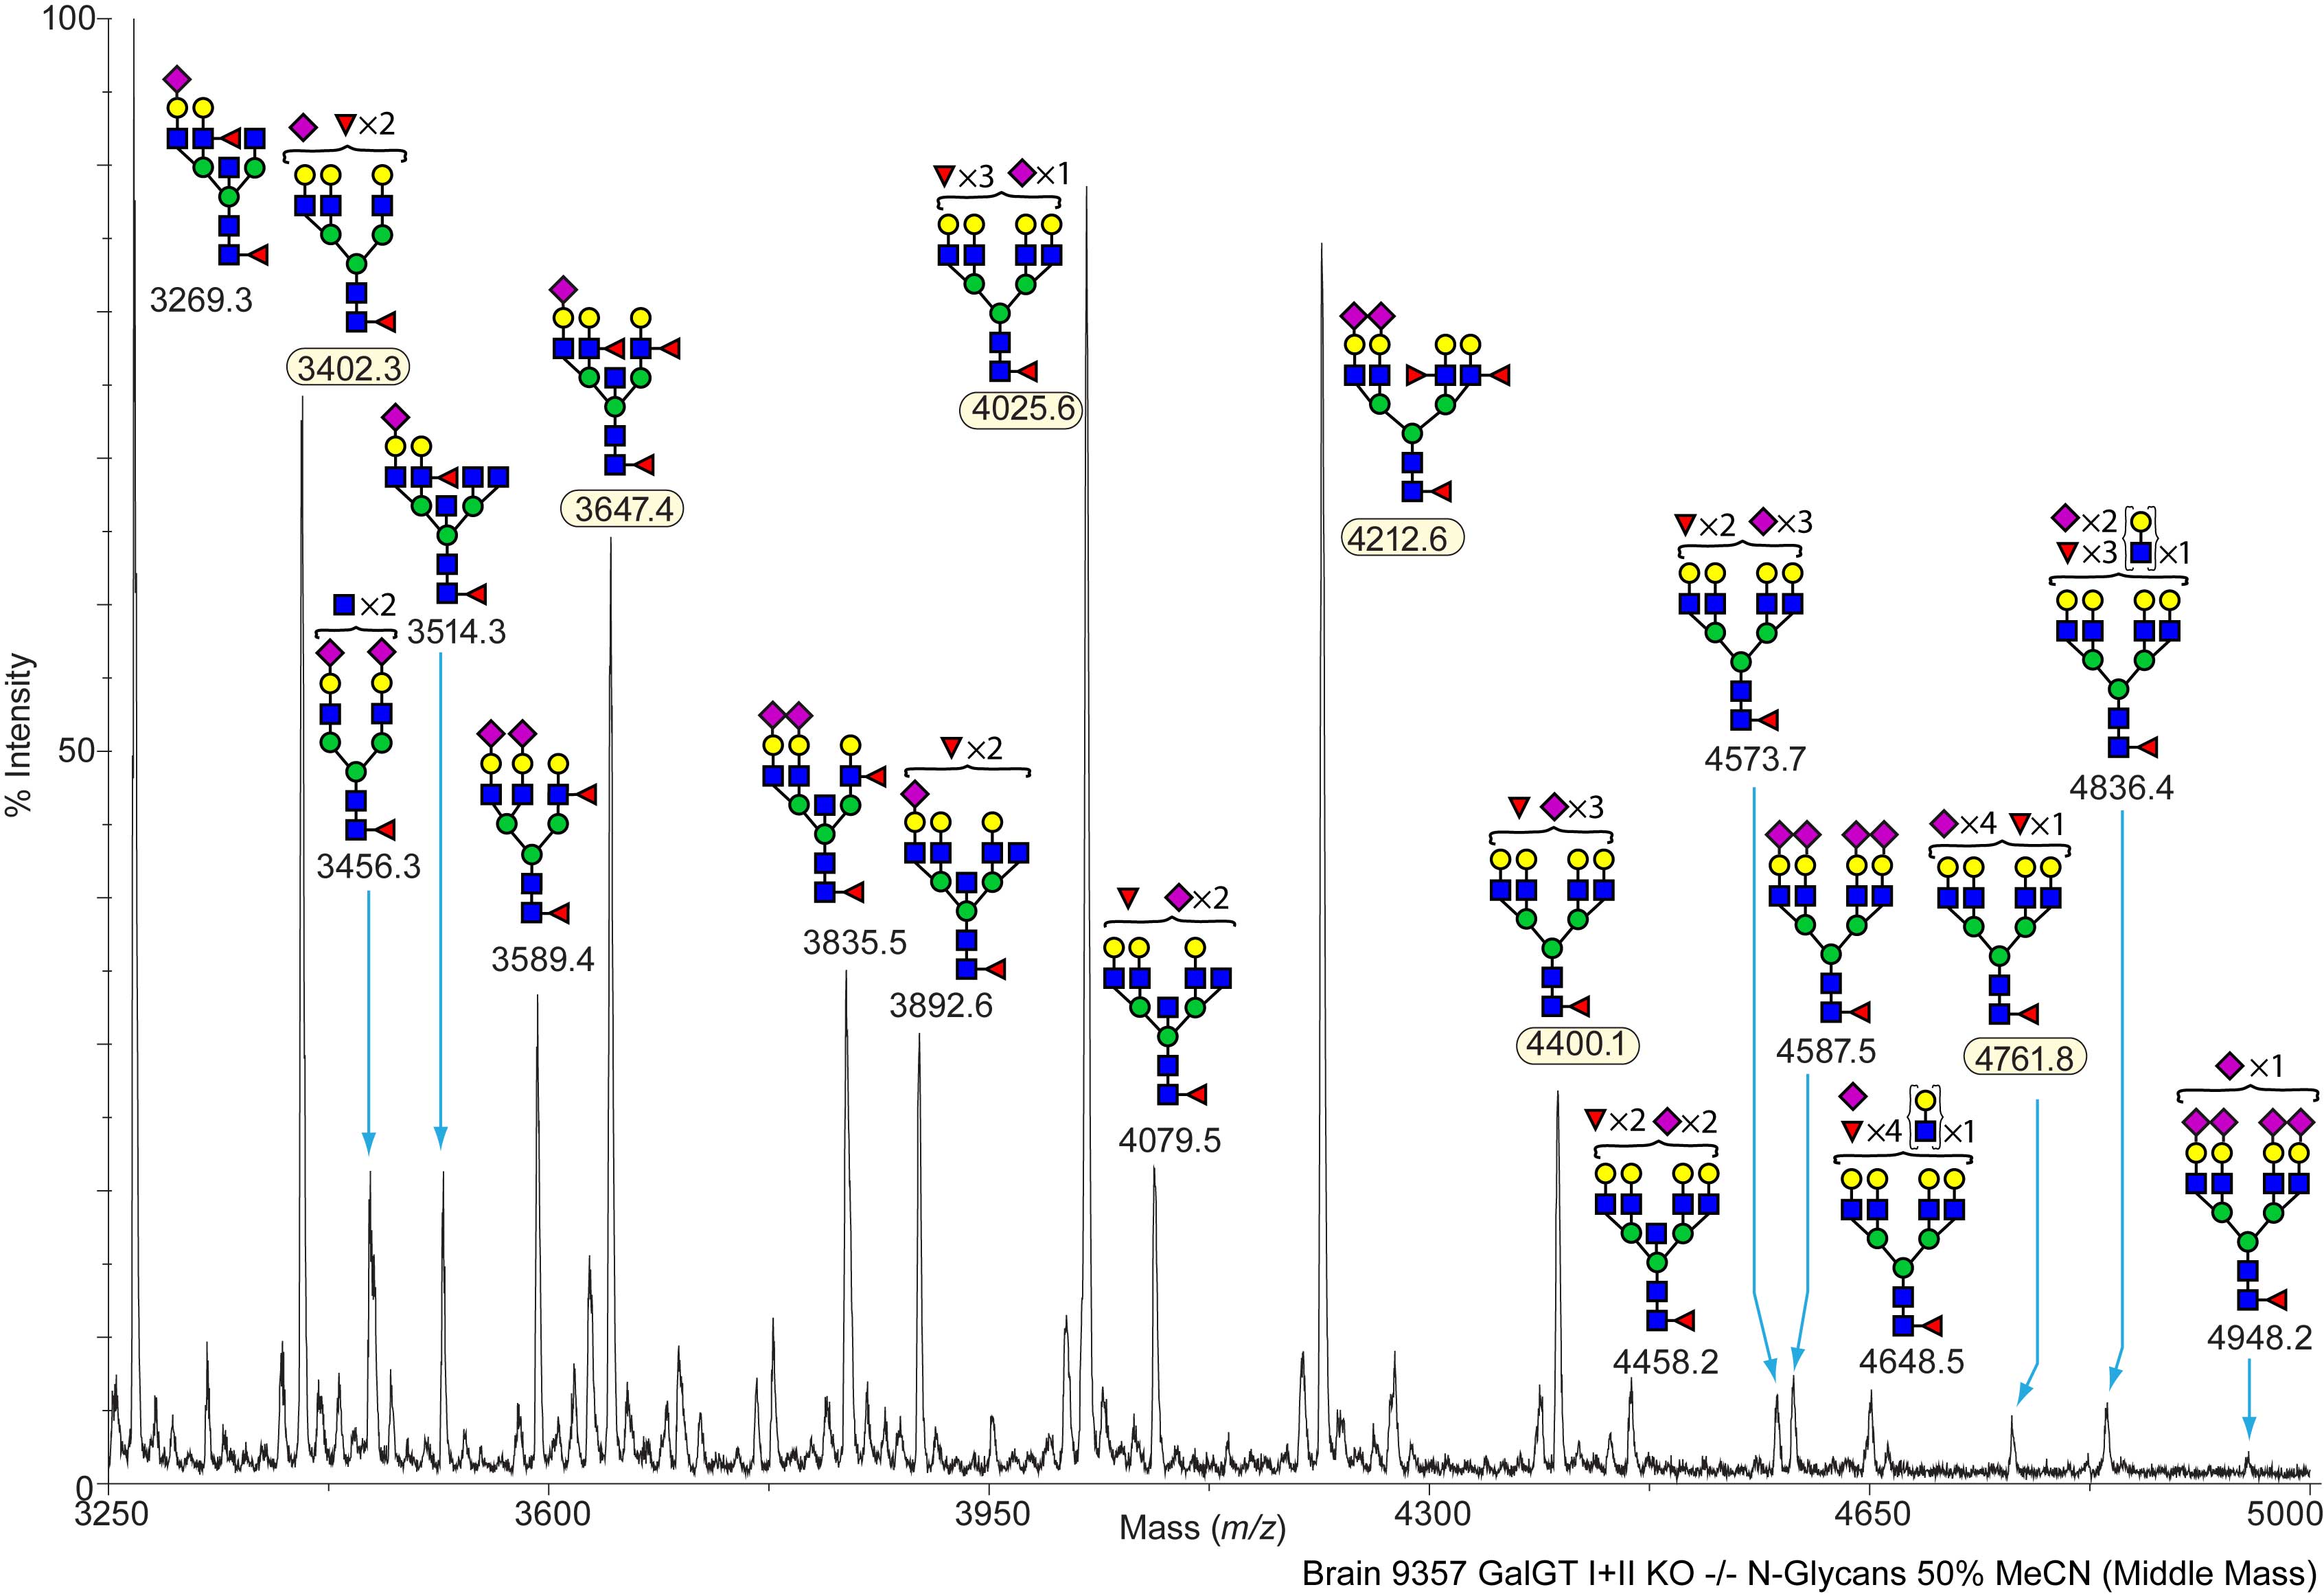
GD Mouse Galgt-1(-/-)/Galgt-2(-/-) Brain Brain B4galnt1(-/-)/B4galnt2(-/-) (GD), 9357, NG N-Linked C57BL/6 View experimental details      
Annotated file for lower mass range in JPG formatAnnotated file for higher mass range in JPG format Annotated file for lower mass range in PDF formatAnnotated file for higher mass range in PDF format
View Mass Spectrum data as text View Mass Peak file   Interactive Mass Spectrum Viewer
cfg_rRequest_2118
GD Mouse Galgt-1(-/-)/Galgt-2(-/-) Brain Brain B4galnt1(-/-)/B4galnt2(-/-) (GD), 9357, OG O-Linked C57BL/6 View experimental details      
Annotated file in JPG format Annotated file in PDF format
View Mass Spectrum data as text      
cfg_rRequest_2118
GD Mouse Galgt-1(-/-)/Galgt-2(-/-) Brain Brain B4galnt1(-/-)/B4galnt2(-/-) (GD), 9357, PGL Polar Glycolipids C57BL/6 View experimental details      
Annotated file in JPG format Annotated file in PDF format
View Mass Spectrum data as text View Mass Peak file   Interactive Mass Spectrum Viewer
cfg_rRequest_2118
GD Mouse Galgt-1(-/-)/Galgt-2(-/-) Brain Brain B4galnt1(-/-)/B4galnt2(-/-) (GD), 9357, NPGL Non-Polar Glycolipids C57BL/6 View experimental details      
   
View Mass Spectrum data as text      
cfg_rRequest_2118
GD Mouse Galgt-1(-/-)/Galgt-2(-/-) Small Intestine Small Intestine B4galnt1(-/-)/B4galnt2(-/-) (GD), 9357, NG N-Linked C57BL/6 View experimental details      
Annotated file for lower mass range in JPG formatAnnotated file for higher mass range in JPG format Annotated file for lower mass range in PDF formatAnnotated file for higher mass range in PDF format
View Mass Spectrum data as text      
cfg_rRequest_2118
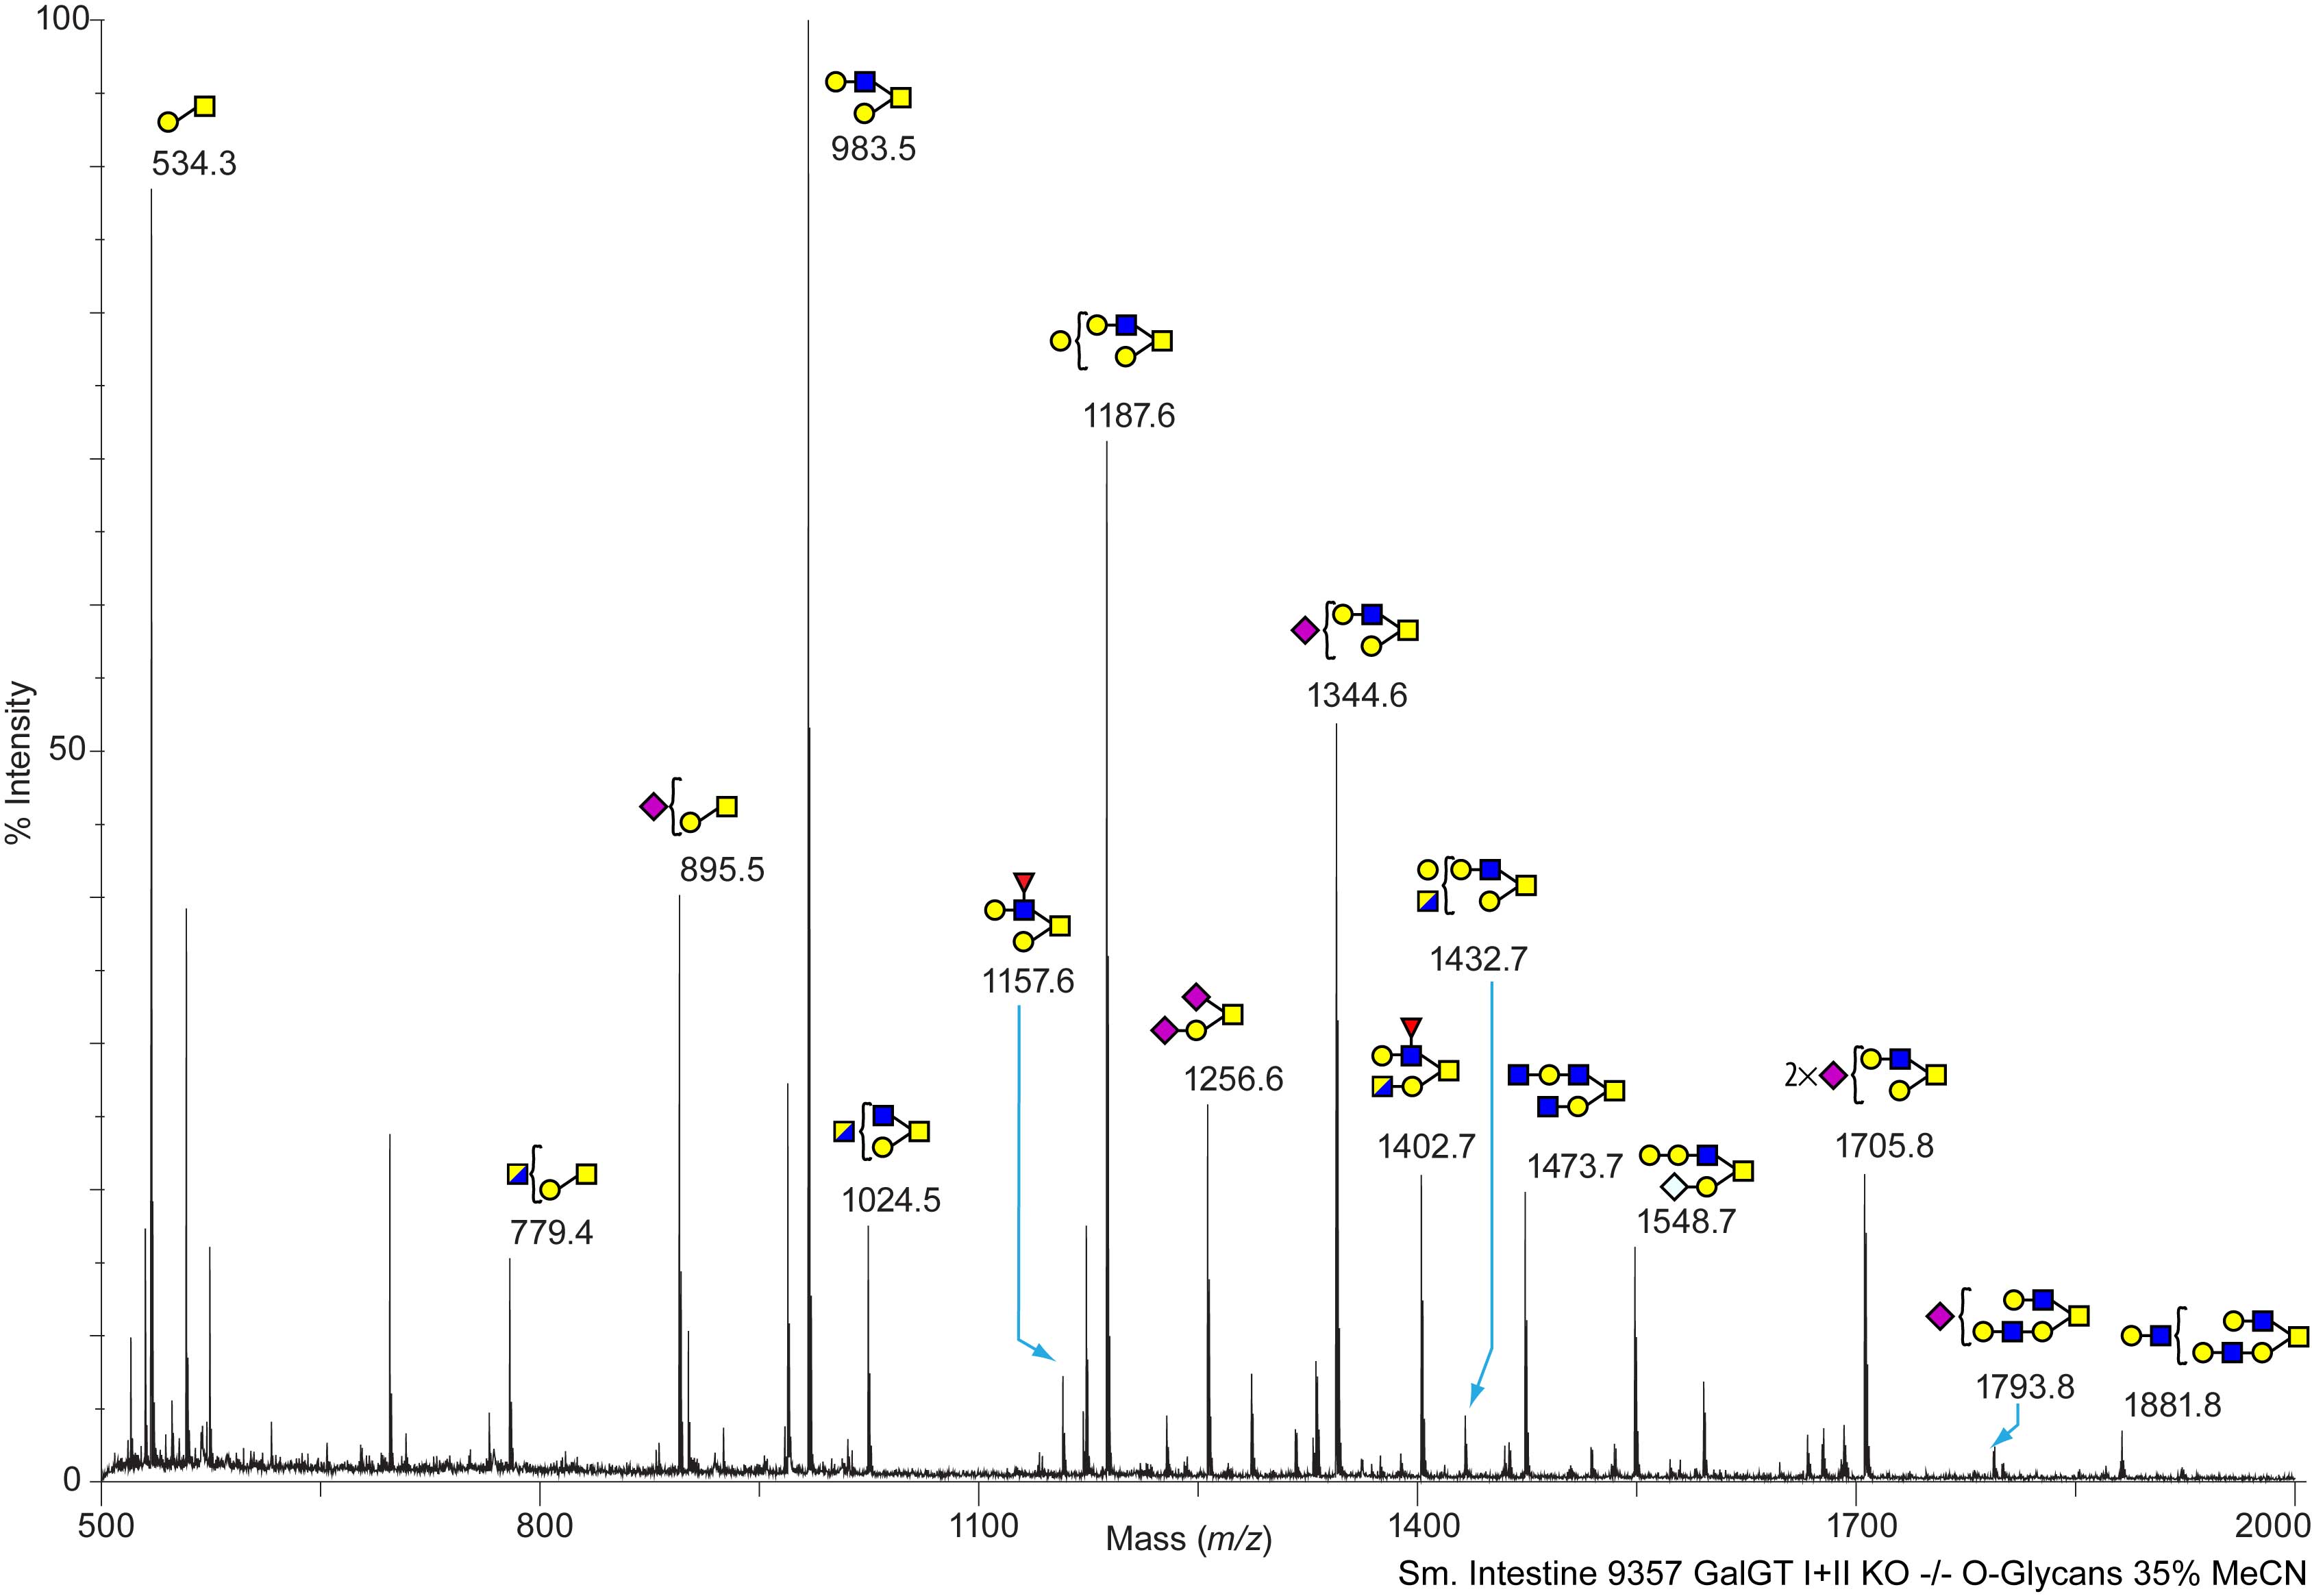
GD Mouse Galgt-1(-/-)/Galgt-2(-/-) Small Intestine Small Intestine B4galnt1(-/-)/B4galnt2(-/-) (GD), 9357, OG O-Linked C57BL/6 View experimental details      
Annotated file in JPG format Annotated file in PDF format
View Mass Spectrum data as text View Mass Peak file   Interactive Mass Spectrum Viewer
cfg_rRequest_2118
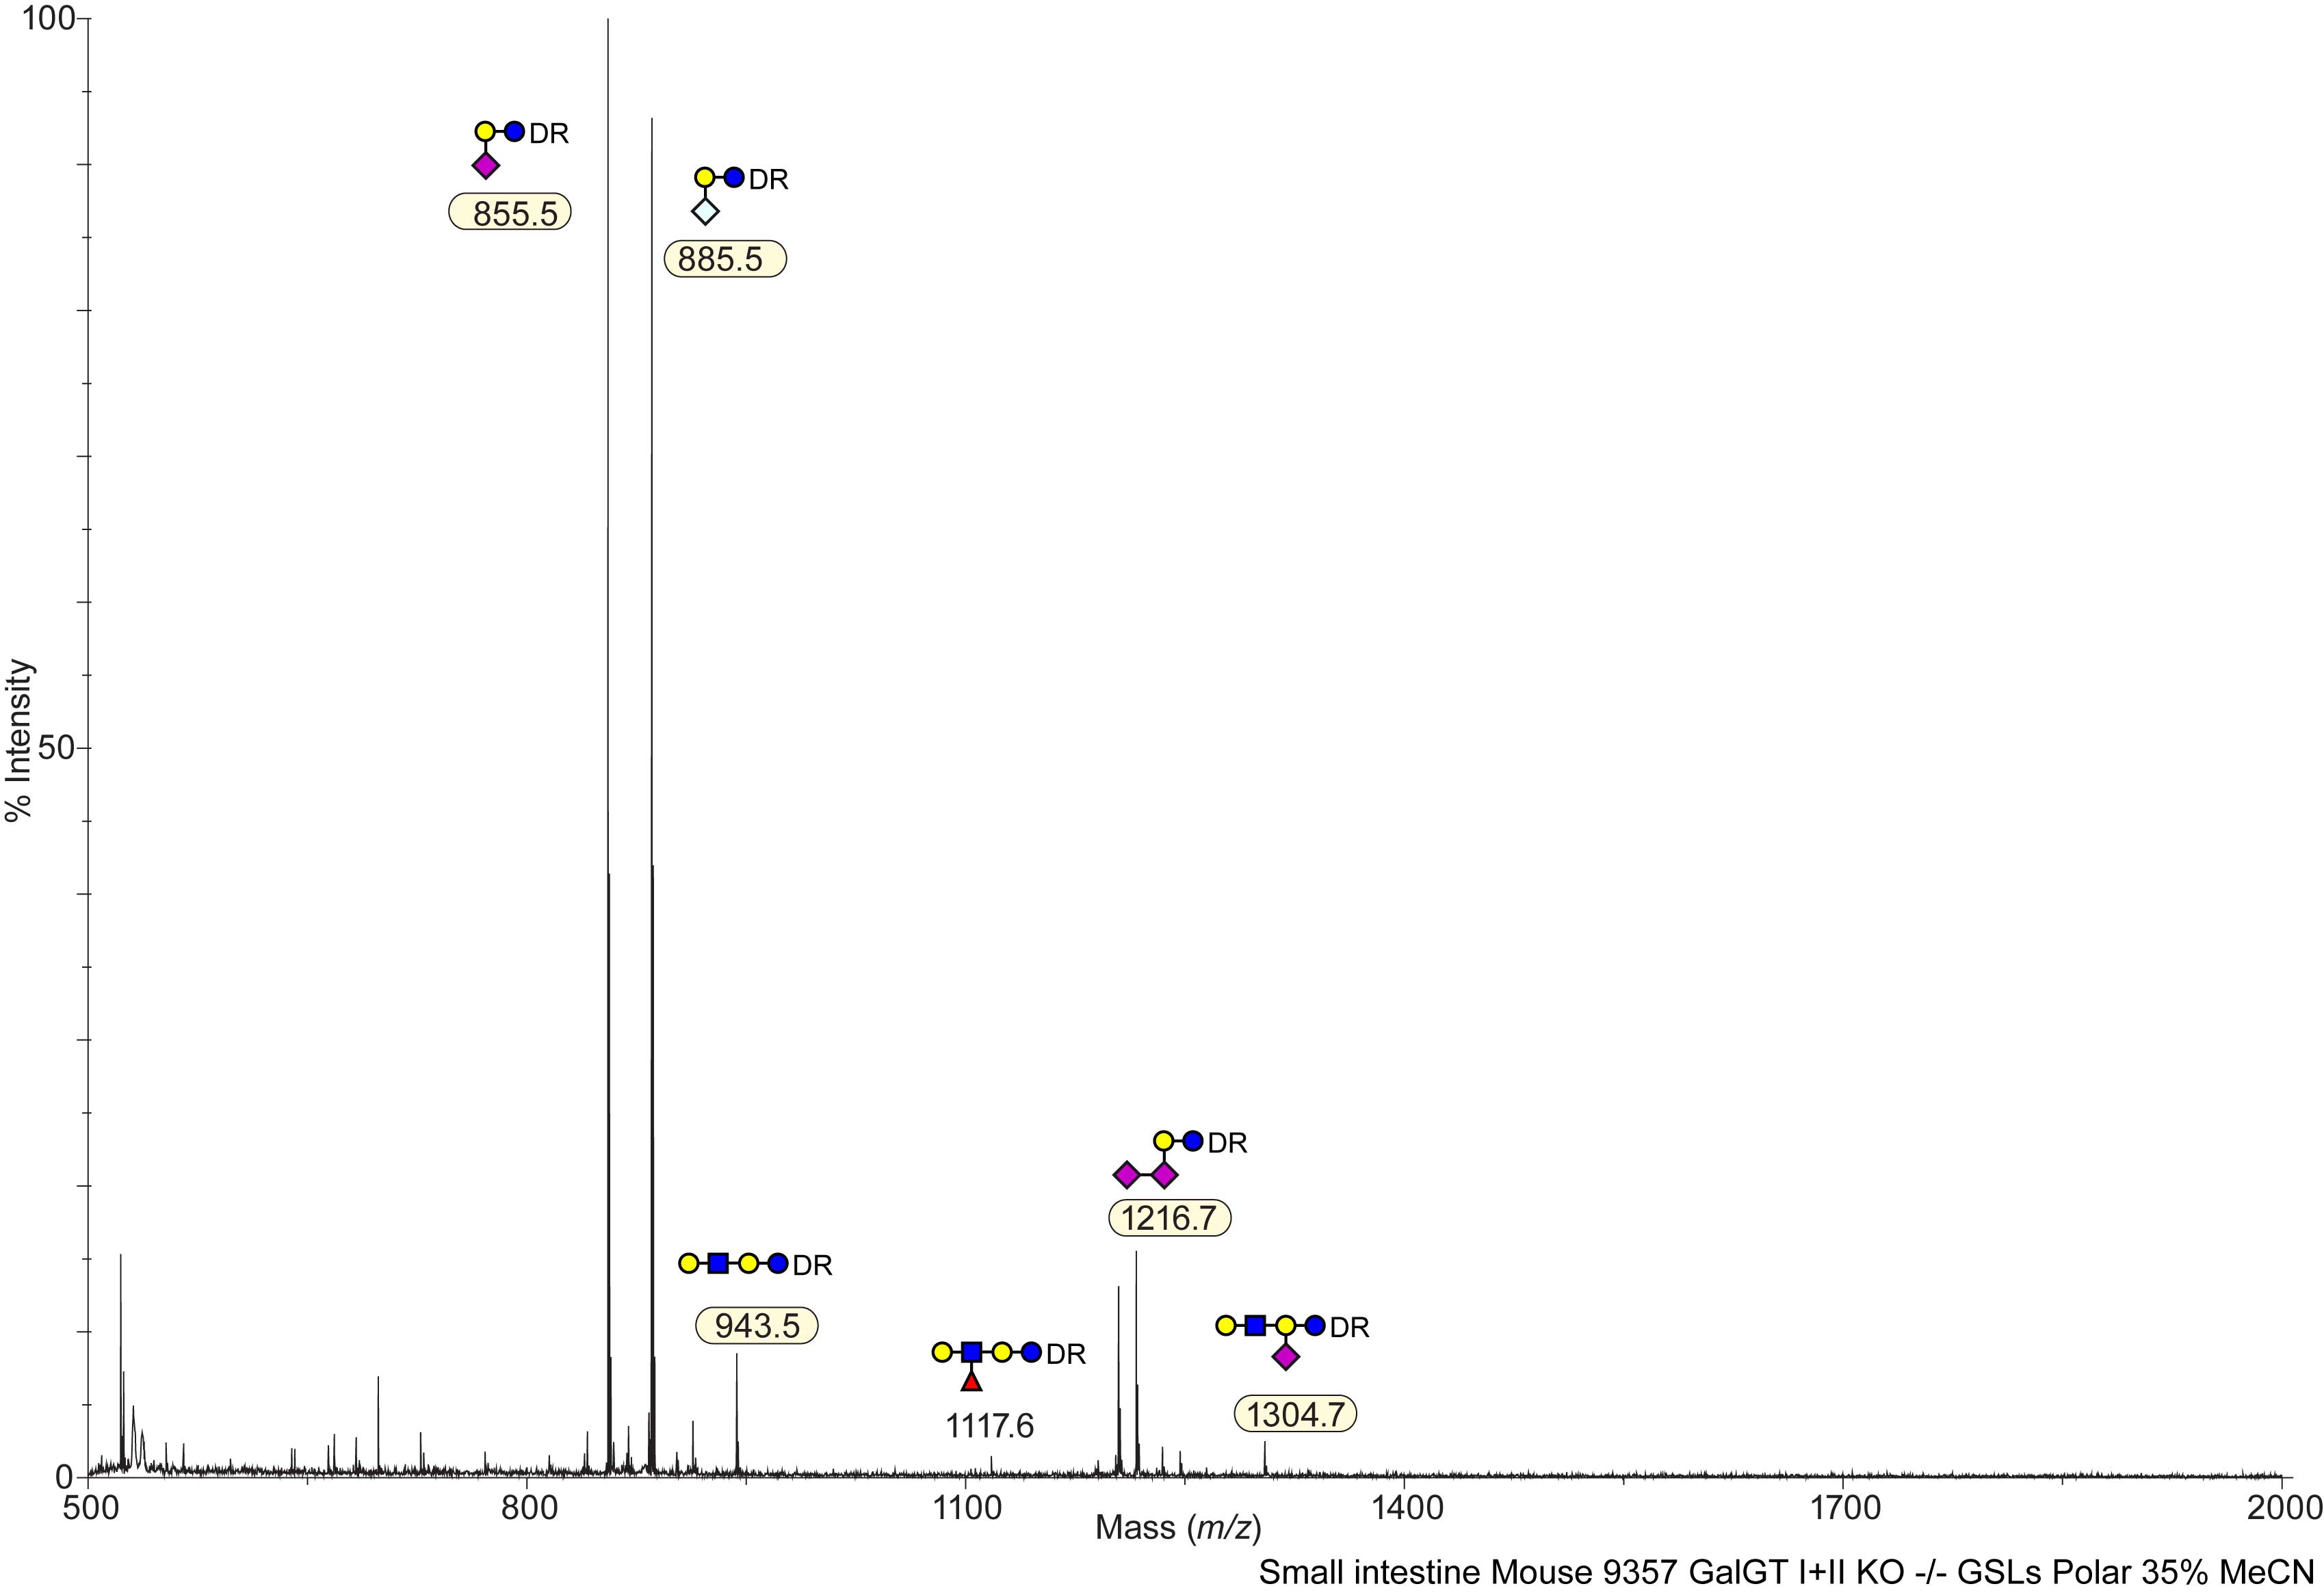
GD Mouse Galgt-1(-/-)/Galgt-2(-/-) Small Intestine Small Intestine B4galnt1(-/-)/B4galnt2(-/-) (GD), 9357, PGL Polar Glycolipids C57BL/6 View experimental details      
Annotated file in JPG format Annotated file in PDF format
View Mass Spectrum data as text View Mass Peak file   Interactive Mass Spectrum Viewer
cfg_rRequest_2118
GD Mouse Galgt-1(-/-)/Galgt-2(-/-) Small Intestine Small Intestine B4galnt1(-/-)/B4galnt2(-/-) (GD), 9357, NPGL Non-Polar Glycolipids C57BL/6 View experimental details      
   
View Mass Spectrum data as text      
cfg_rRequest_2118
GP Mouse Galgt-1(-/-)/Galgt-2(-/-) Brain Brain B4galnt1(+/-)/B4galnt2(-/-), (GP), 9356, NG N-Linked C57BL/6 View experimental details      
Annotated file for lower mass range in JPG formatAnnotated file for higher mass range in JPG format Annotated file for lower mass range in PDF formatAnnotated file for higher mass range in PDF format
View Mass Spectrum data as text View Mass Peak file   Interactive Mass Spectrum Viewer
cfg_rRequest_2118
GP Mouse Galgt-1(-/-)/Galgt-2(-/-) Brain Brain B4galnt1(+/-)/B4galnt2(-/-), (GP), 9356, OG O-Linked C57BL/6 View experimental details      
Annotated file in JPG format Annotated file in PDF format
View Mass Spectrum data as text View Mass Peak file   Interactive Mass Spectrum Viewer
cfg_rRequest_2118
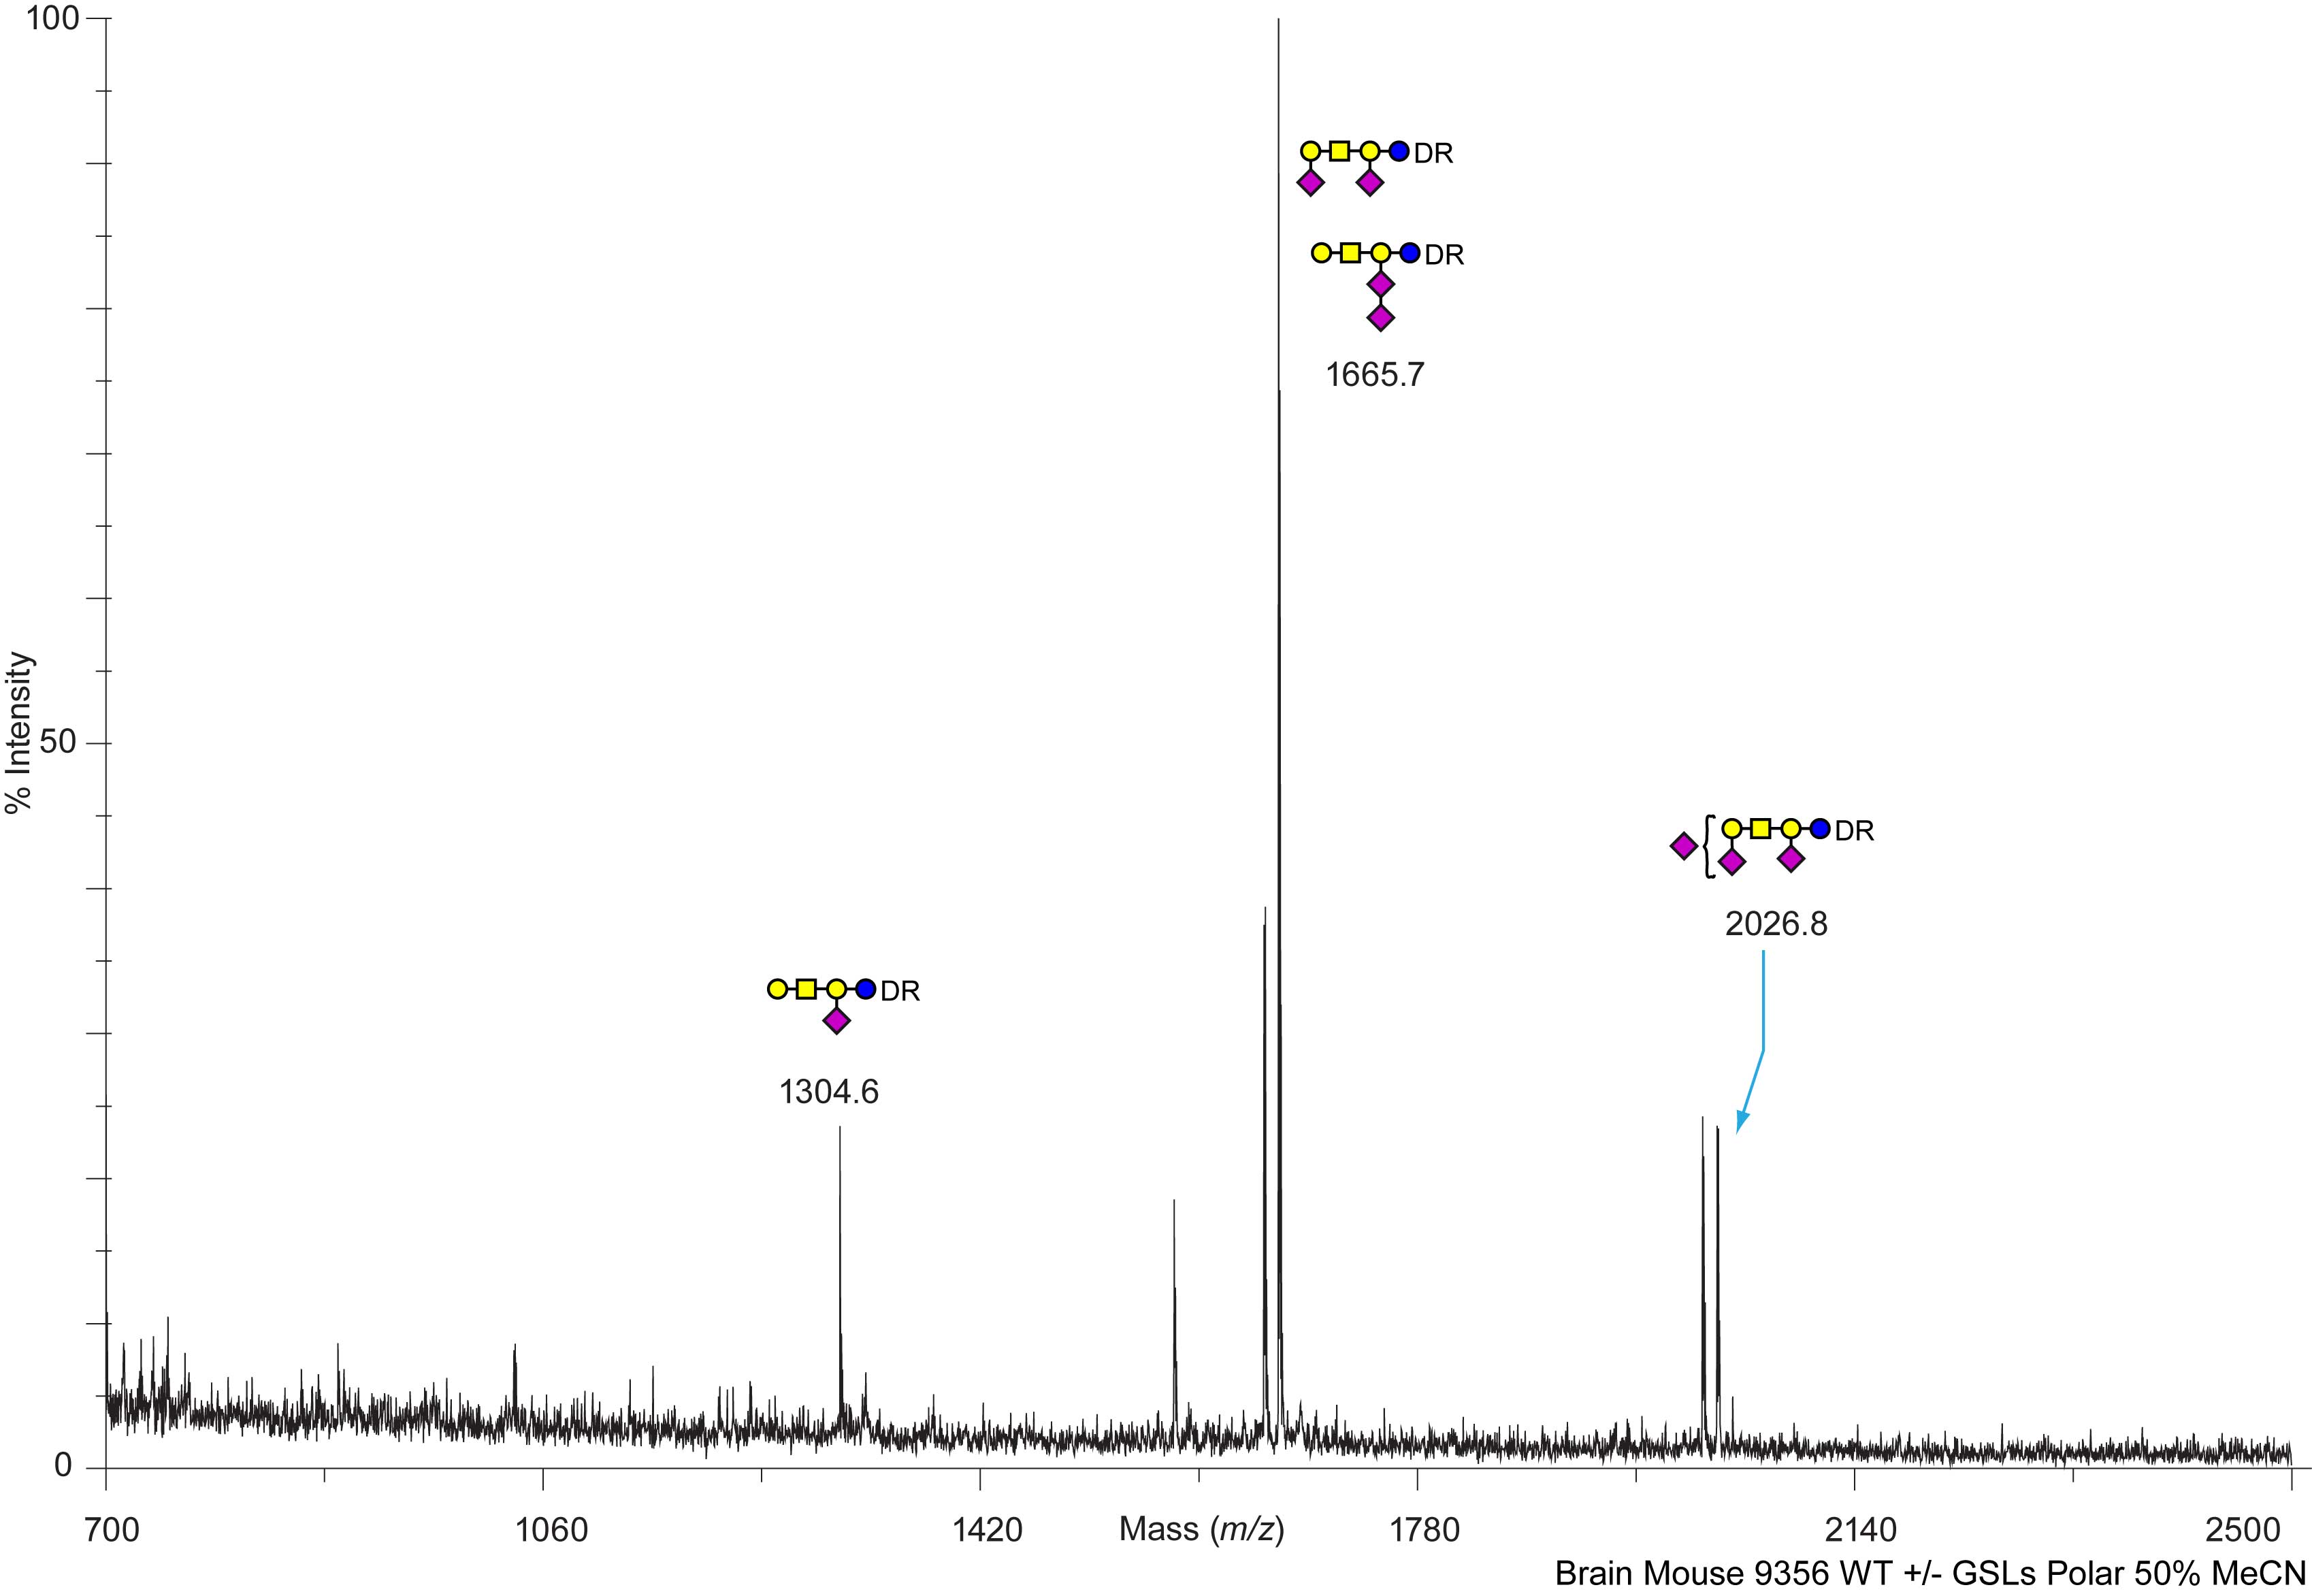
GP Mouse Galgt-1(-/-)/Galgt-2(-/-) Brain Brain B4galnt1(+/-)/B4galnt2(-/-), (GP), 9356, PGL Polar Glycolipids C57BL/6 View experimental details      
Annotated file for lower mass range in JPG formatAnnotated file for higher mass range in JPG format Annotated file for lower mass range in PDF formatAnnotated file for higher mass range in PDF format
View Mass Spectrum data as text View Mass Peak file   Interactive Mass Spectrum Viewer
cfg_rRequest_2118
GP Mouse Galgt-1(-/-)/Galgt-2(-/-) Brain Brain B4galnt1(+/-)/B4galnt2(-/-), (GP), 9356, NPGL Non-Polar Glycolipids C57BL/6 View experimental details      
   
View Mass Spectrum data as text      
cfg_rRequest_2118
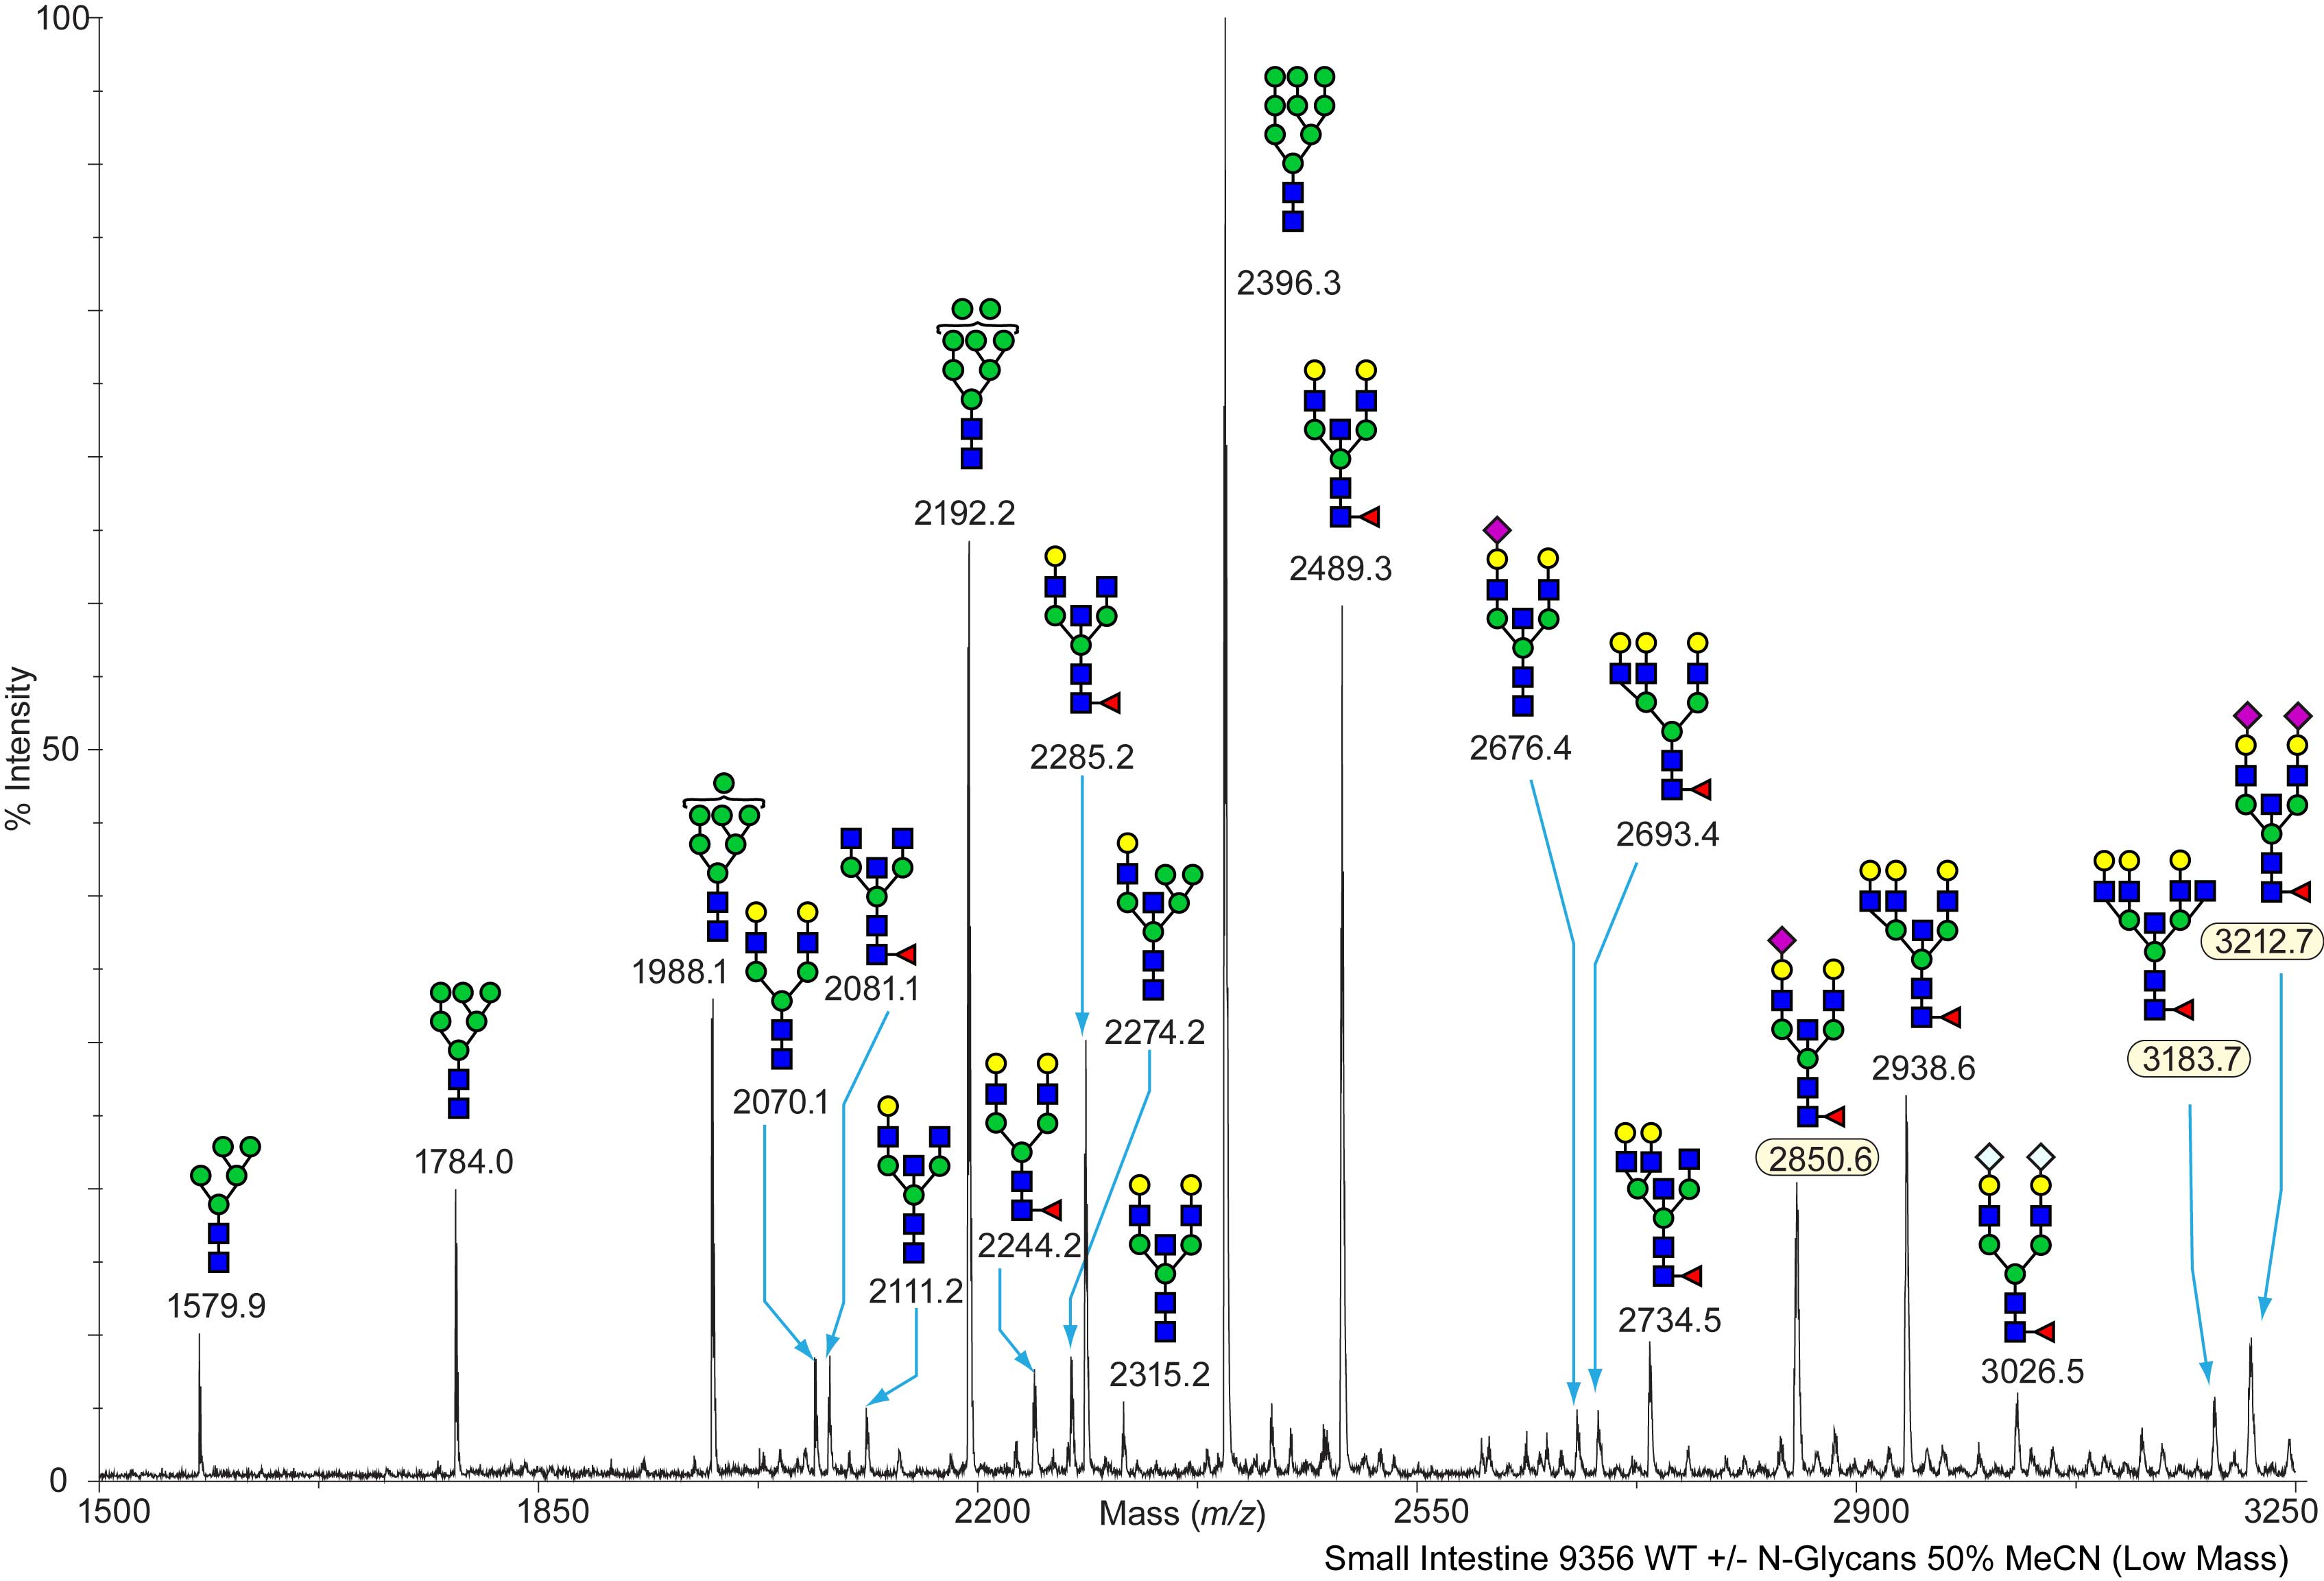
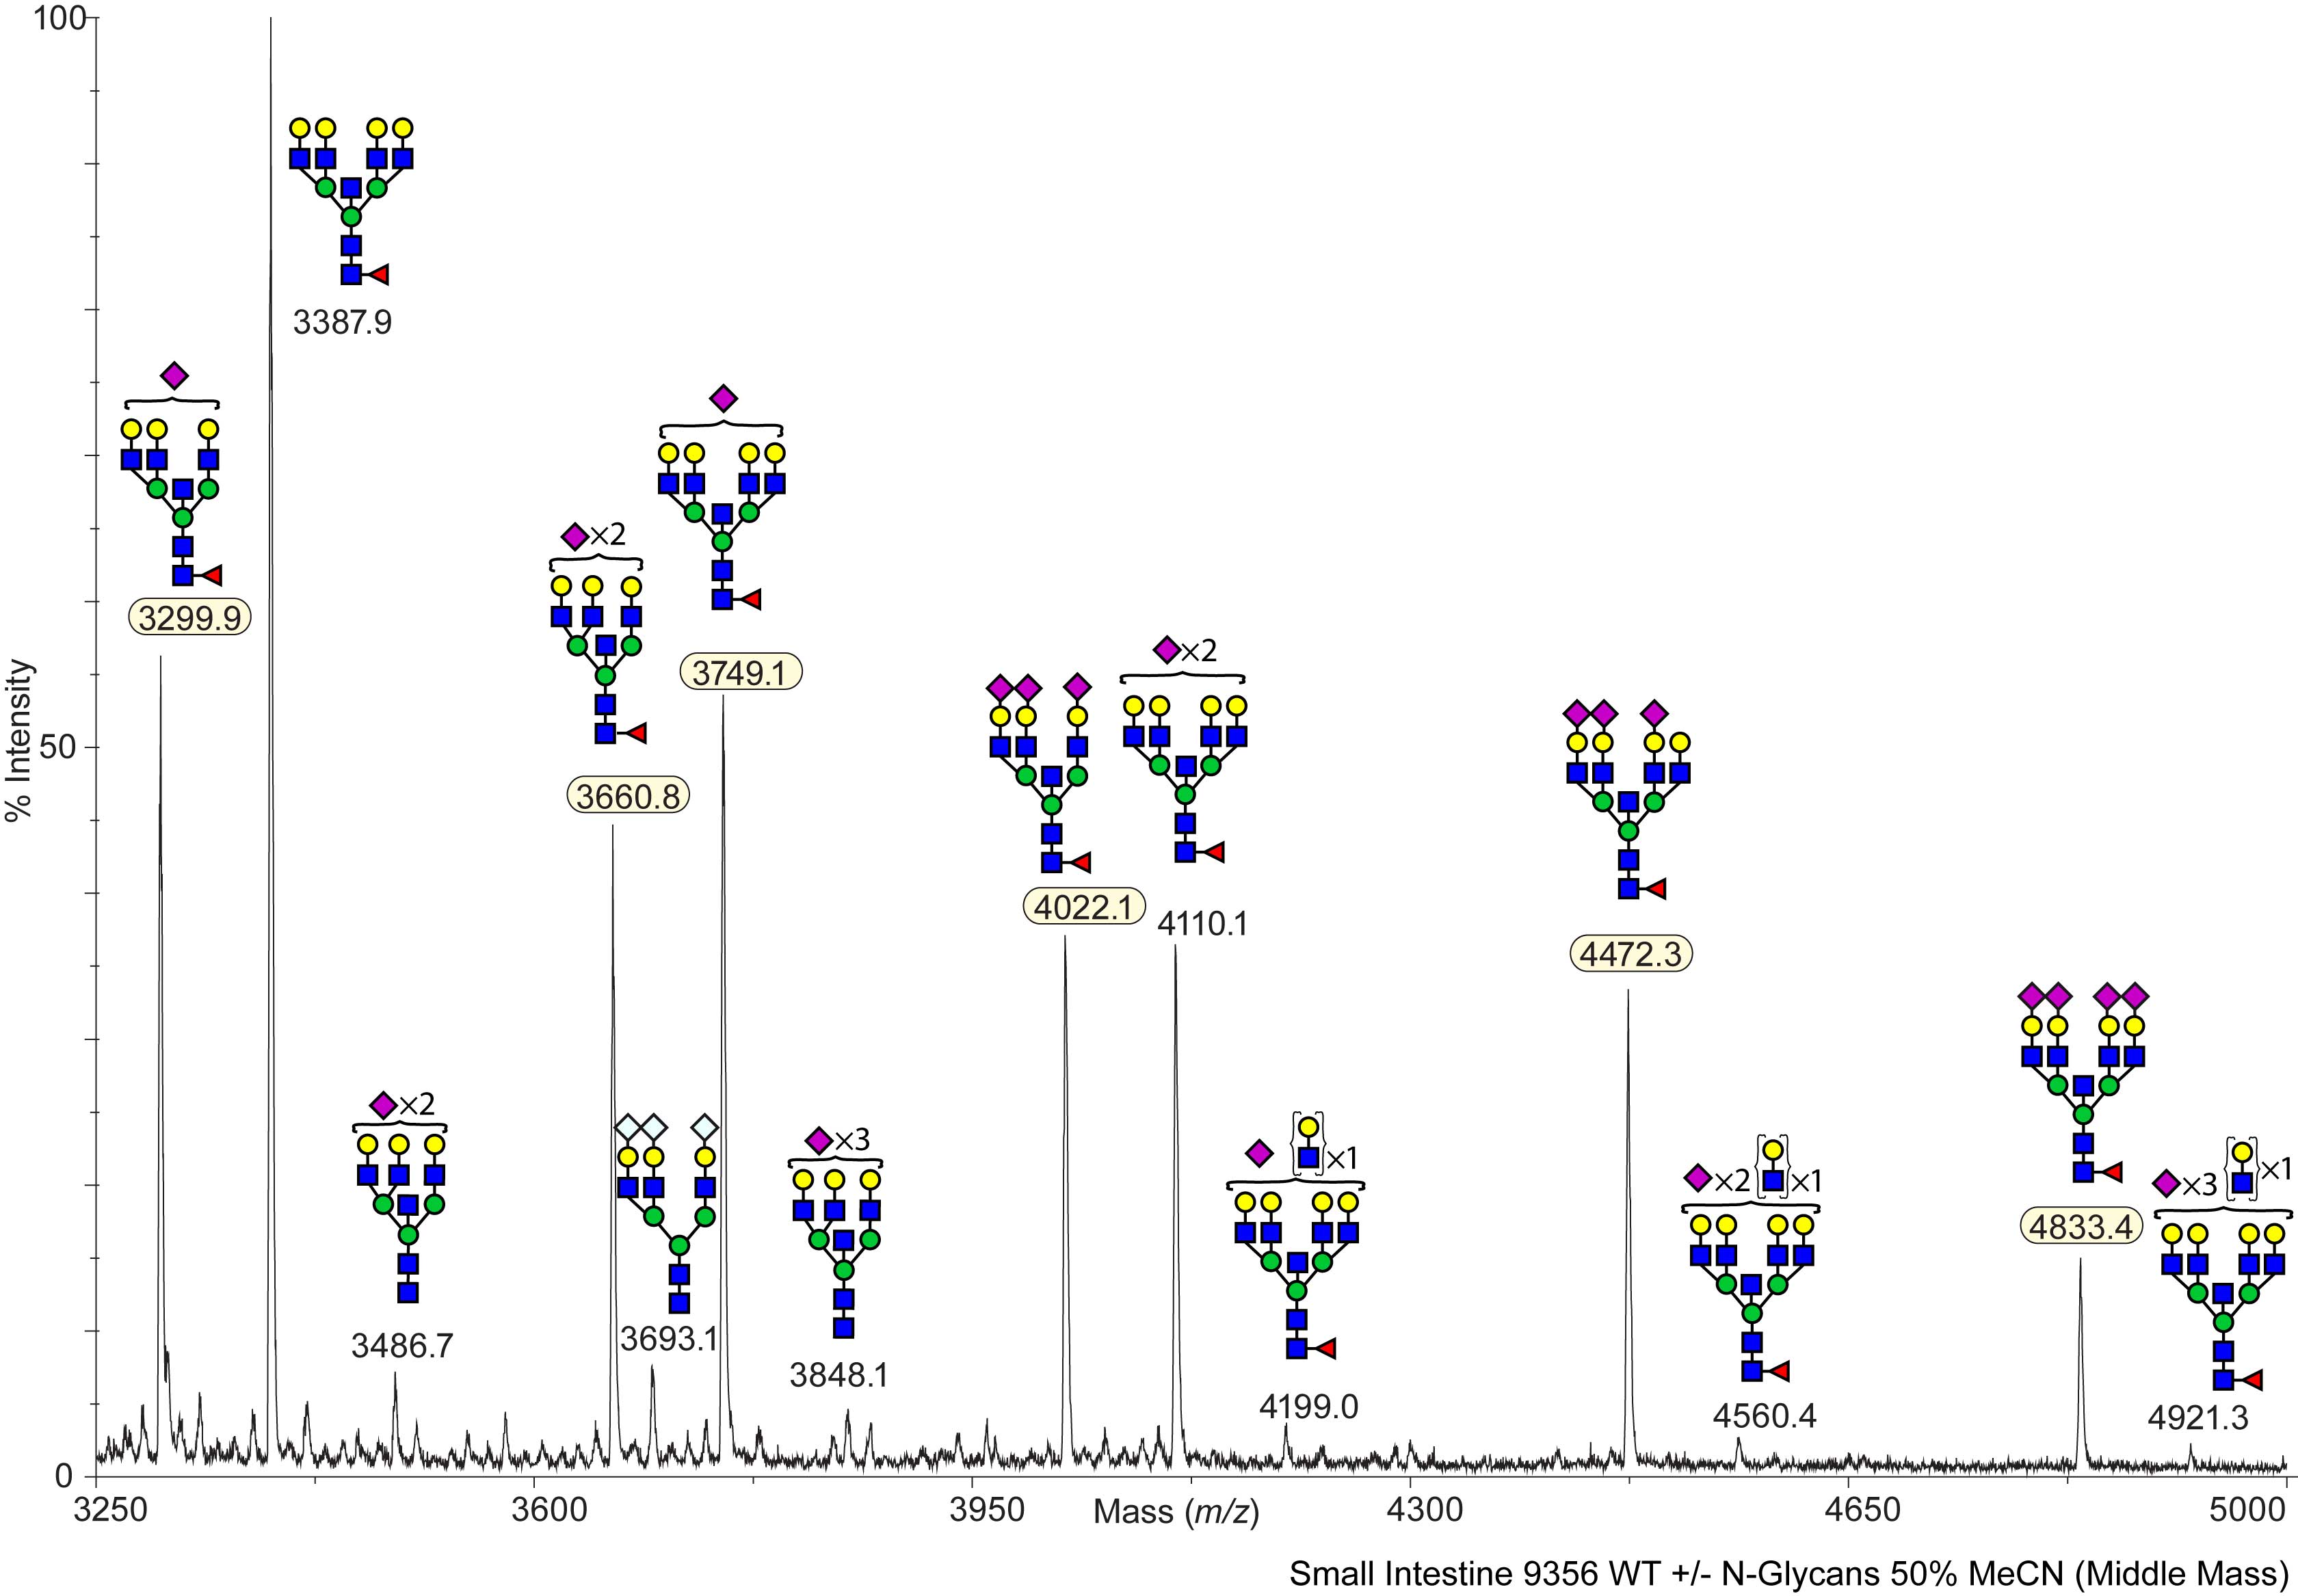
GP Mouse Galgt-1(-/-)/Galgt-2(-/-) Small Intestine Small Intestine B4galnt1(+/-)/B4galnt2(-/-), (GP), 9356, NG N-Linked C57BL/6 View experimental details      
Annotated file for lower mass range in JPG formatAnnotated file for higher mass range in JPG format Annotated file for lower mass range in PDF formatAnnotated file for higher mass range in PDF format
View Mass Spectrum data as text View Mass Peak file   Interactive Mass Spectrum Viewer
cfg_rRequest_2118
GP Mouse Galgt-1(-/-)/Galgt-2(-/-) Small Intestine Small Intestine B4galnt1(+/-)/B4galnt2(-/-), (GP), 9356, OG O-Linked C57BL/6 View experimental details      
Annotated file in JPG format Annotated file in PDF format
View Mass Spectrum data as text View Mass Peak file   Interactive Mass Spectrum Viewer
cfg_rRequest_2118
GP Mouse Galgt-1(-/-)/Galgt-2(-/-) Small Intestine Small Intestine B4galnt1(+/-)/B4galnt2(-/-), (GP), 9356, PGL Polar Glycolipids C57BL/6 View experimental details      
Annotated file in JPG format Annotated file in PDF format
View Mass Spectrum data as text View Mass Peak file   Interactive Mass Spectrum Viewer
cfg_rRequest_2118
GP Mouse Galgt-1(-/-)/Galgt-2(-/-) Small Intestine Small Intestine B4galnt1(+/-)/B4galnt2(-/-), (GP), 9356, NPGL Non-Polar Glycolipids C57BL/6 View experimental details      
   
View Mass Spectrum data as text      
cfg_rRequest_2118
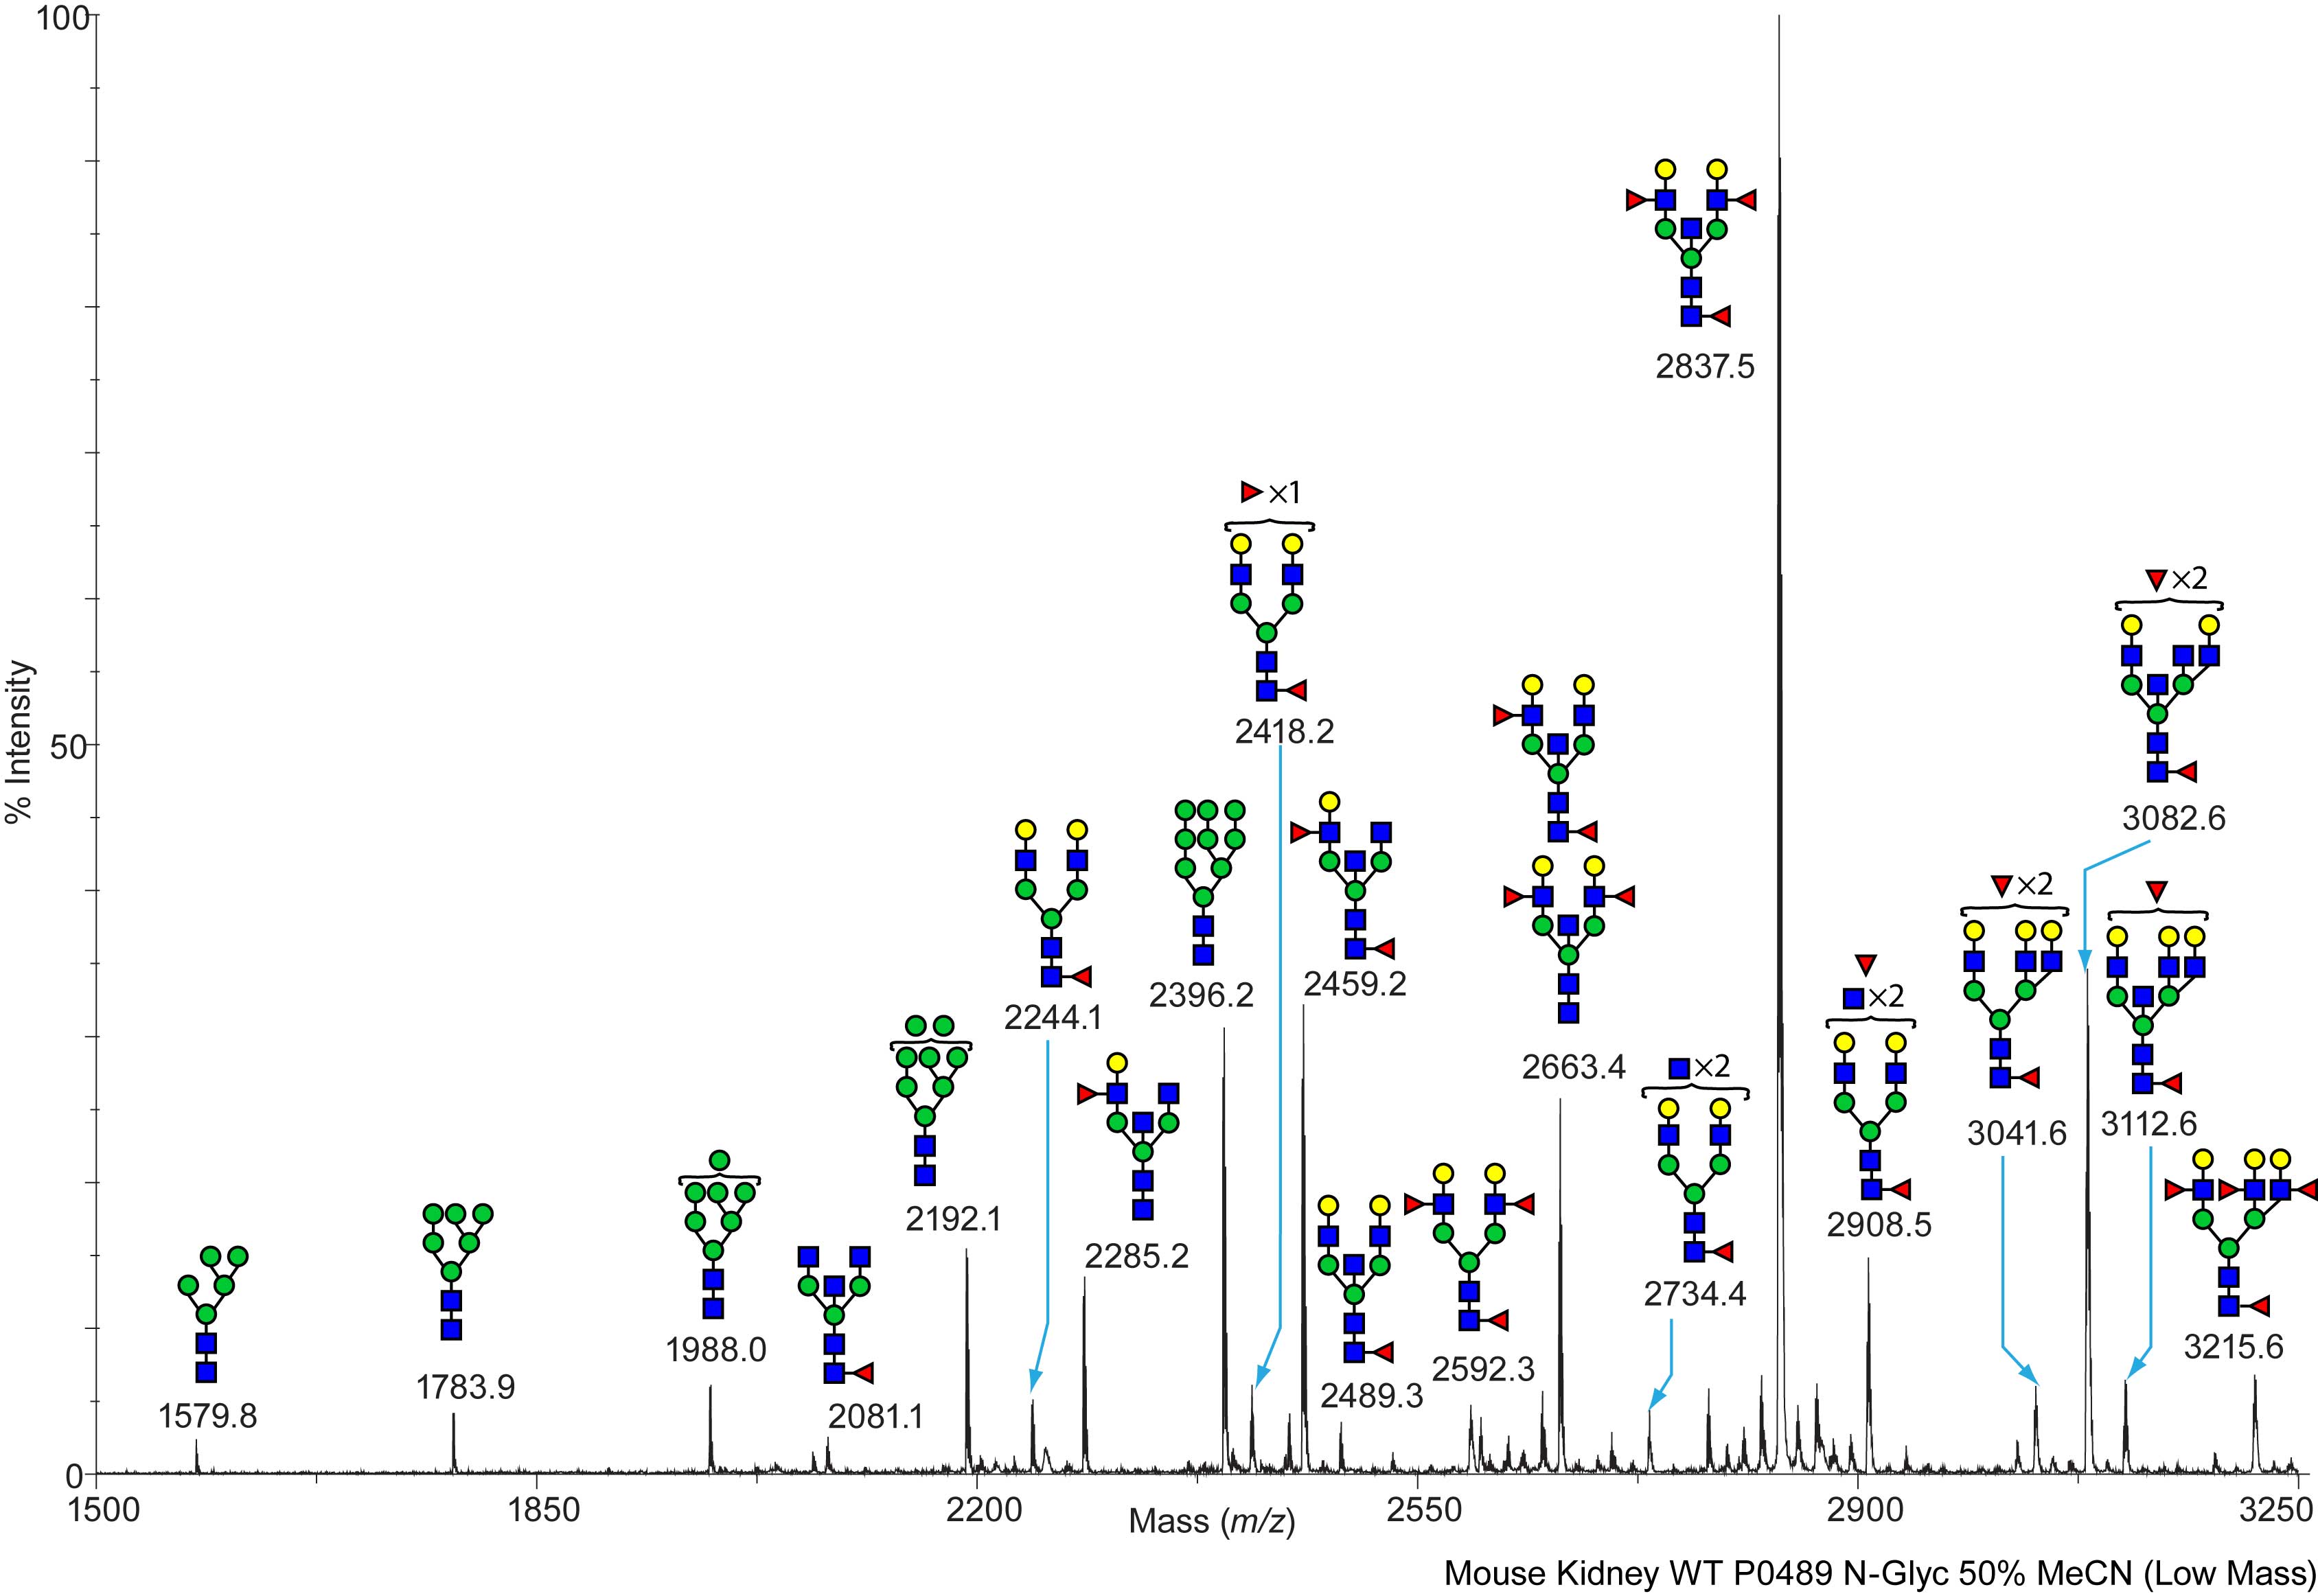
Mouse Wild Type Kidney Kidney ST6GalNAc-II WT (+/+), PO489, NG N-Linked C57BL/6 View experimental details      
Annotated file for lower mass range in JPG formatAnnotated file for higher mass range in JPG format Annotated file for lower mass range in PDF formatAnnotated file for higher mass range in PDF format
View Mass Spectrum data as text View Mass Peak file   Interactive Mass Spectrum Viewer
cfg_rRequest_2118
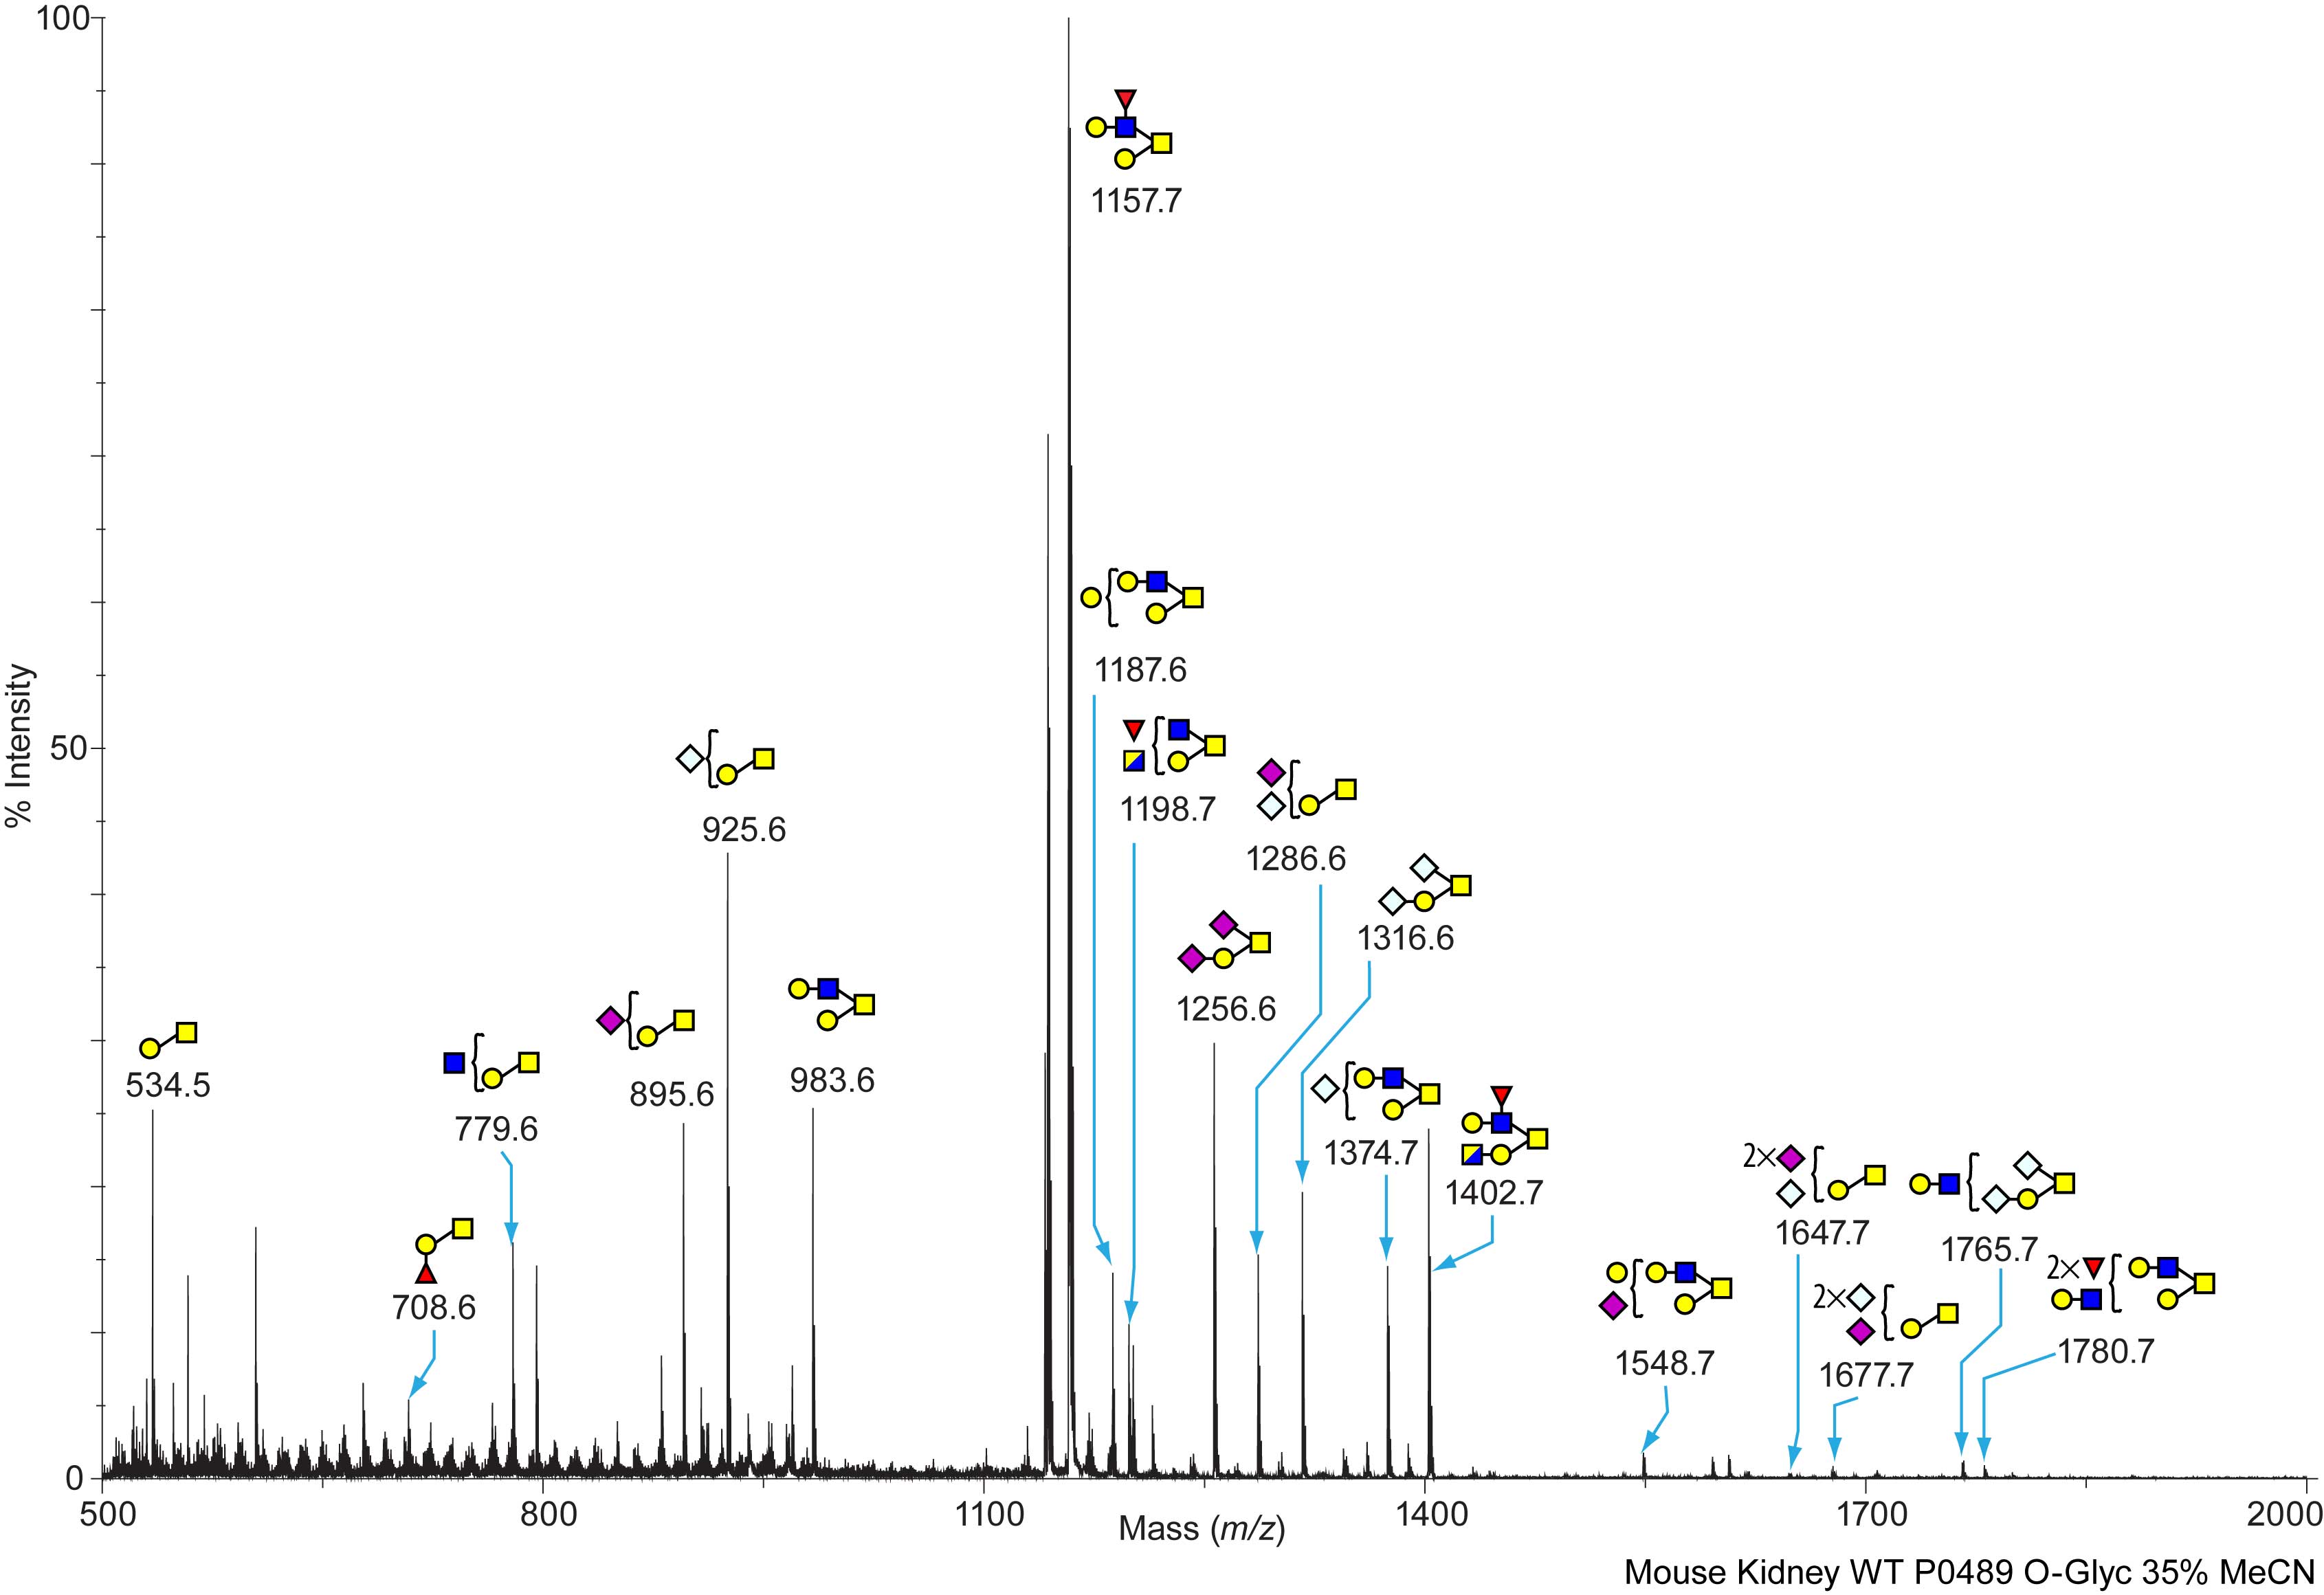
Mouse Wild Type Kidney Kidney ST6GalNAc-II WT (+/+), PO489, OG O-Linked C57BL/6 View experimental details      
Annotated file in JPG format Annotated file in PDF format
View Mass Spectrum data as text View Mass Peak file   Interactive Mass Spectrum Viewer
cfg_rRequest_2118
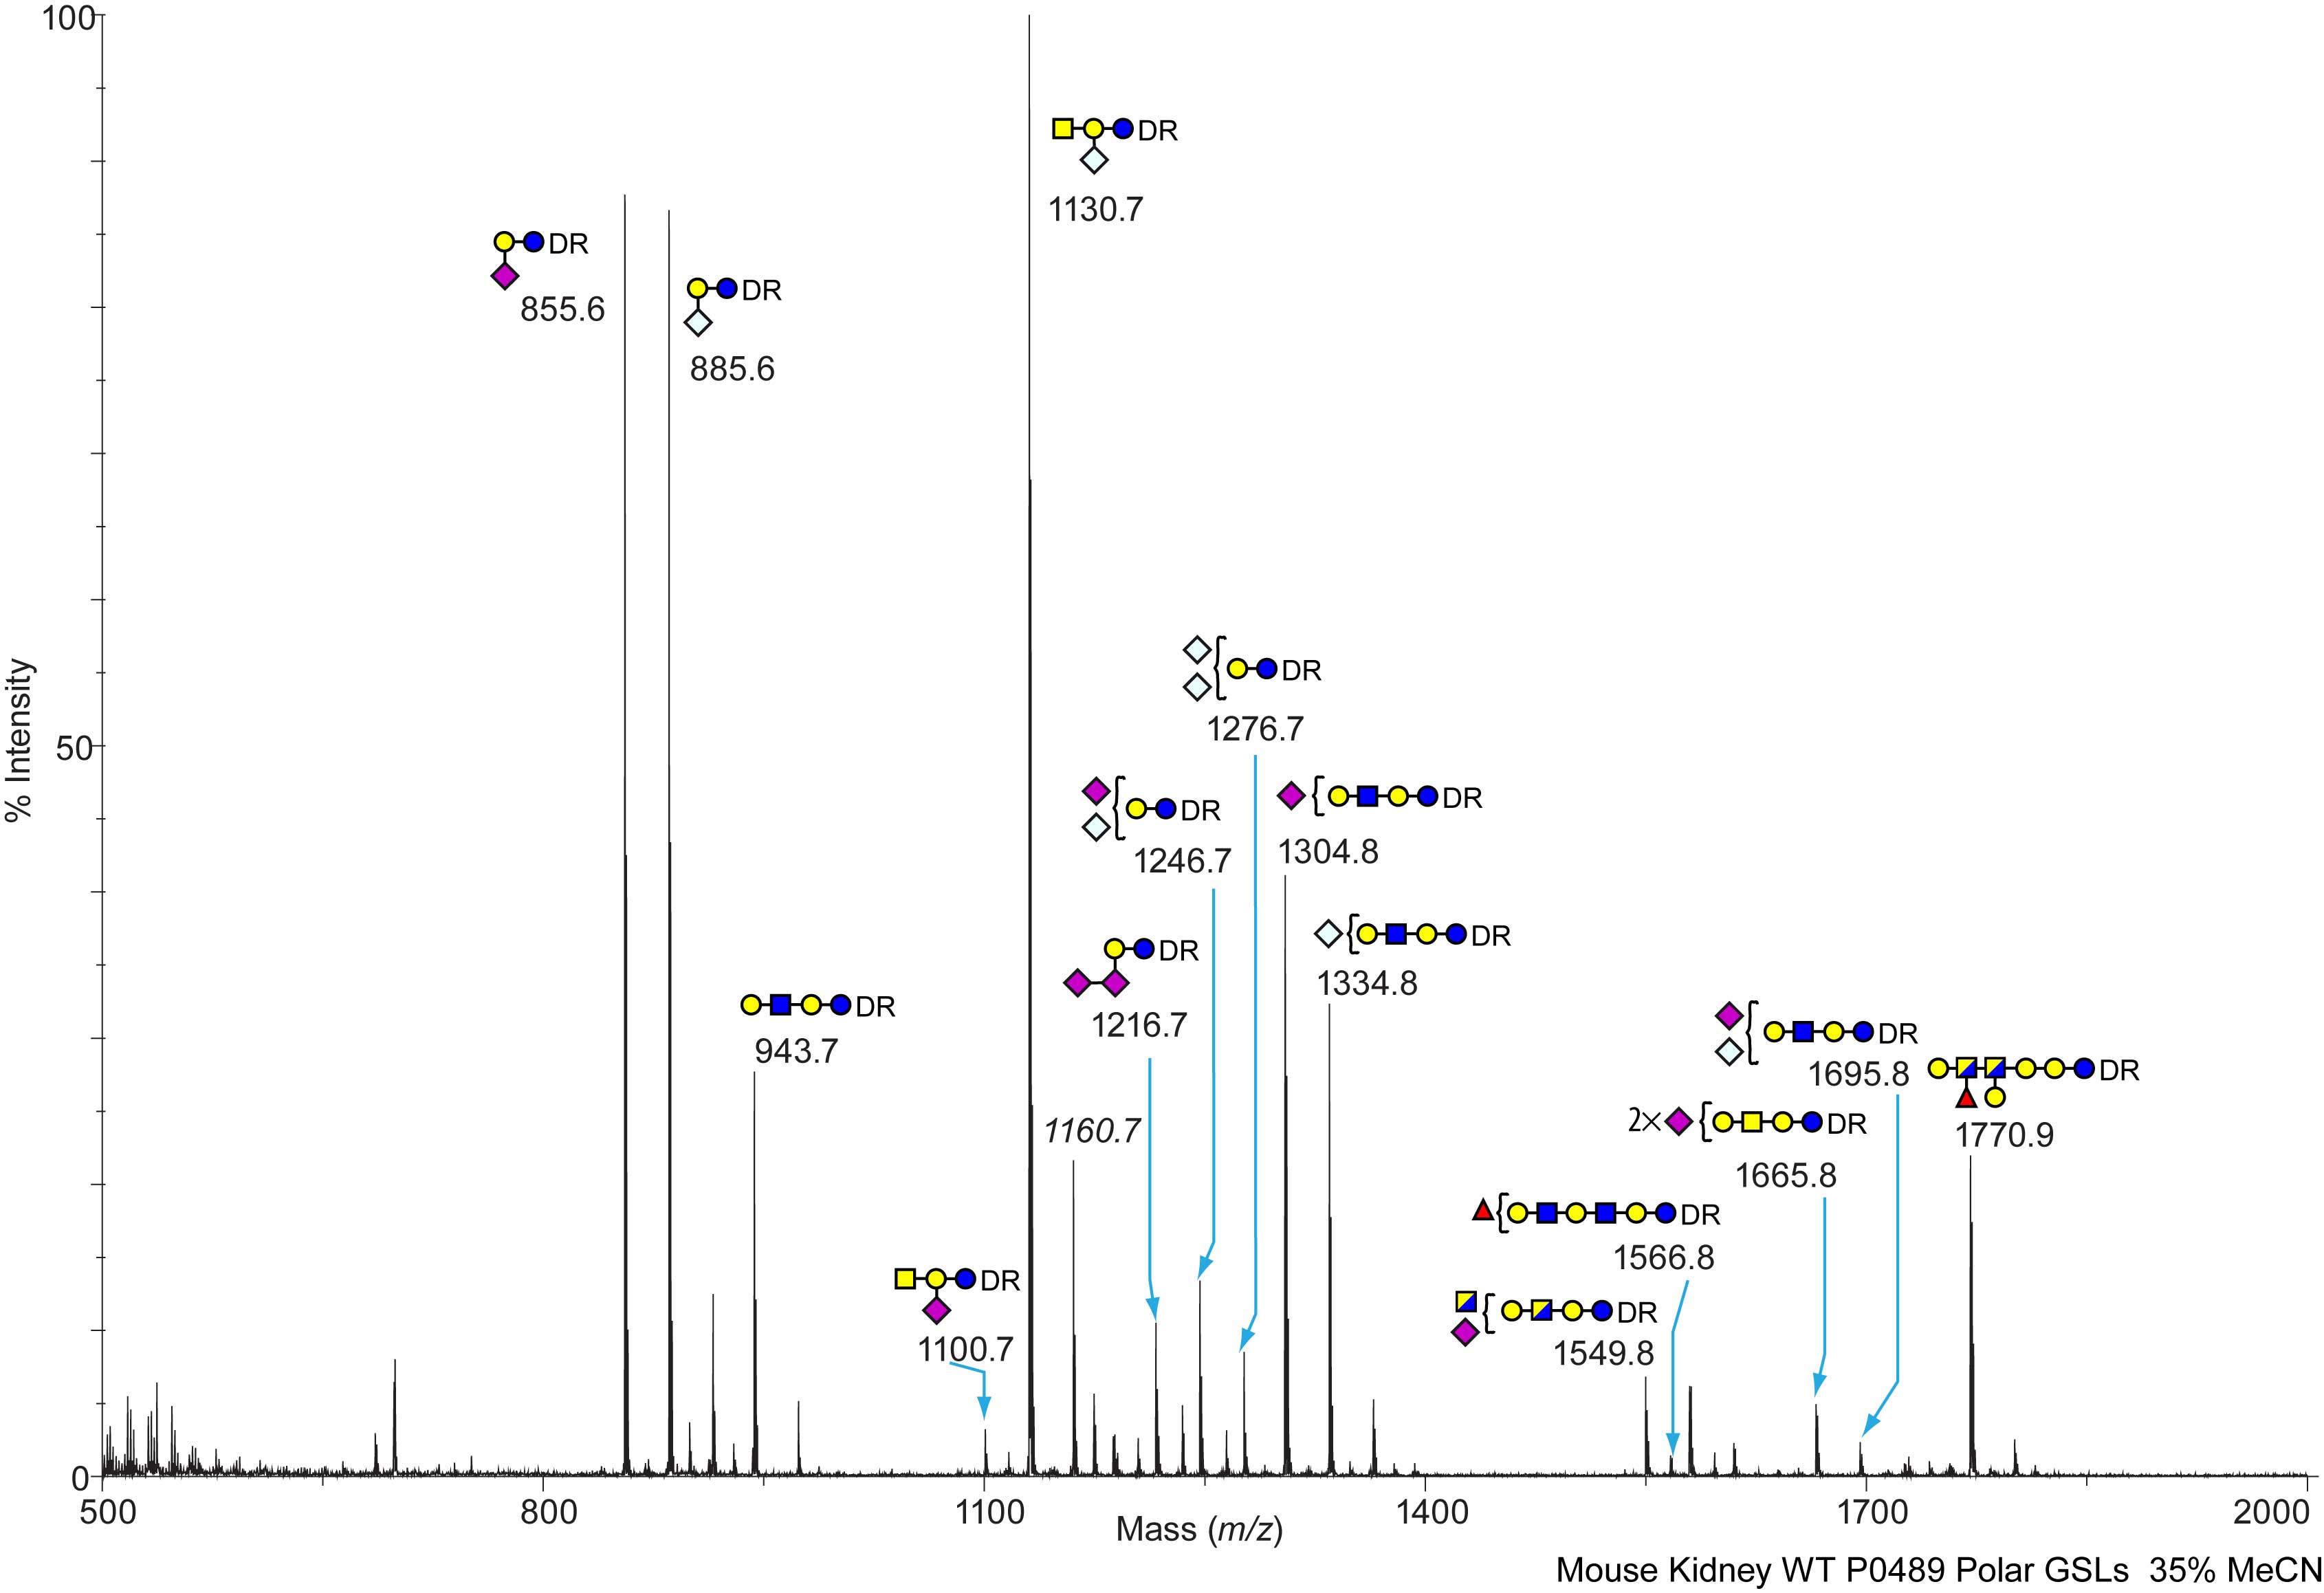
Mouse Wild Type Kidney Kidney ST6GalNAc-II WT (+/+), PO489, PGL Polar Glycolipids C57BL/6 View experimental details      
Annotated file in JPG format Annotated file in PDF format
View Mass Spectrum data as text View Mass Peak file   Interactive Mass Spectrum Viewer
cfg_rRequest_2118
Mouse Wild Type Kidney Kidney ST6GalNAc-II WT (+/+), PO489, NPGL Non-Polar Glycolipids C57BL/6 View experimental details      
   
View Mass Spectrum data as text      
cfg_rRequest_2118
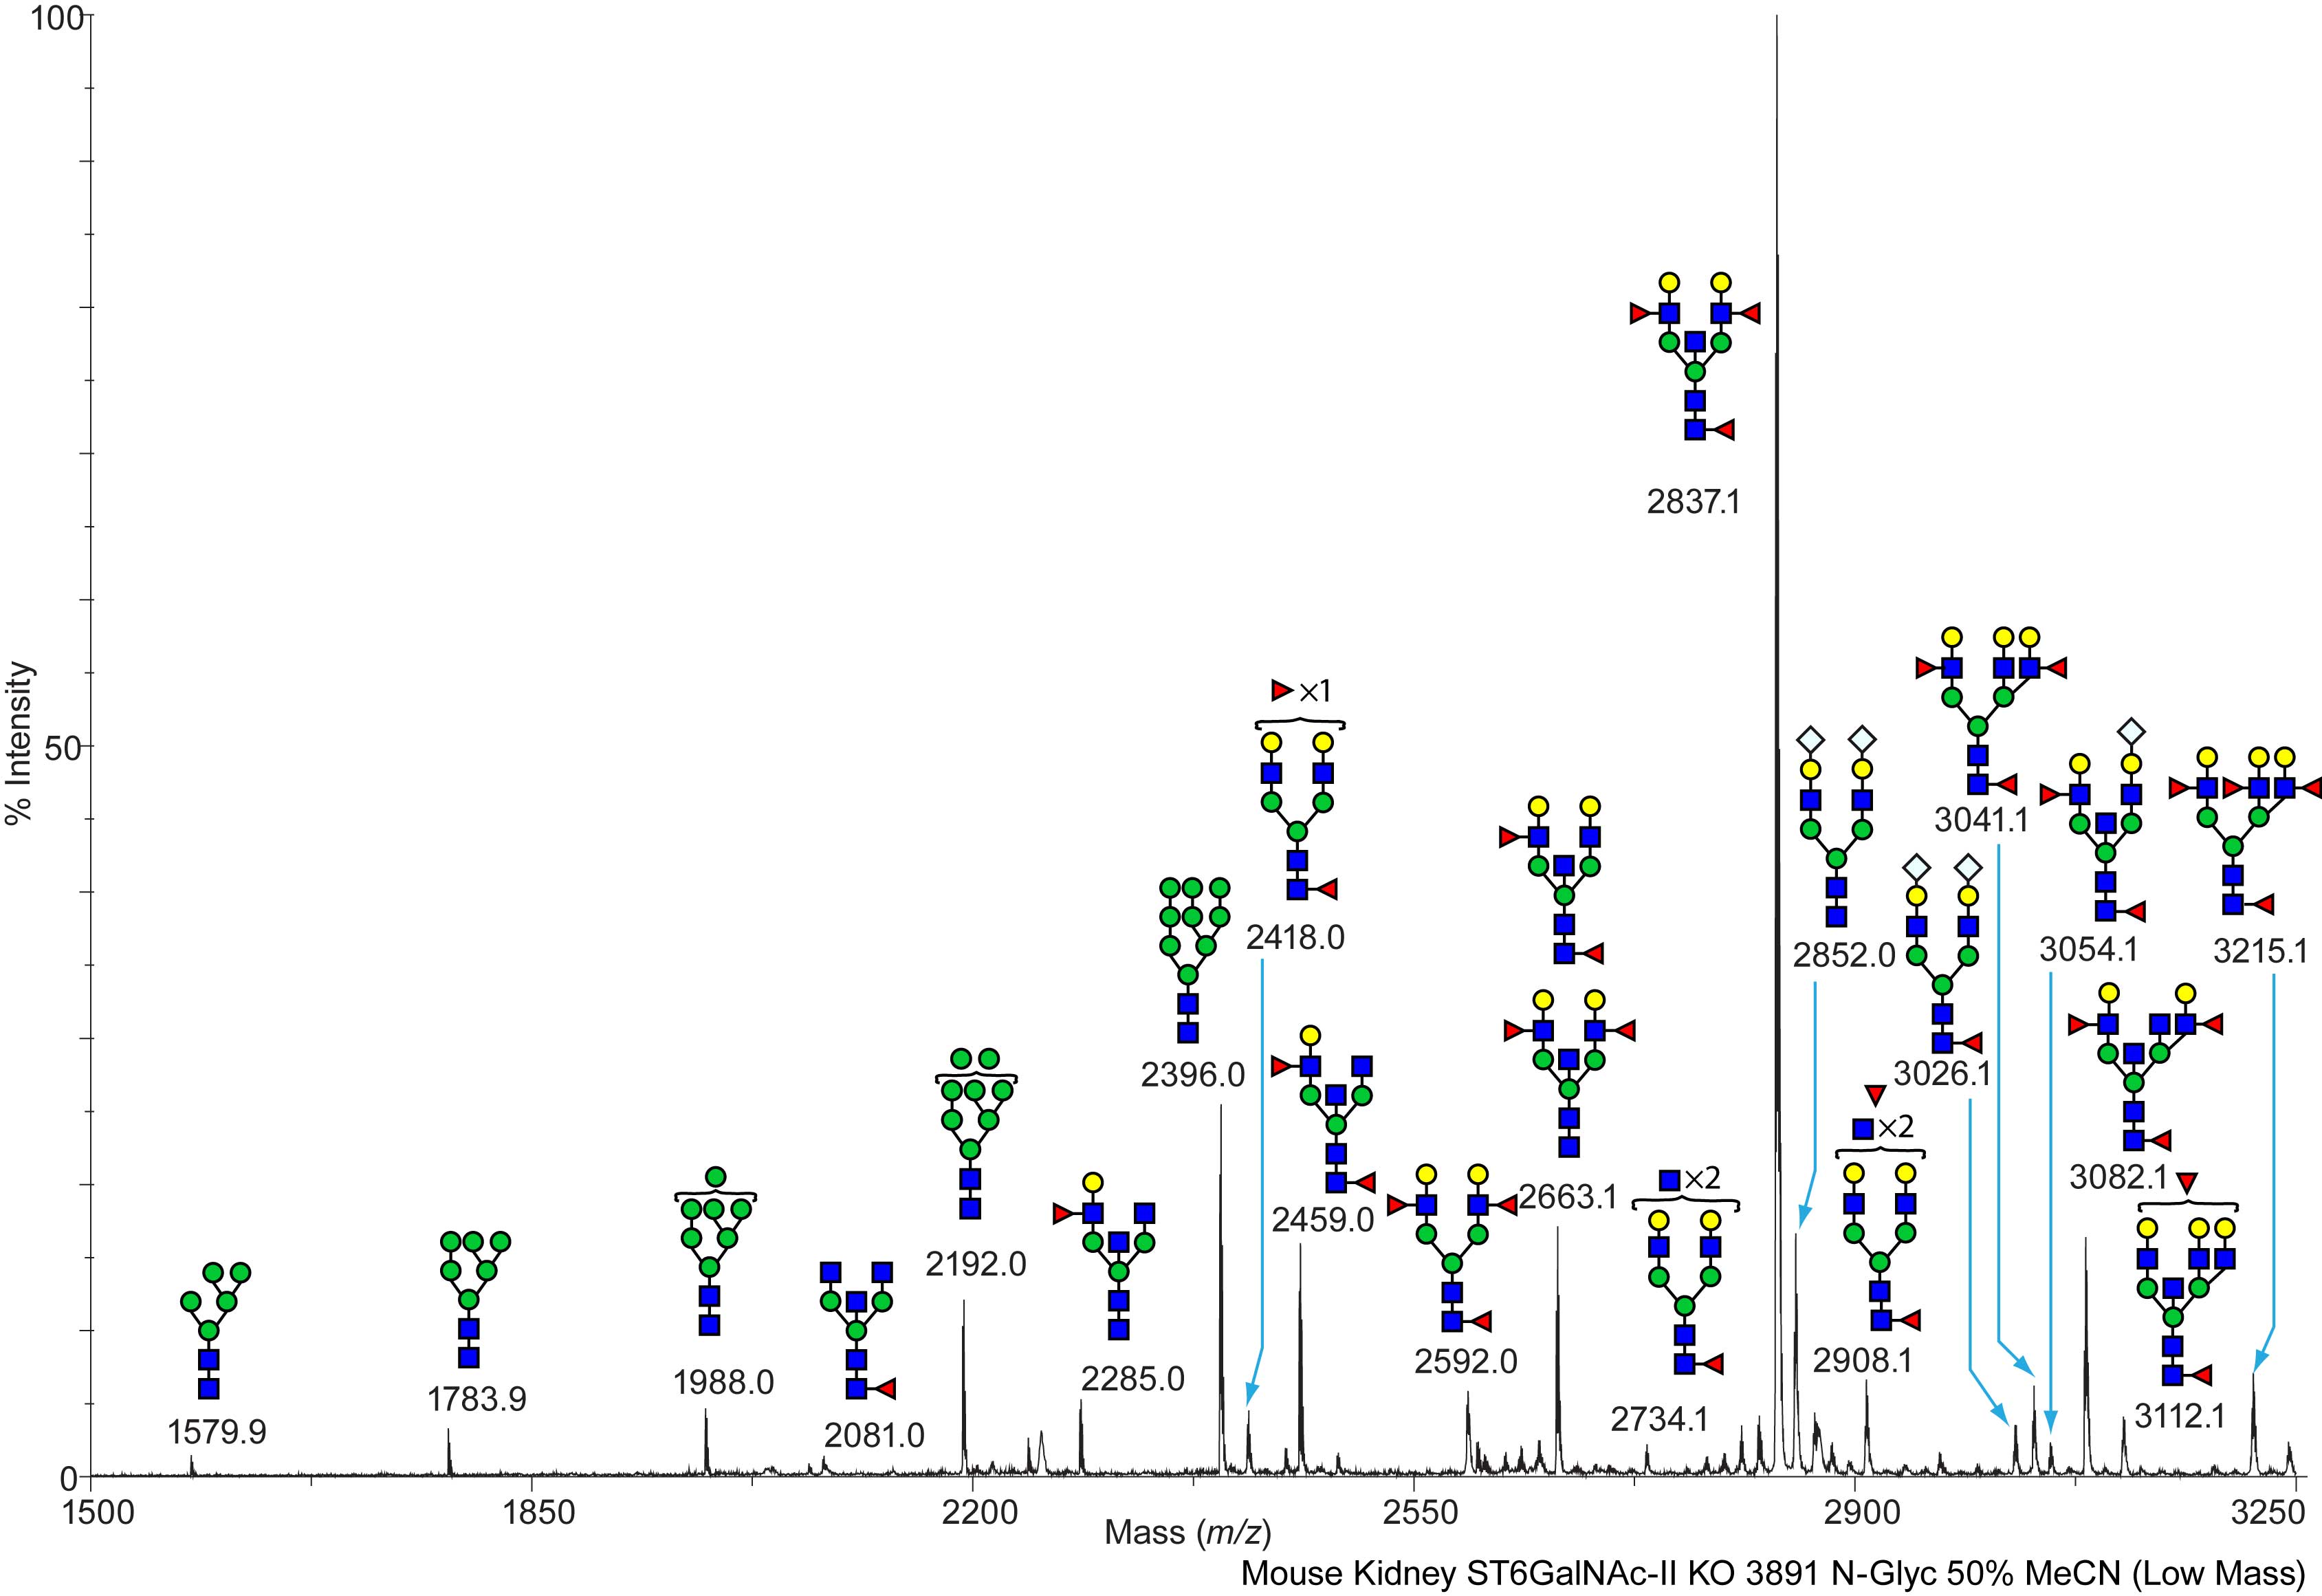
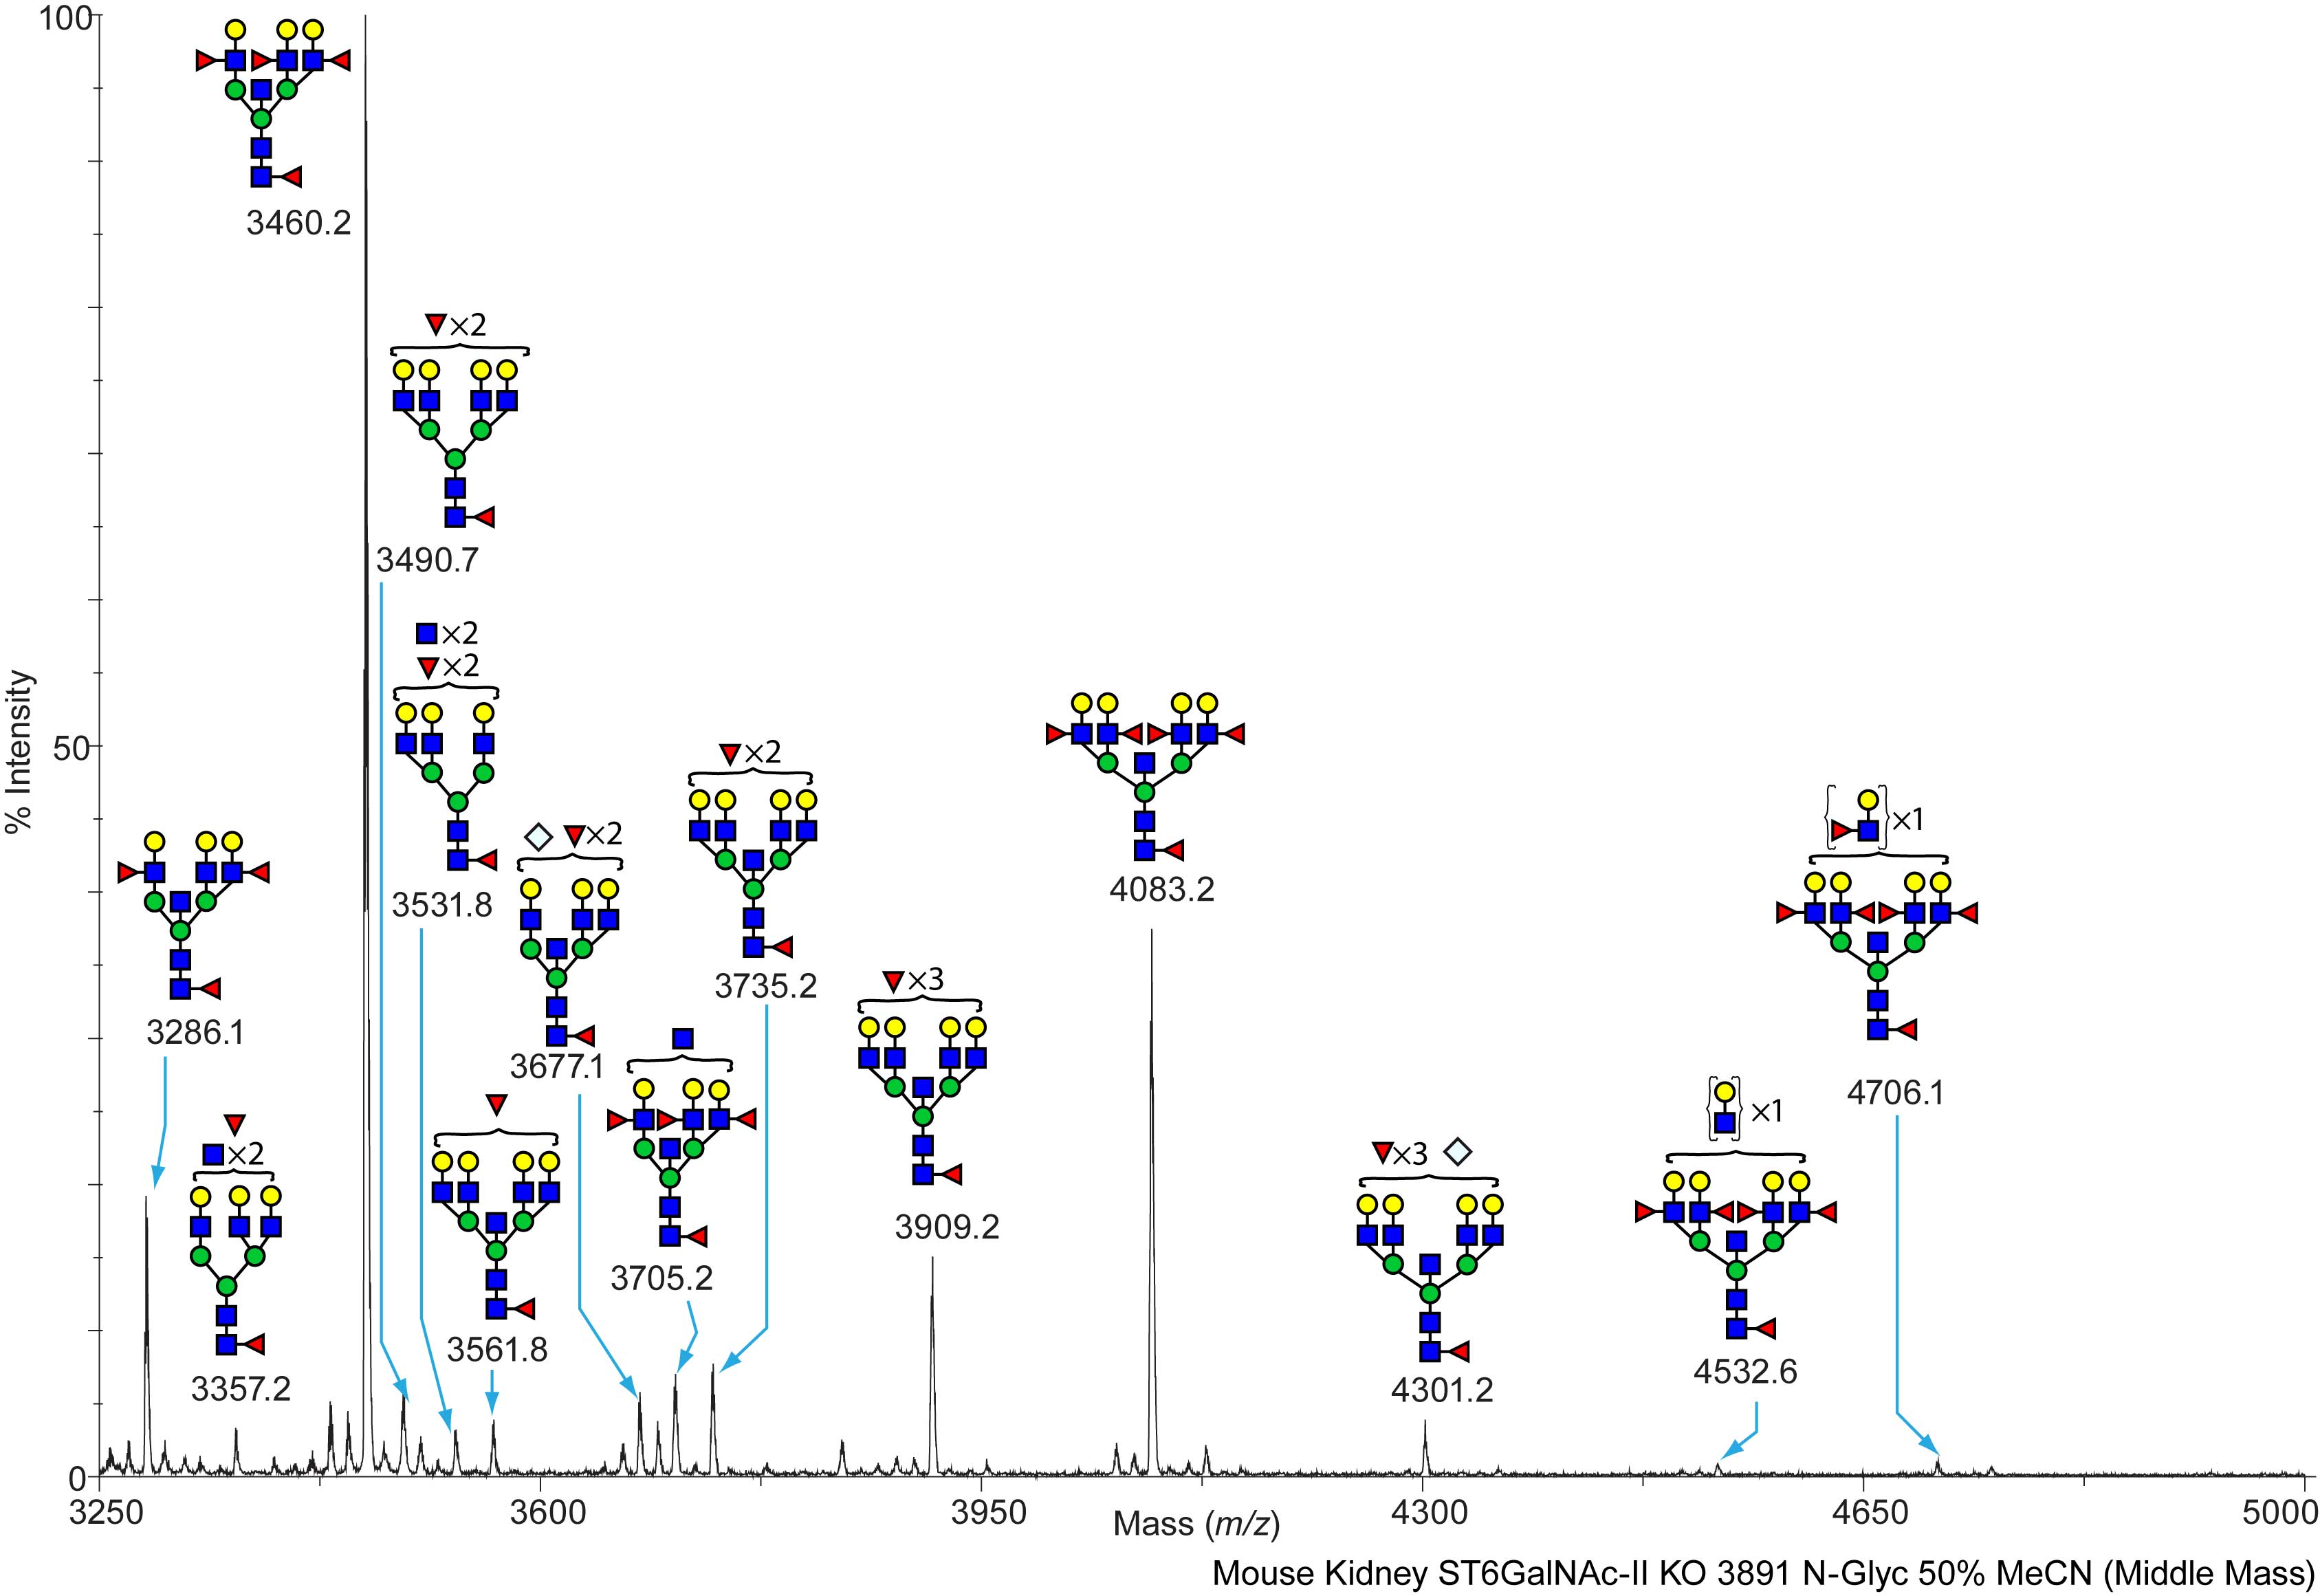
SS-D Mouse ST6GalNAc-II (-/-) Kidney Kidney ST6GalNAc-II KO (-/-), 3891, NG N-Linked C57BL/6 View experimental details      
Annotated file for lower mass range in JPG formatAnnotated file for higher mass range in JPG format Annotated file for lower mass range in PDF formatAnnotated file for higher mass range in PDF format
View Mass Spectrum data as text View Mass Peak file   Interactive Mass Spectrum Viewer
cfg_rRequest_2118
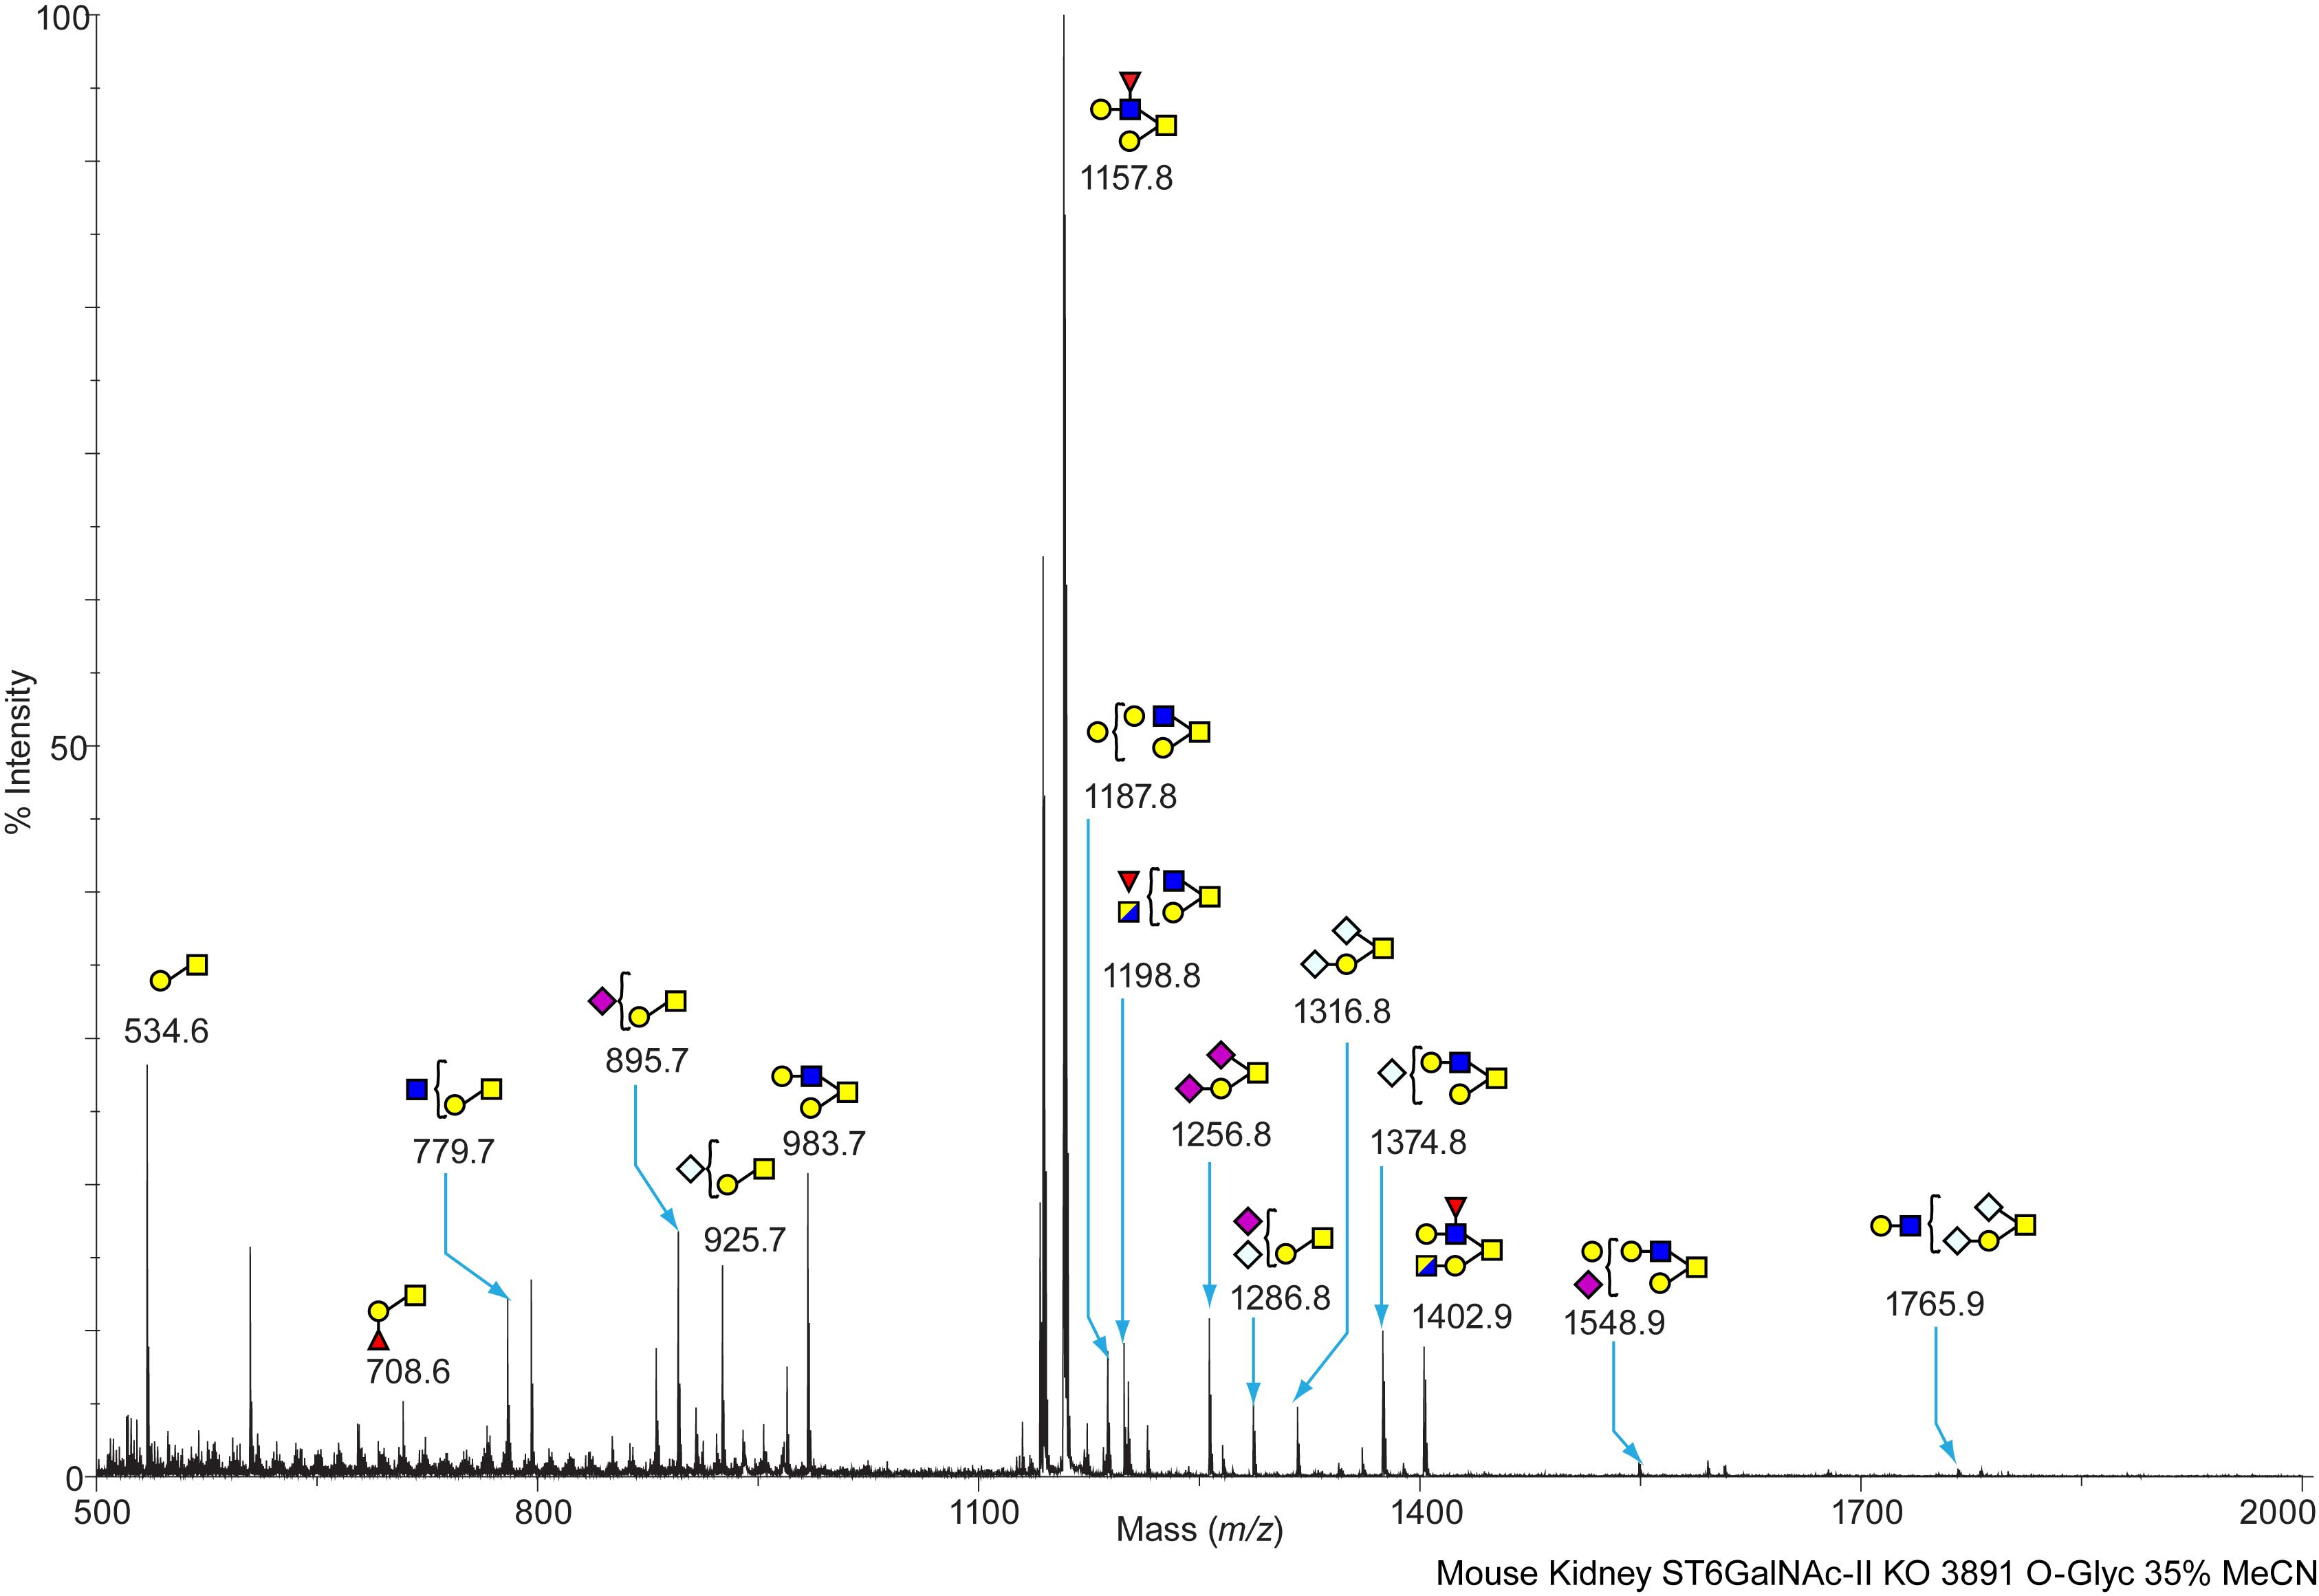
SS-D Mouse ST6GalNAc-II (-/-) Kidney Kidney ST6GalNAc-II WT KO (-/-), 3891, OG O-Linked C57BL/6 View experimental details      
Annotated file in JPG format Annotated file in PDF format
View Mass Spectrum data as text View Mass Peak file   Interactive Mass Spectrum Viewer
cfg_rRequest_2118
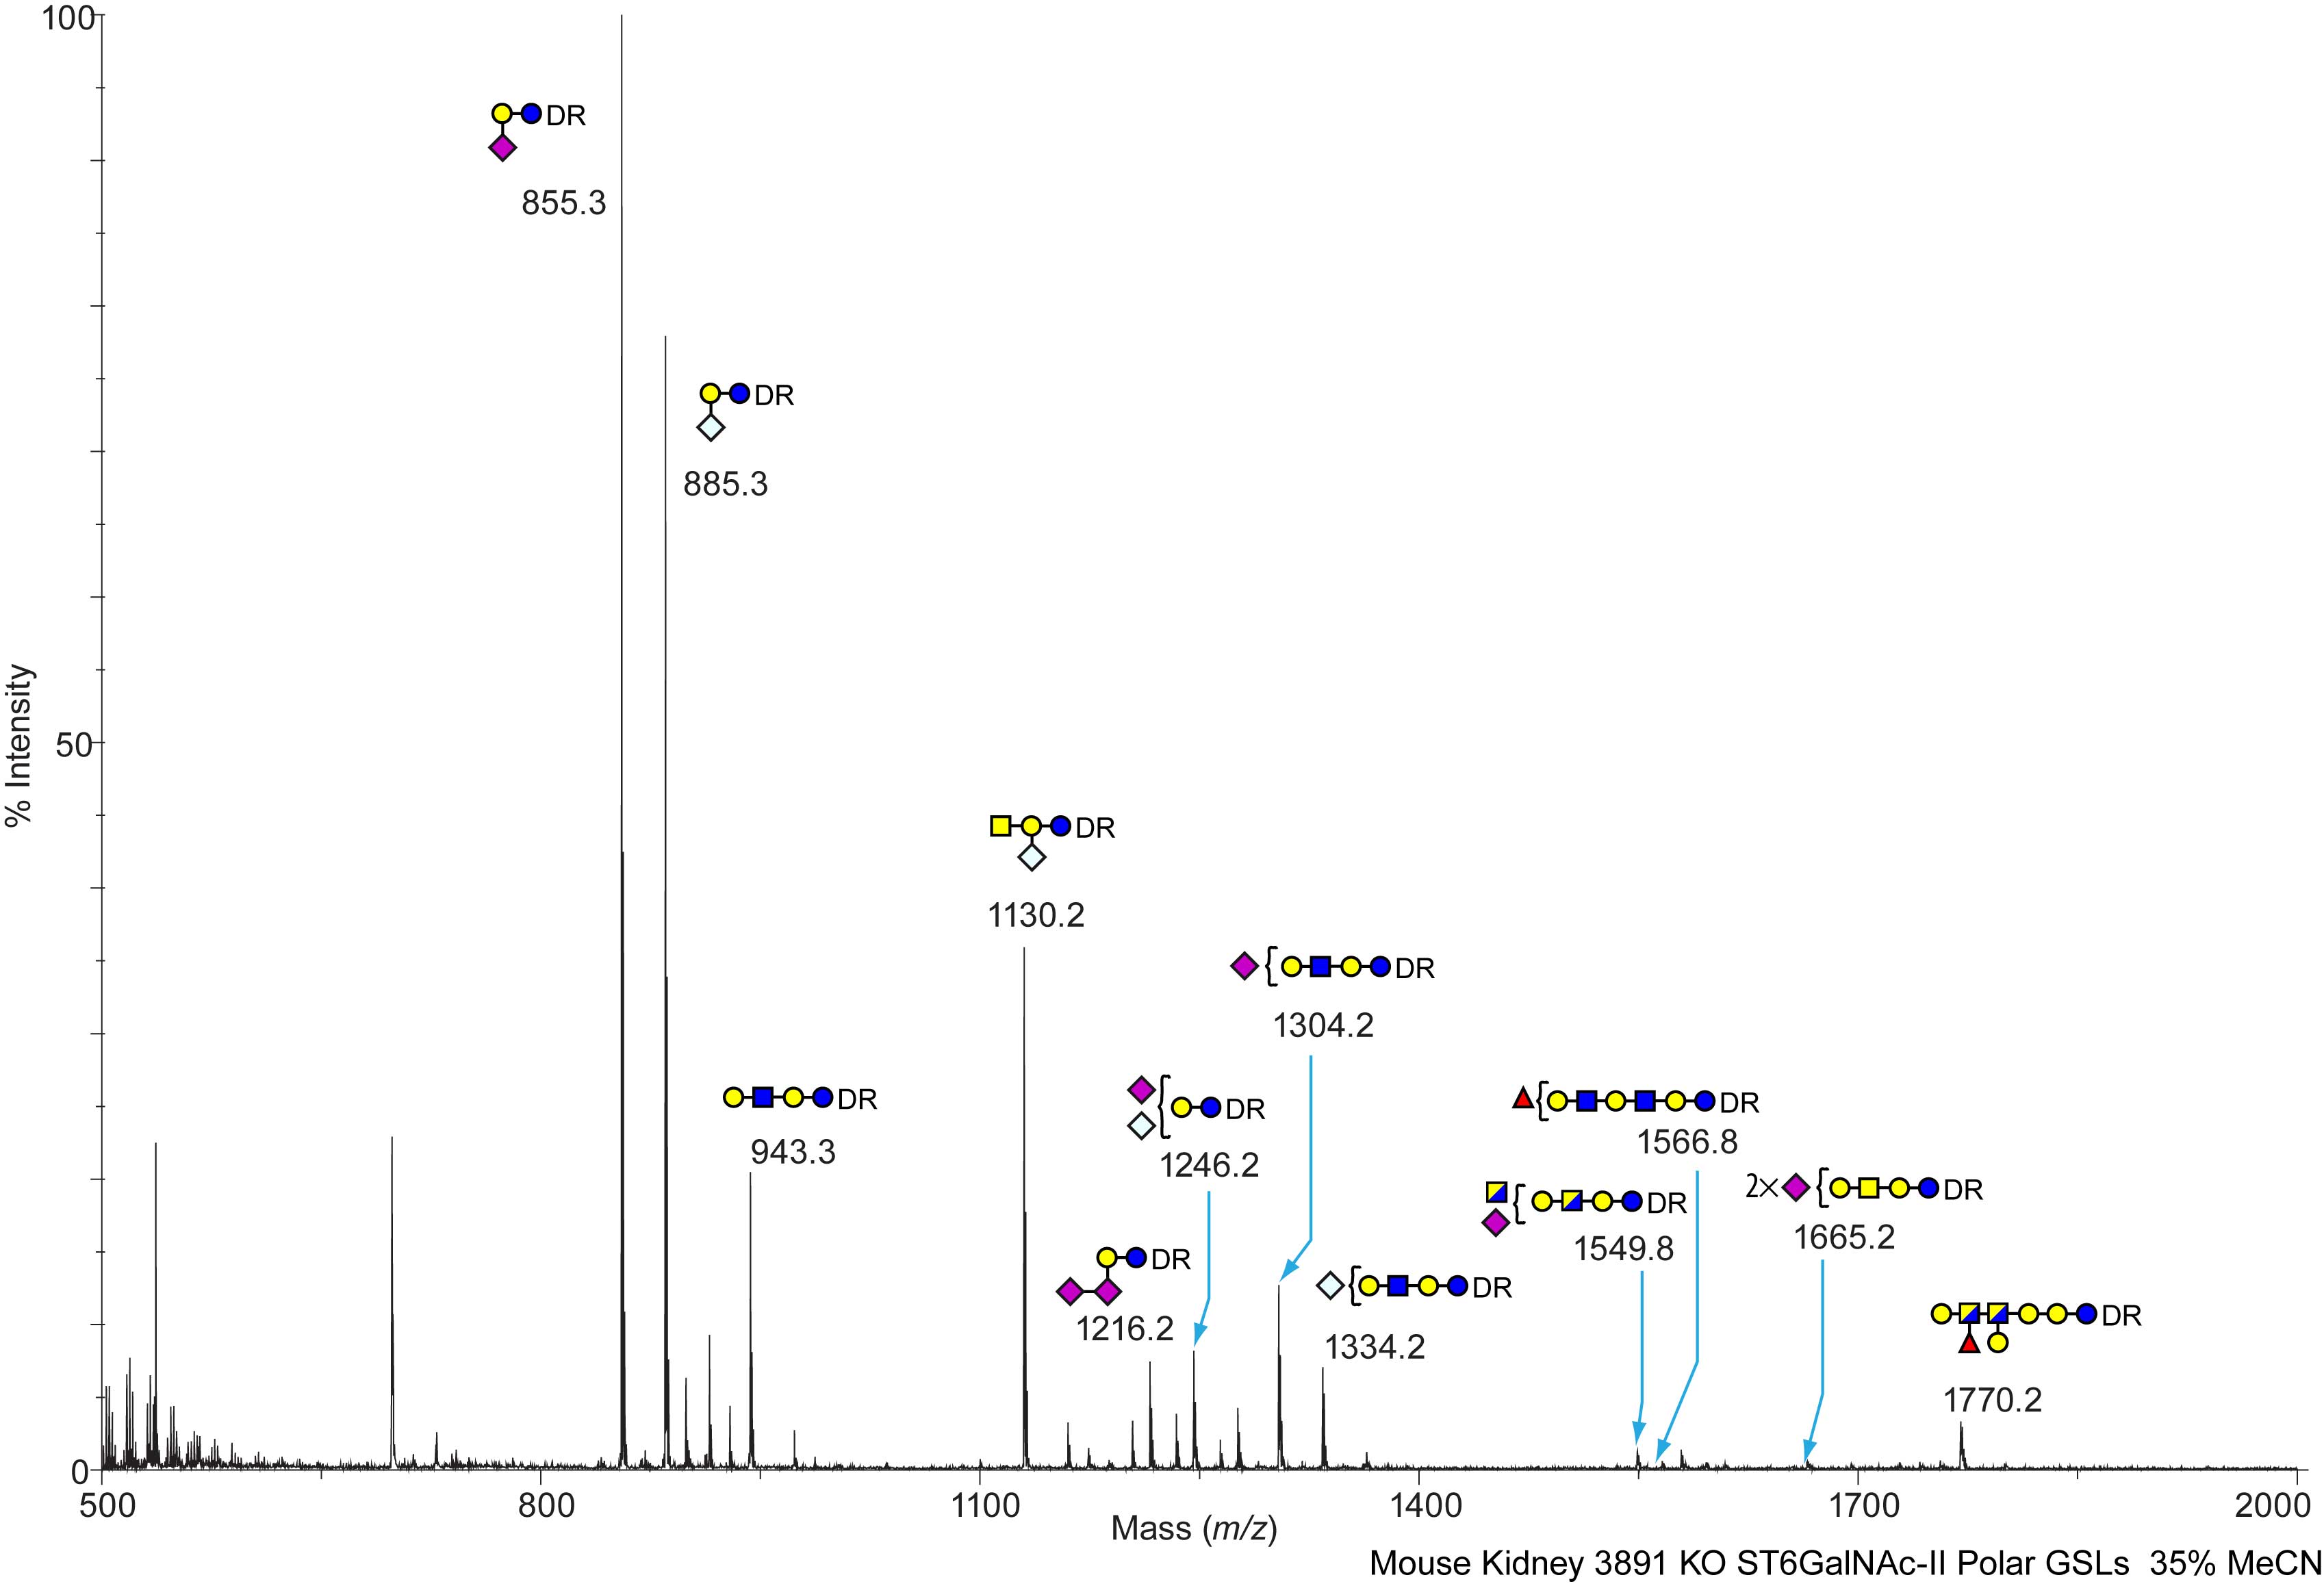
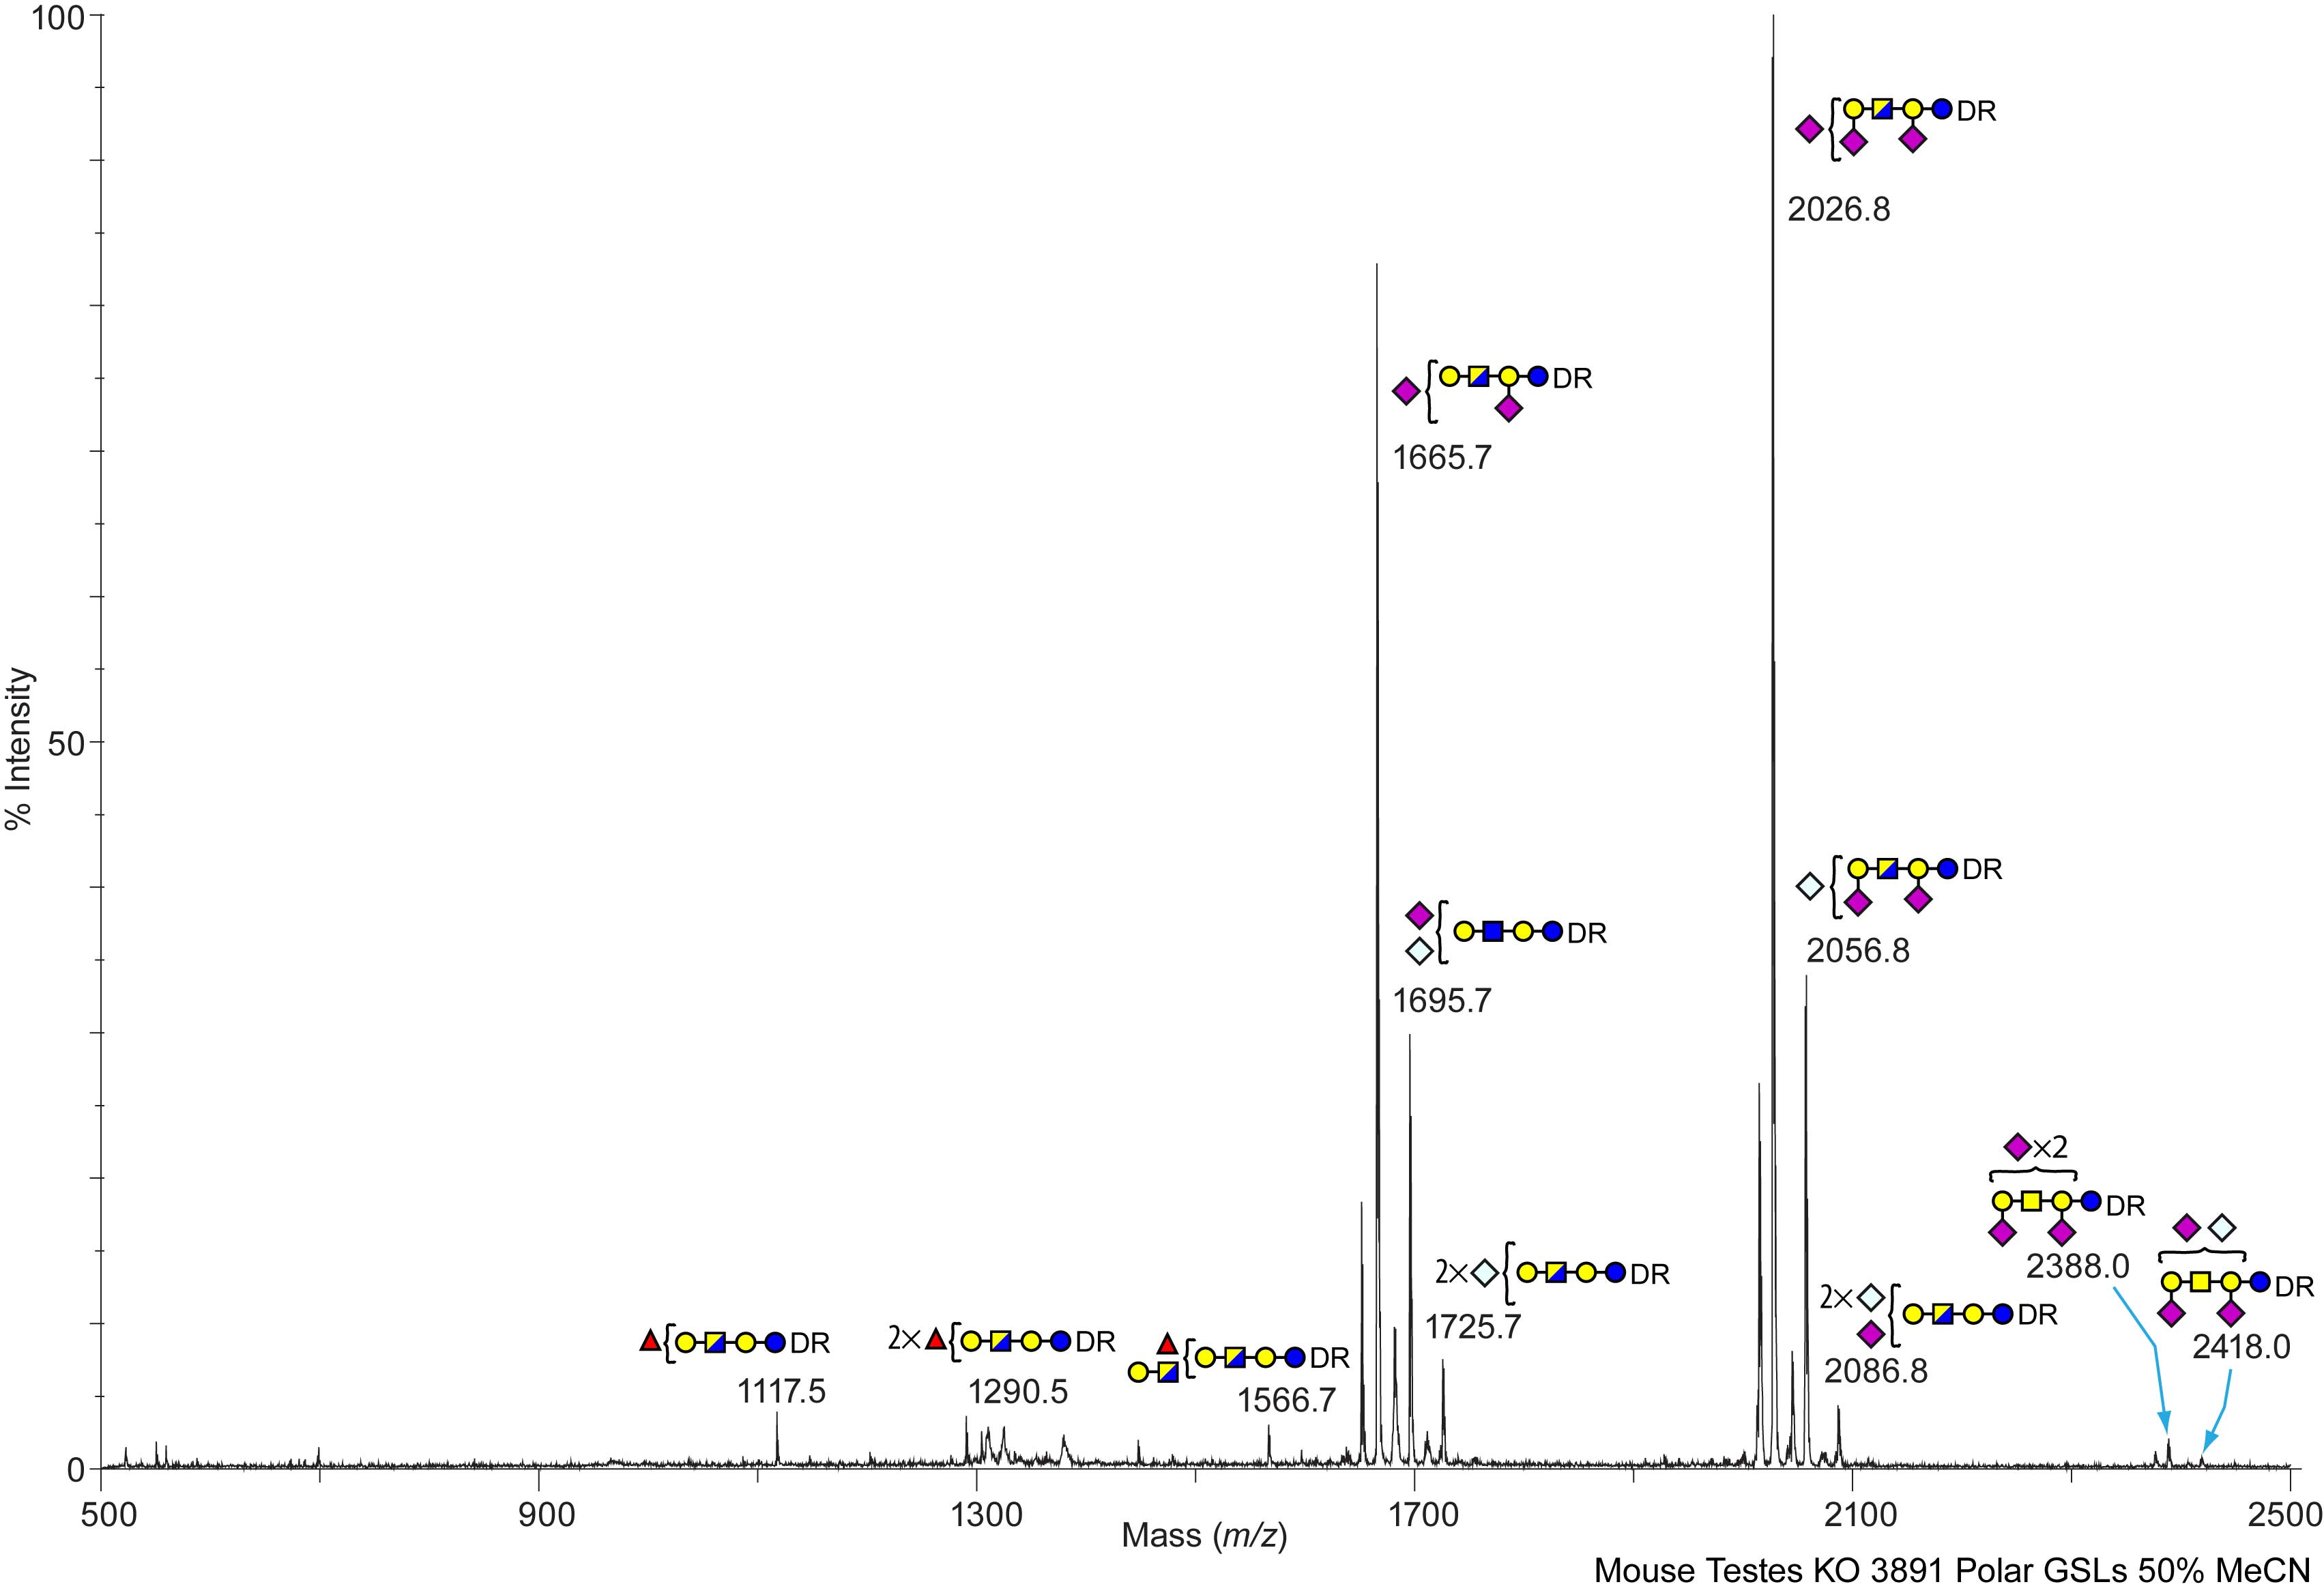
SS-D Mouse ST6GalNAc-II (-/-) Kidney Kidney ST6GalNAc-II KO (-/-), 3891, PGL Polar Glycolipids C57BL/6 View experimental details      
Annotated file in JPG format Annotated file in PDF format
View Mass Spectrum data as text View Mass Peak file   Interactive Mass Spectrum Viewer
cfg_rRequest_2118
SS-D Mouse ST6GalNAc-II (-/-) Kidney Kidney ST6GalNAc-II KO (-/-), 3891, NPGL Non-Polar Glycolipids C57BL/6 View experimental details      
   
View Mass Spectrum data as text      
cfg_rRequest_2118
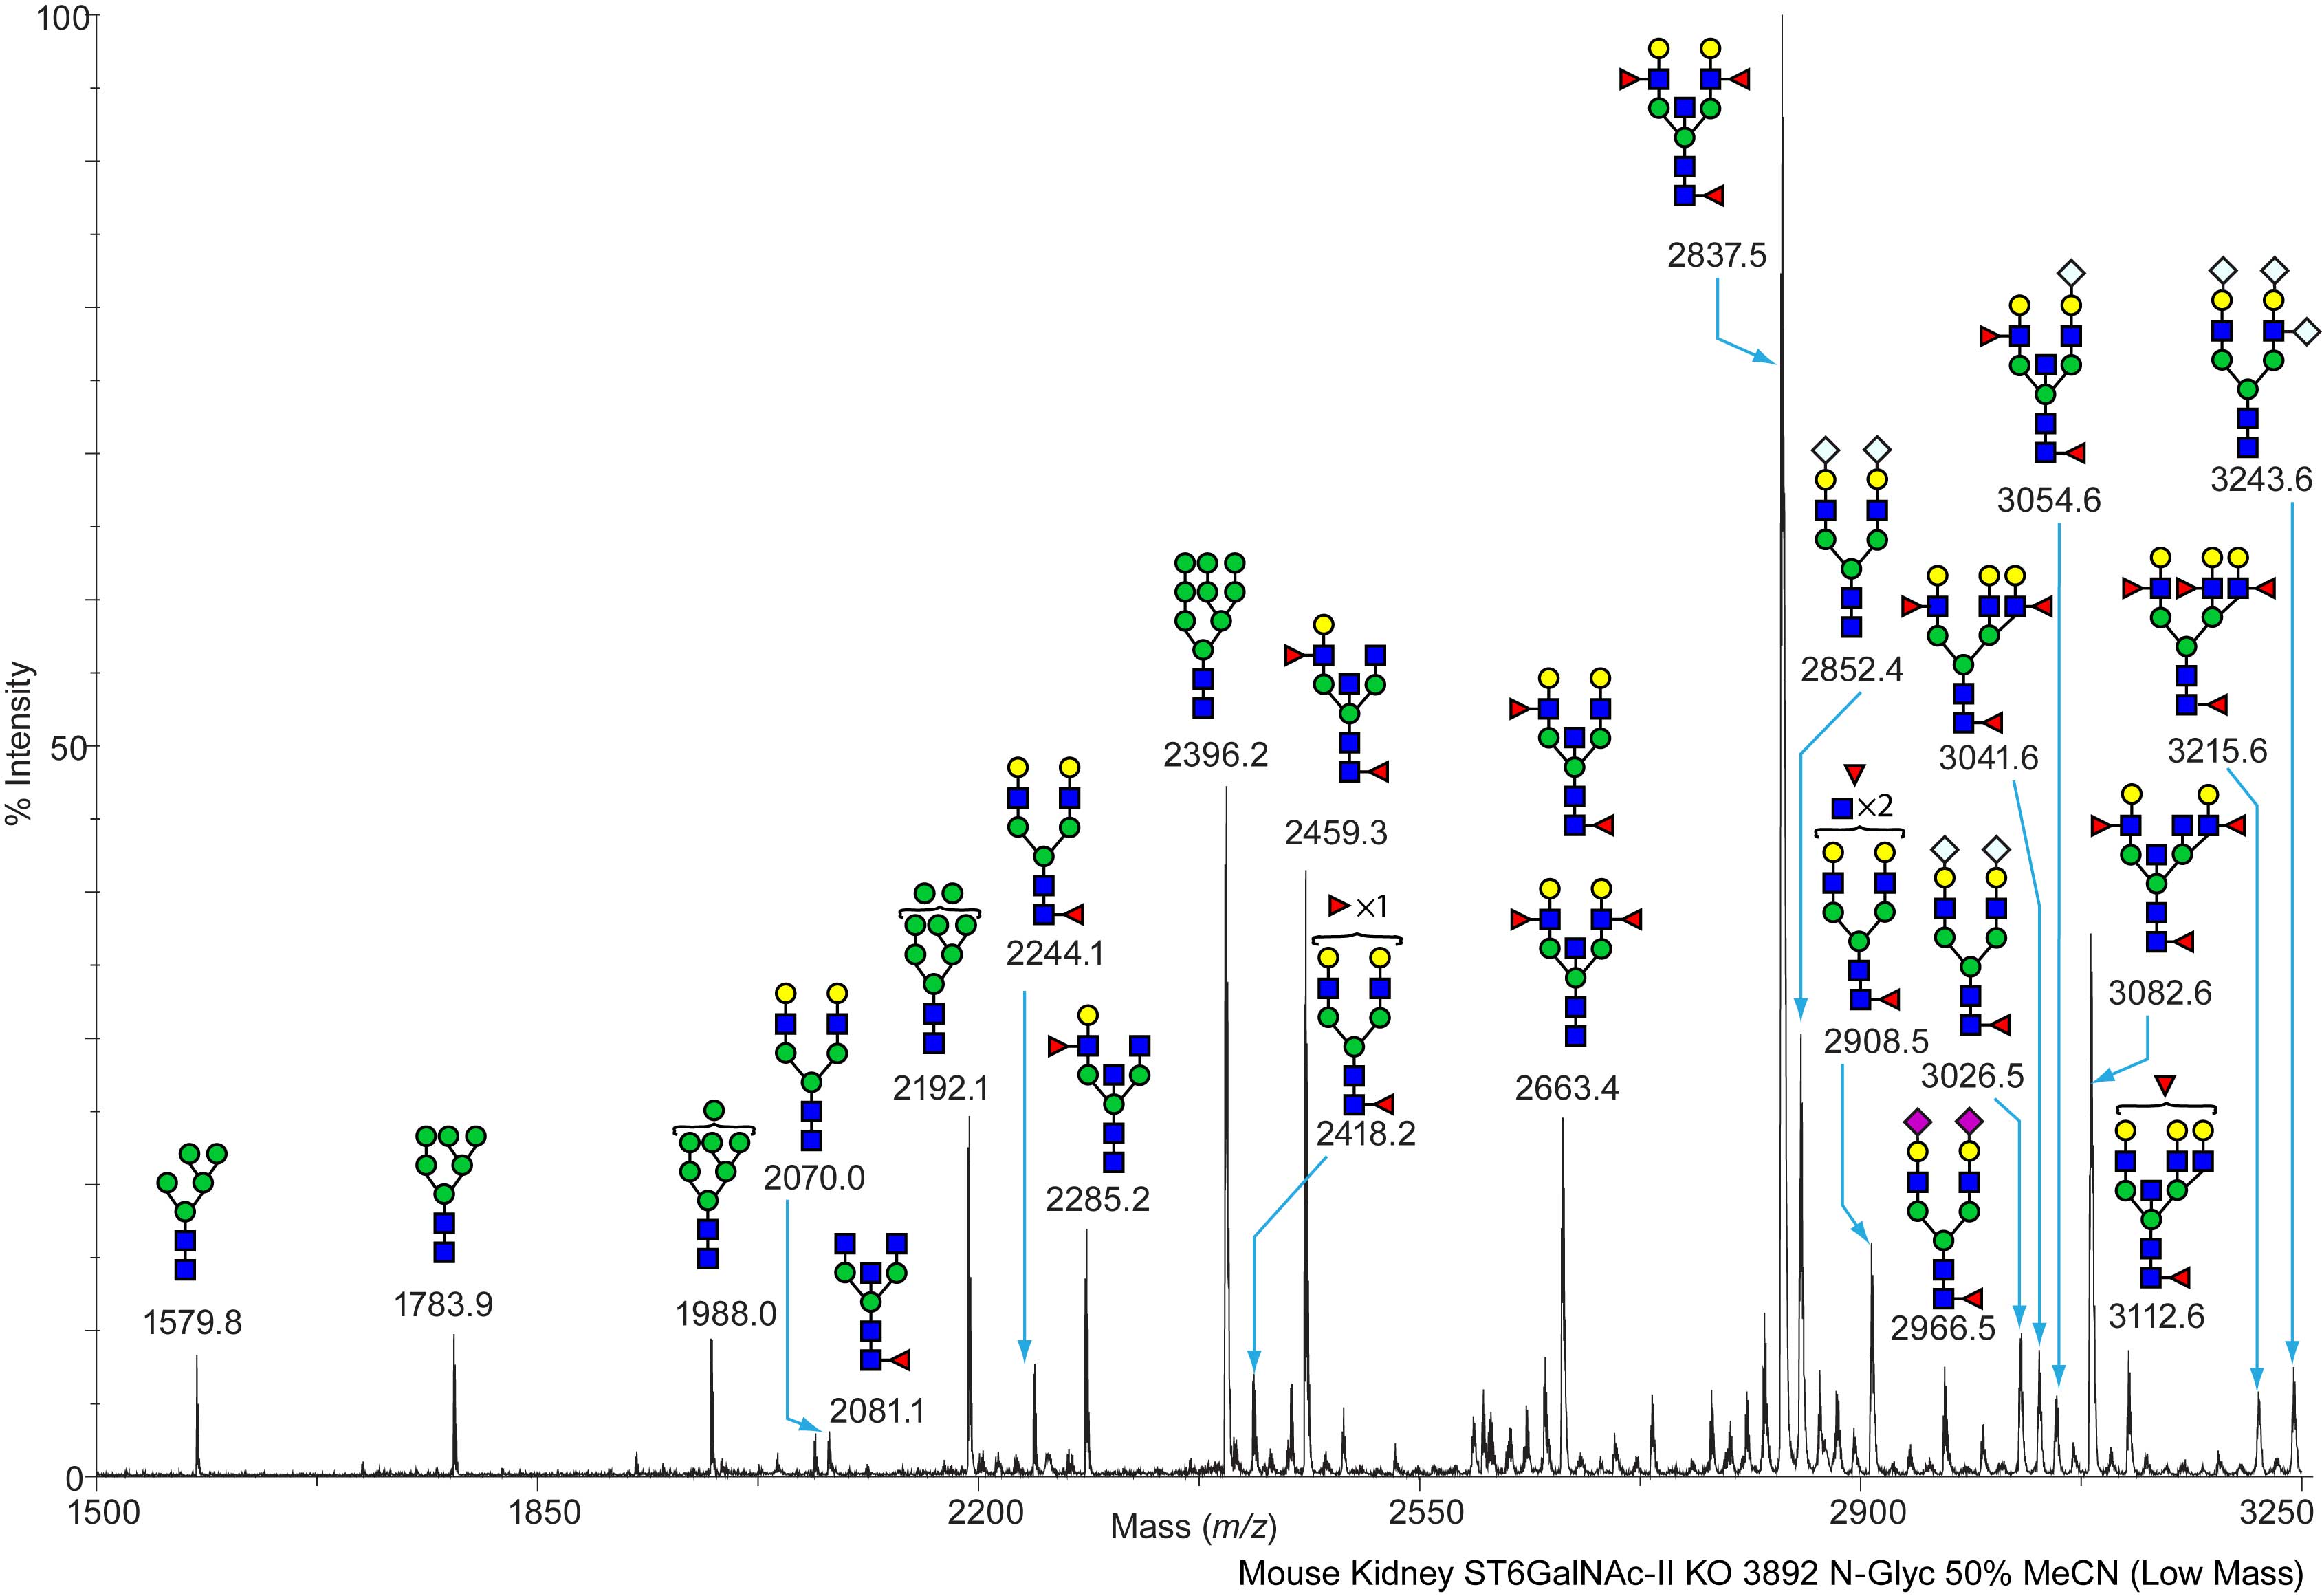
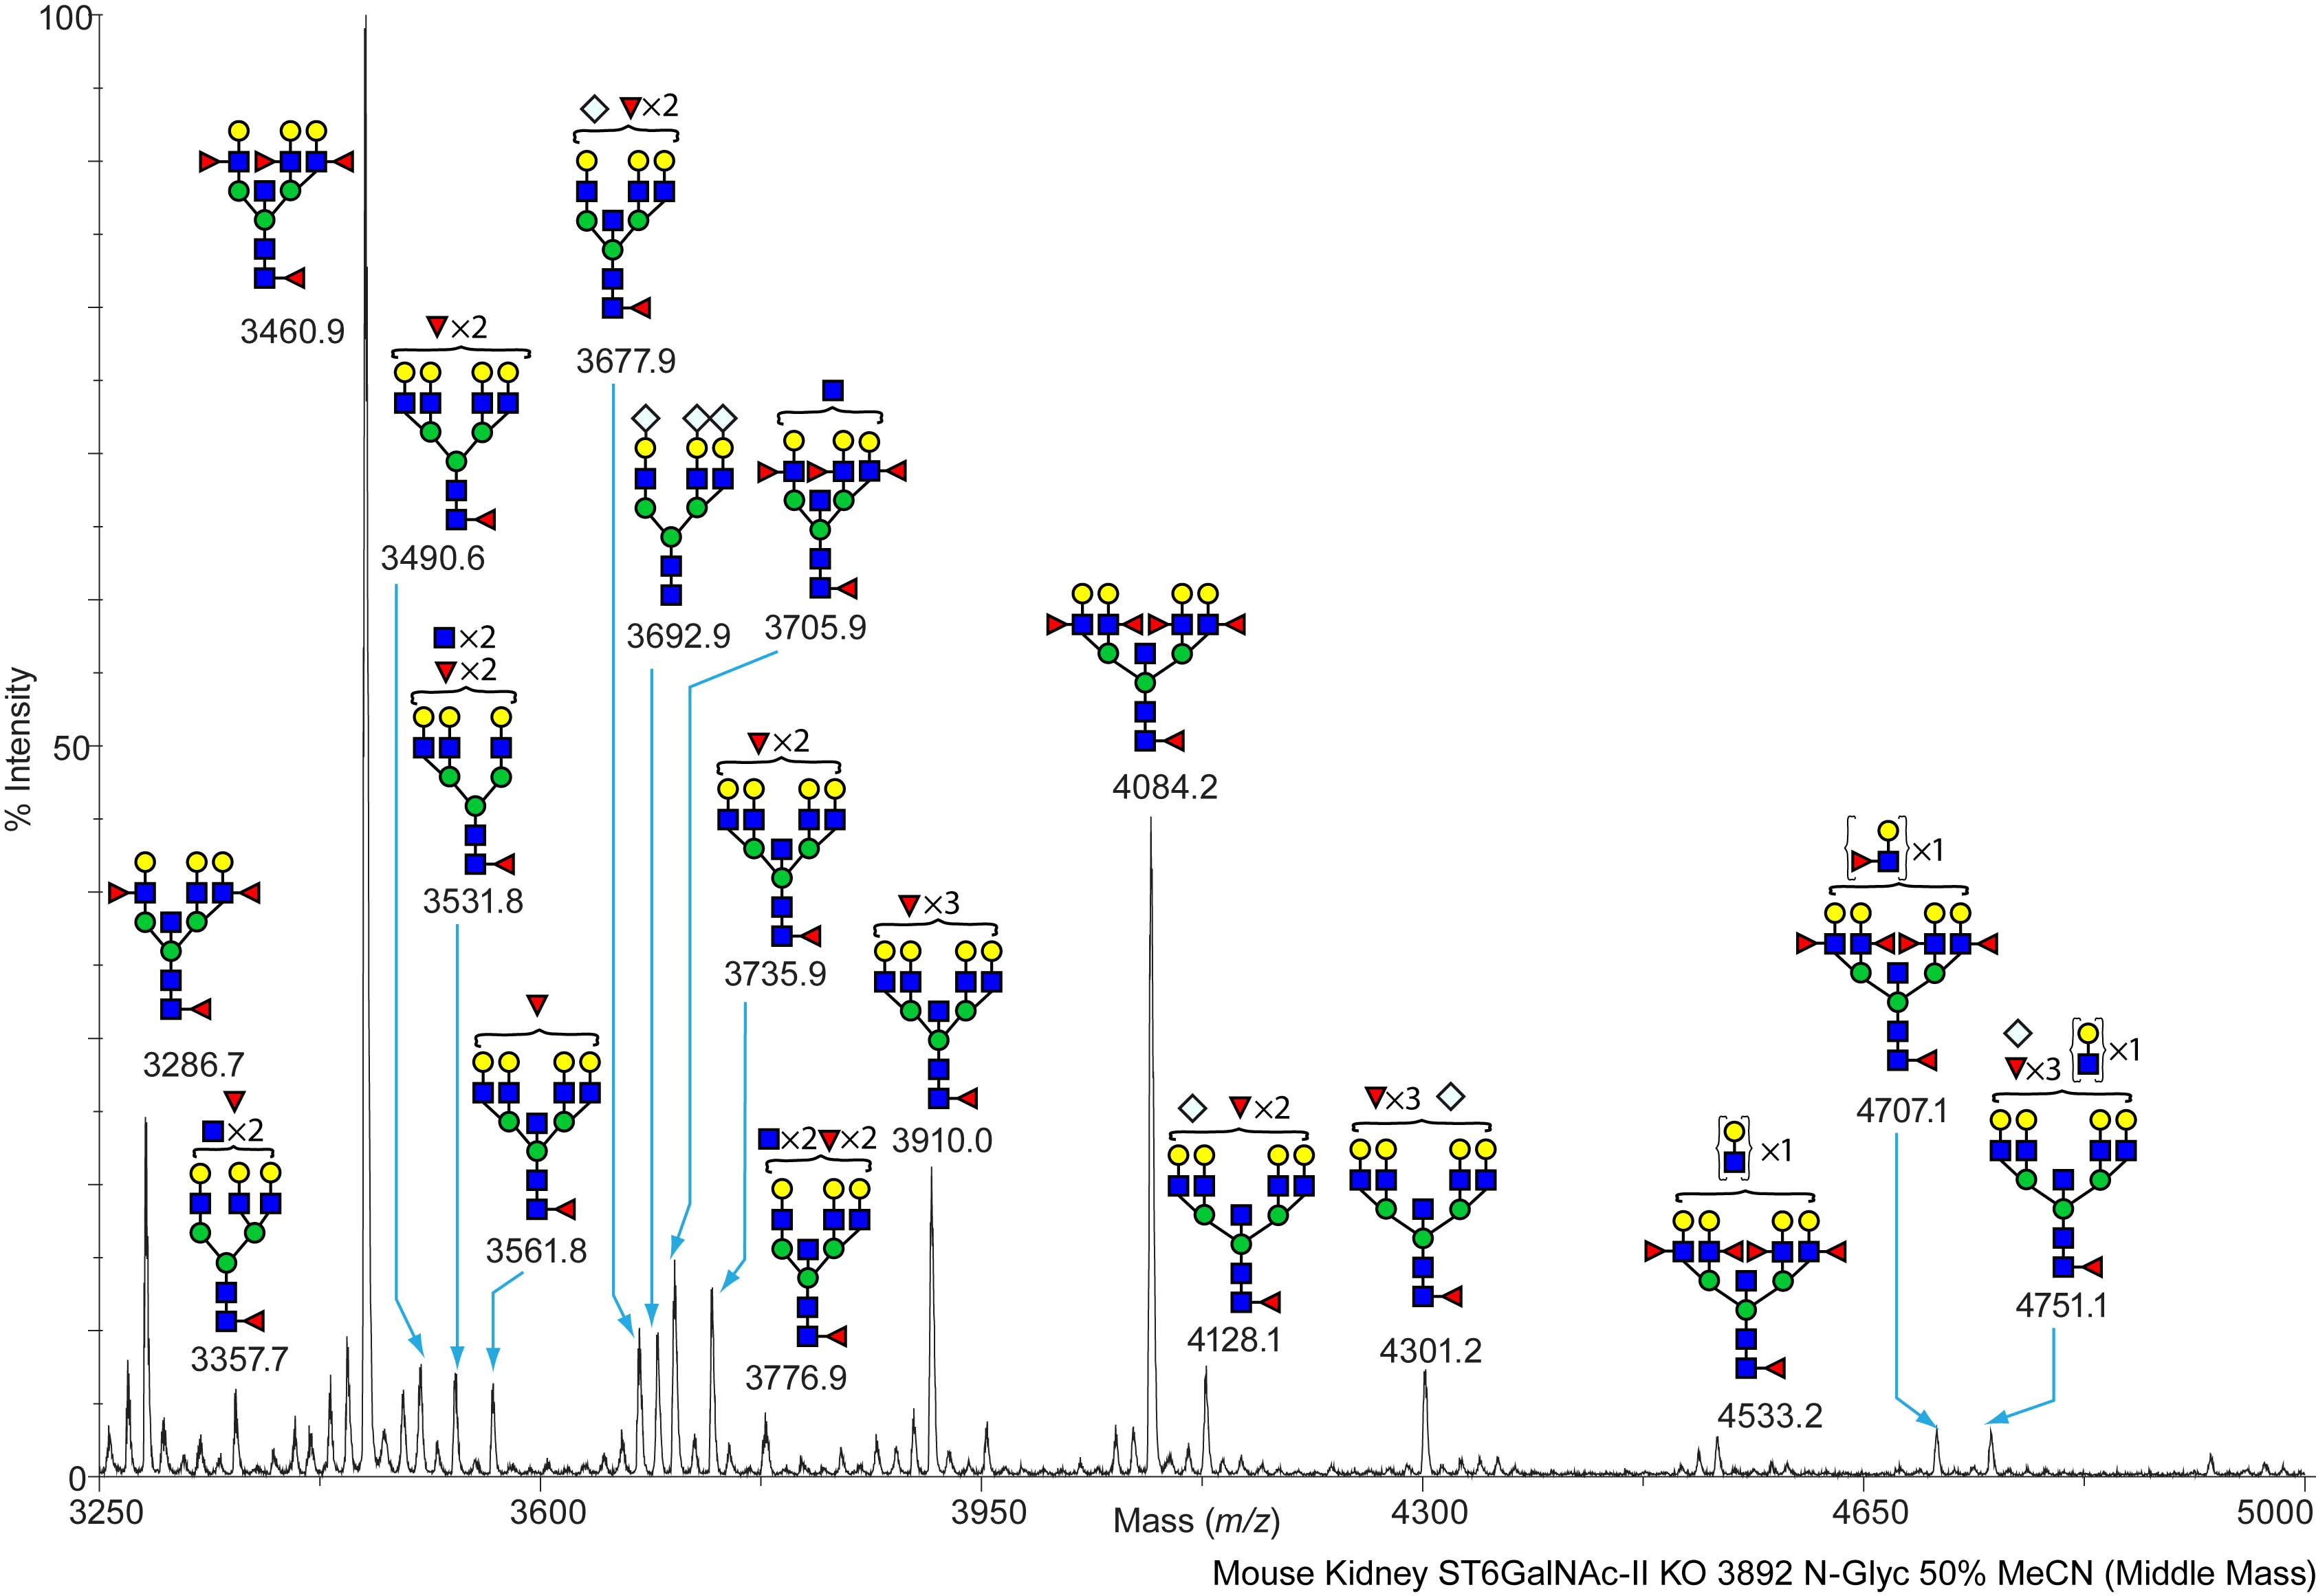
SS-D Mouse ST6GalNAc-II (-/-) Kidney Kidney ST6GalNAc-II KO (-/-), 3892, NG N-Linked C57BL/6 View experimental details      
Annotated file for lower mass range in JPG formatAnnotated file for higher mass range in JPG format Annotated file for lower mass range in PDF formatAnnotated file for higher mass range in PDF format
View Mass Spectrum data as text View Mass Peak file   Interactive Mass Spectrum Viewer
cfg_rRequest_2118
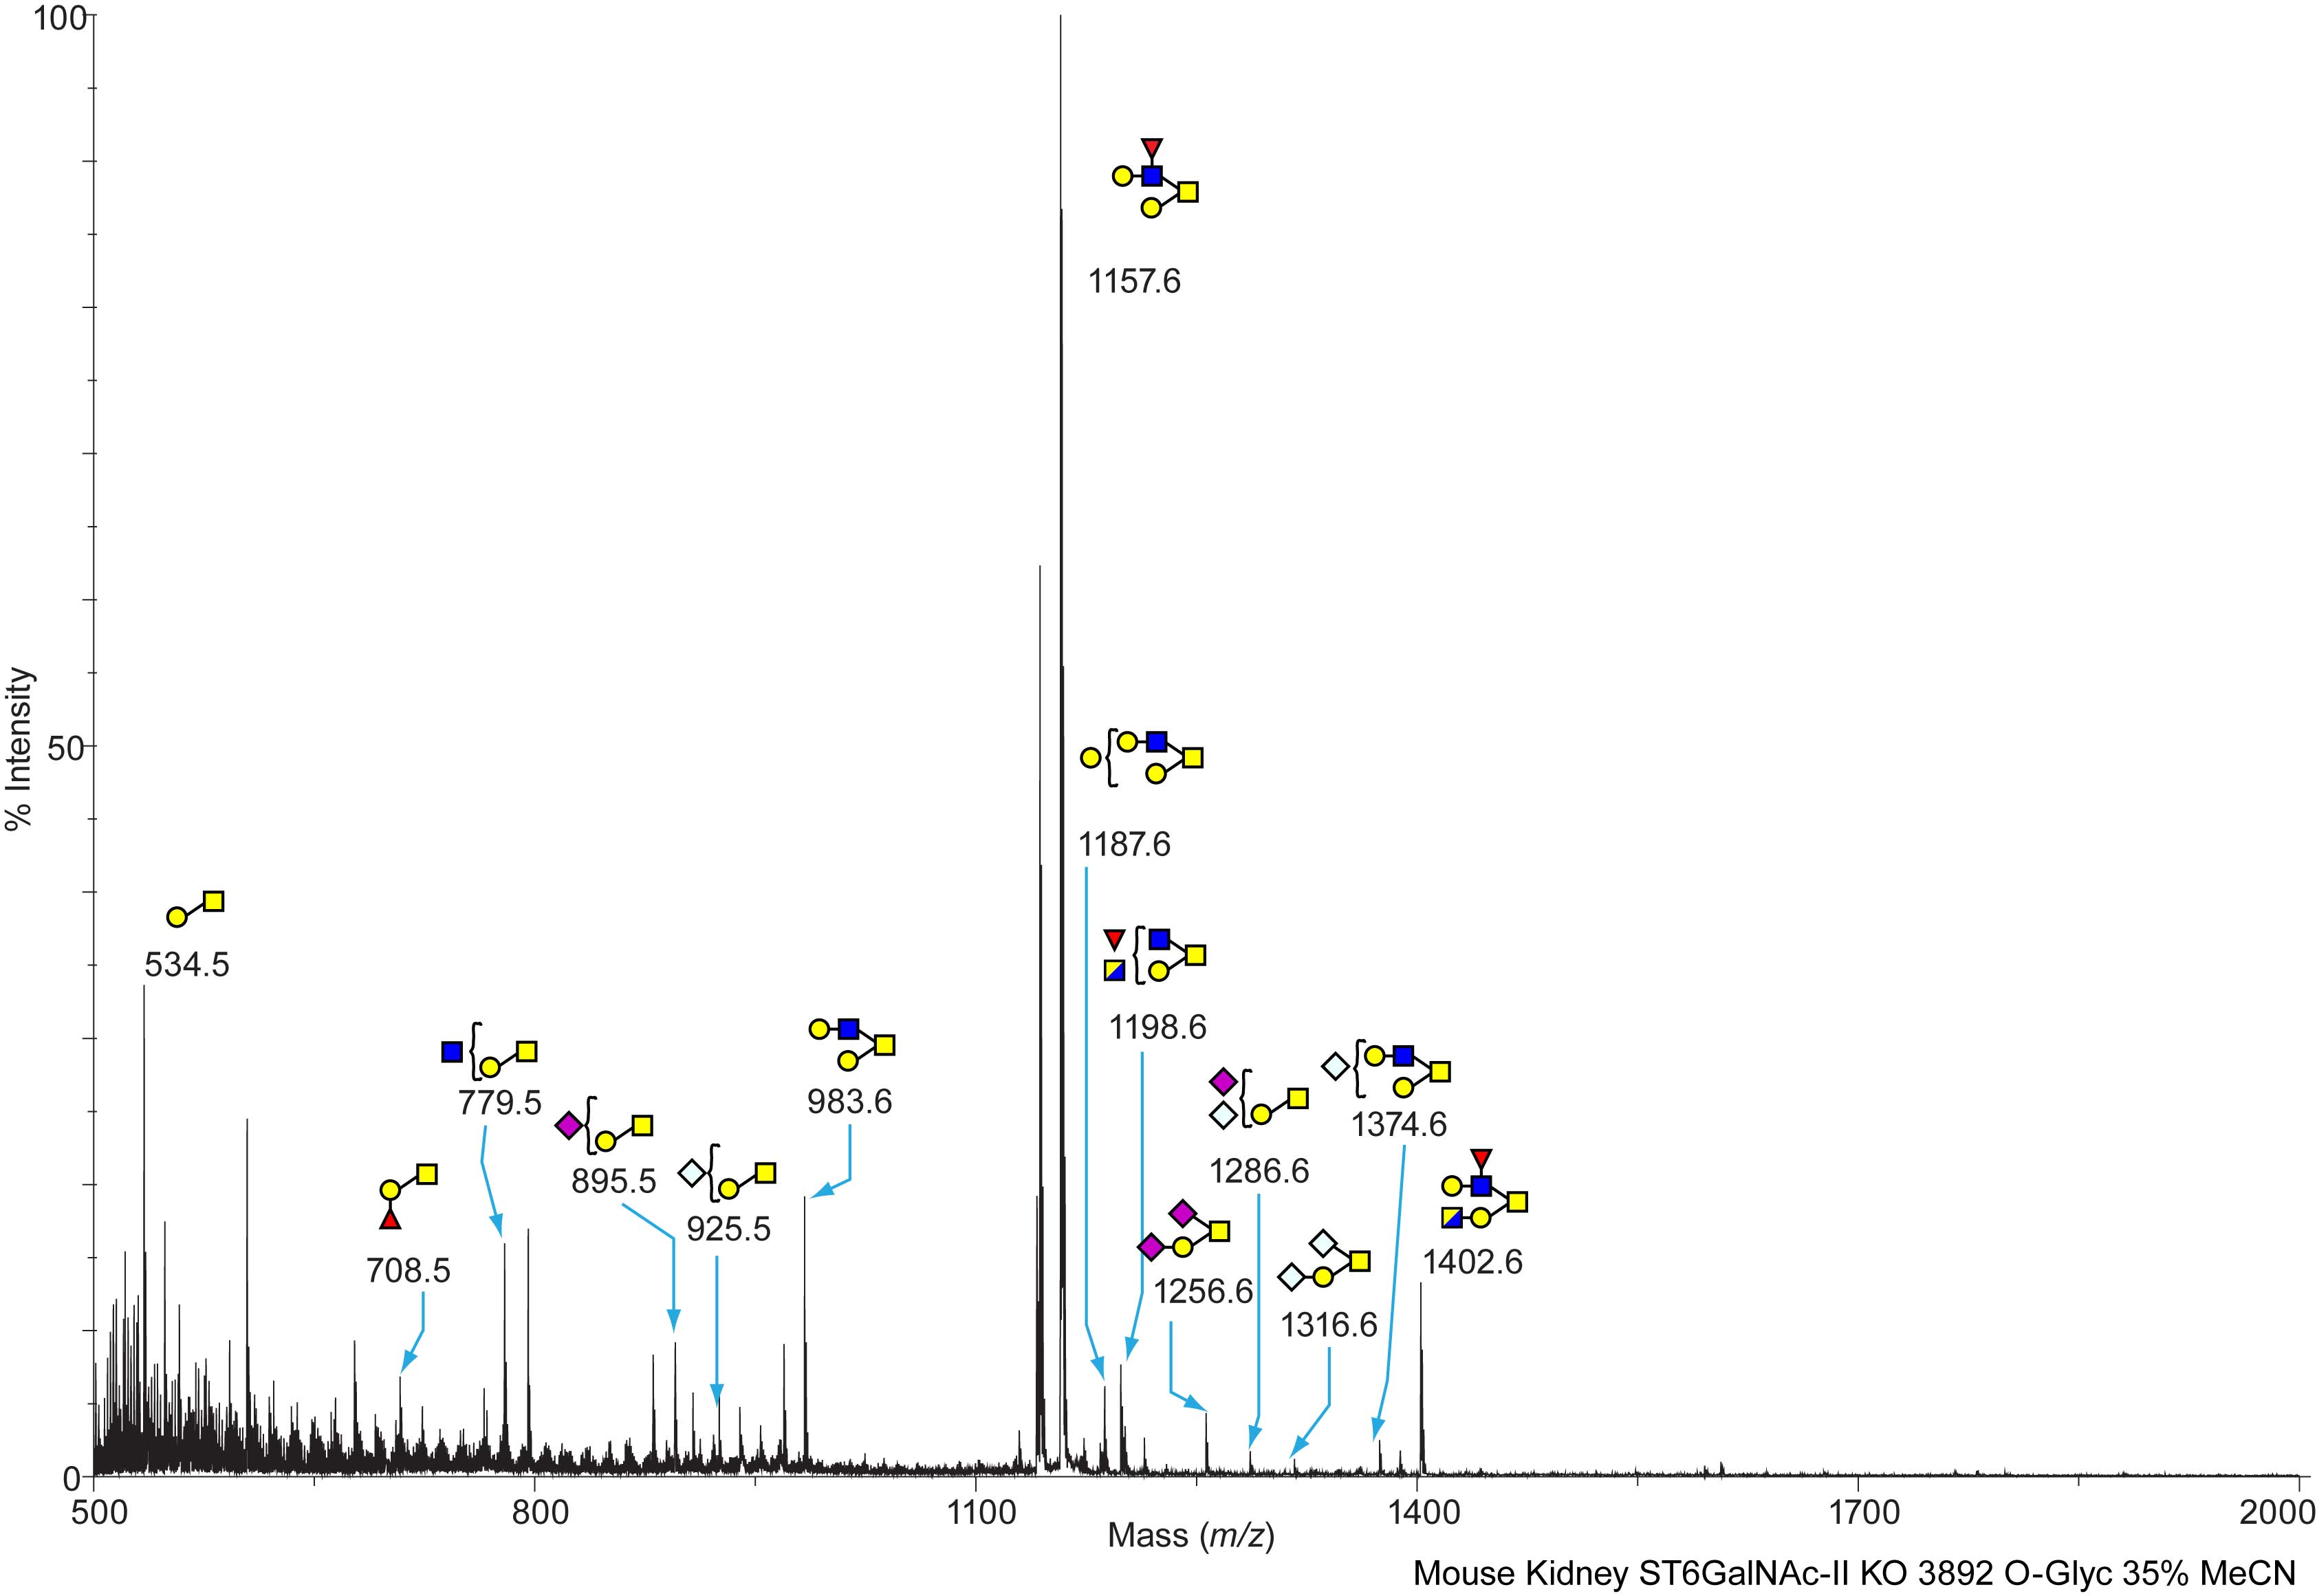
SS-D Mouse ST6GalNAc-II (-/-) Kidney Kidney ST6GalNAc-II KO (-/-), 3892, OG O-Linked C57BL/6 View experimental details      
Annotated file in JPG format Annotated file in PDF format
View Mass Spectrum data as text View Mass Peak file   Interactive Mass Spectrum Viewer
cfg_rRequest_2118
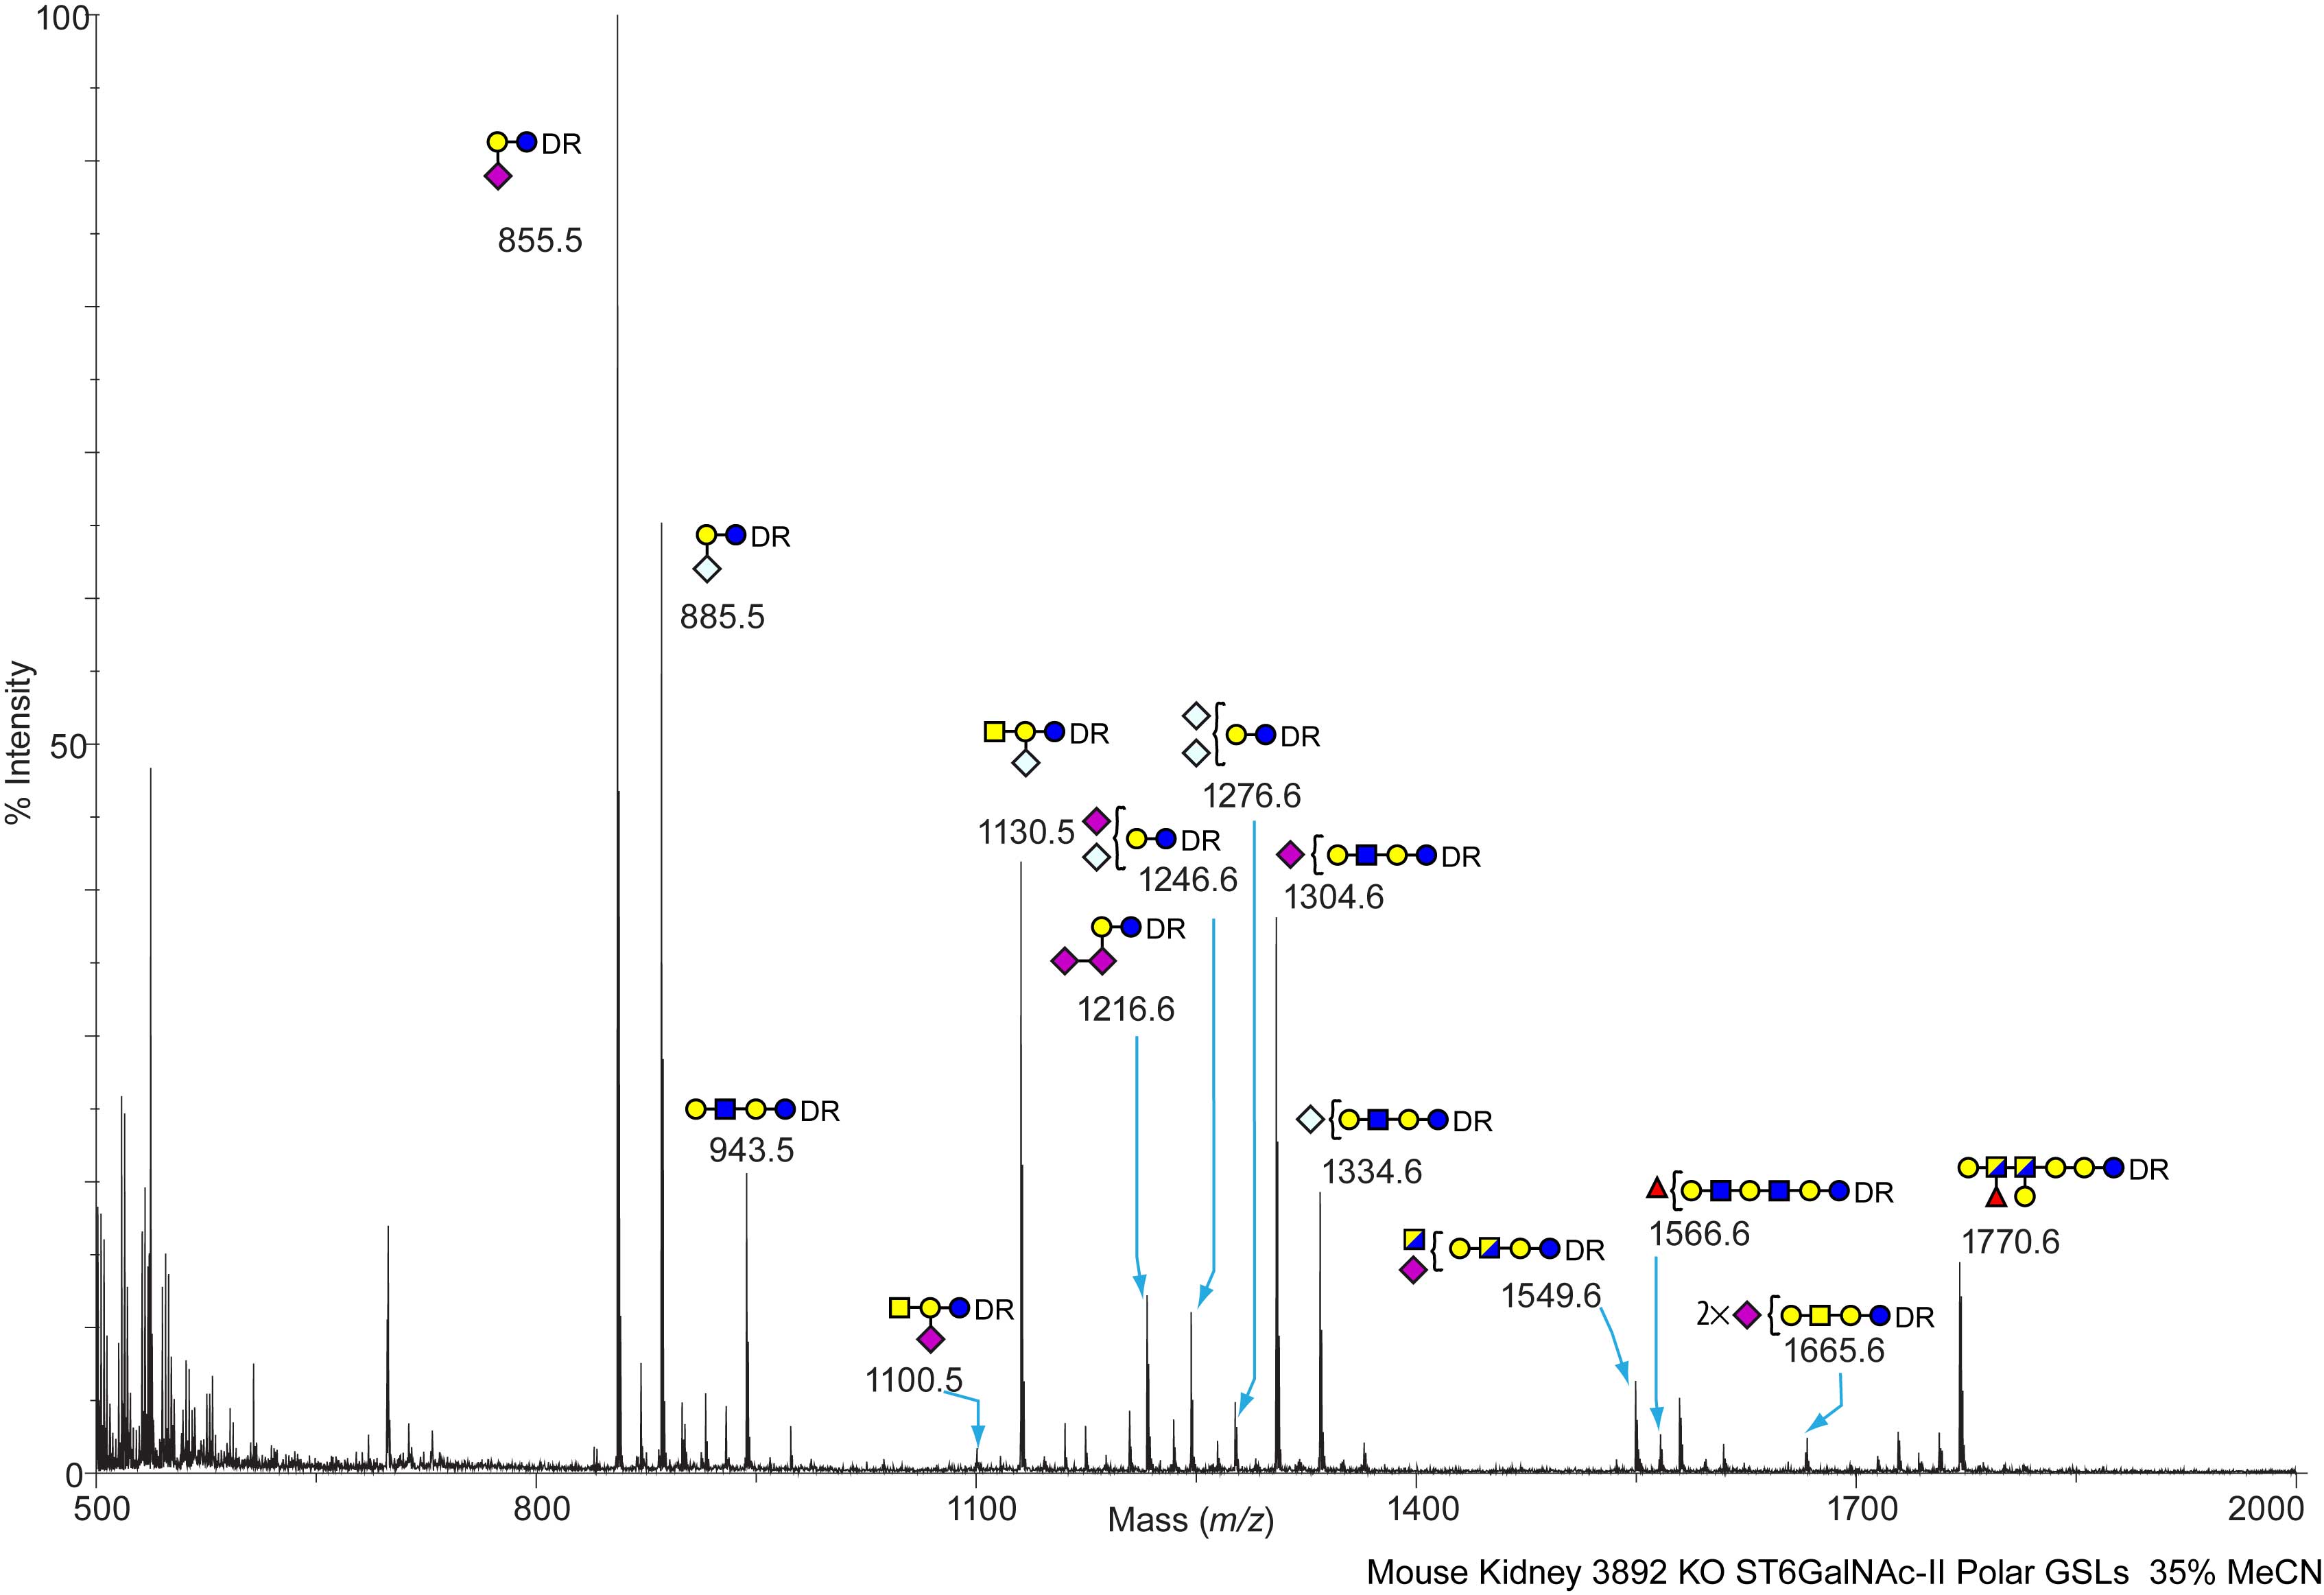
SS-D Mouse ST6GalNAc-II (-/-) Kidney Kidney ST6GalNAc-II KO (-/-), 3892, PGL Polar Glycolipids C57BL/6 View experimental details      
Annotated file in JPG format Annotated file in PDF format
View Mass Spectrum data as text View Mass Peak file   Interactive Mass Spectrum Viewer
cfg_rRequest_2118
SS-D Mouse ST6GalNAc-II (-/-) Kidney Kidney ST6GalNAc-II KO (-/-), 3892, NPGL Non-Polar Glycolipids C57BL/6 View experimental details      
   
View Mass Spectrum data as text      
cfg_rRequest_2118
Mouse Wild Type Testes Testes ST6GalNAc-II WT (+/+), PO489, NG N-Linked C57BL/6 View experimental details      
Annotated file for lower mass range in JPG formatAnnotated file for higher mass range in JPG format Annotated file for lower mass range in PDF formatAnnotated file for higher mass range in PDF format
View Mass Spectrum data as text View Mass Peak file   Interactive Mass Spectrum Viewer
cfg_rRequest_2118
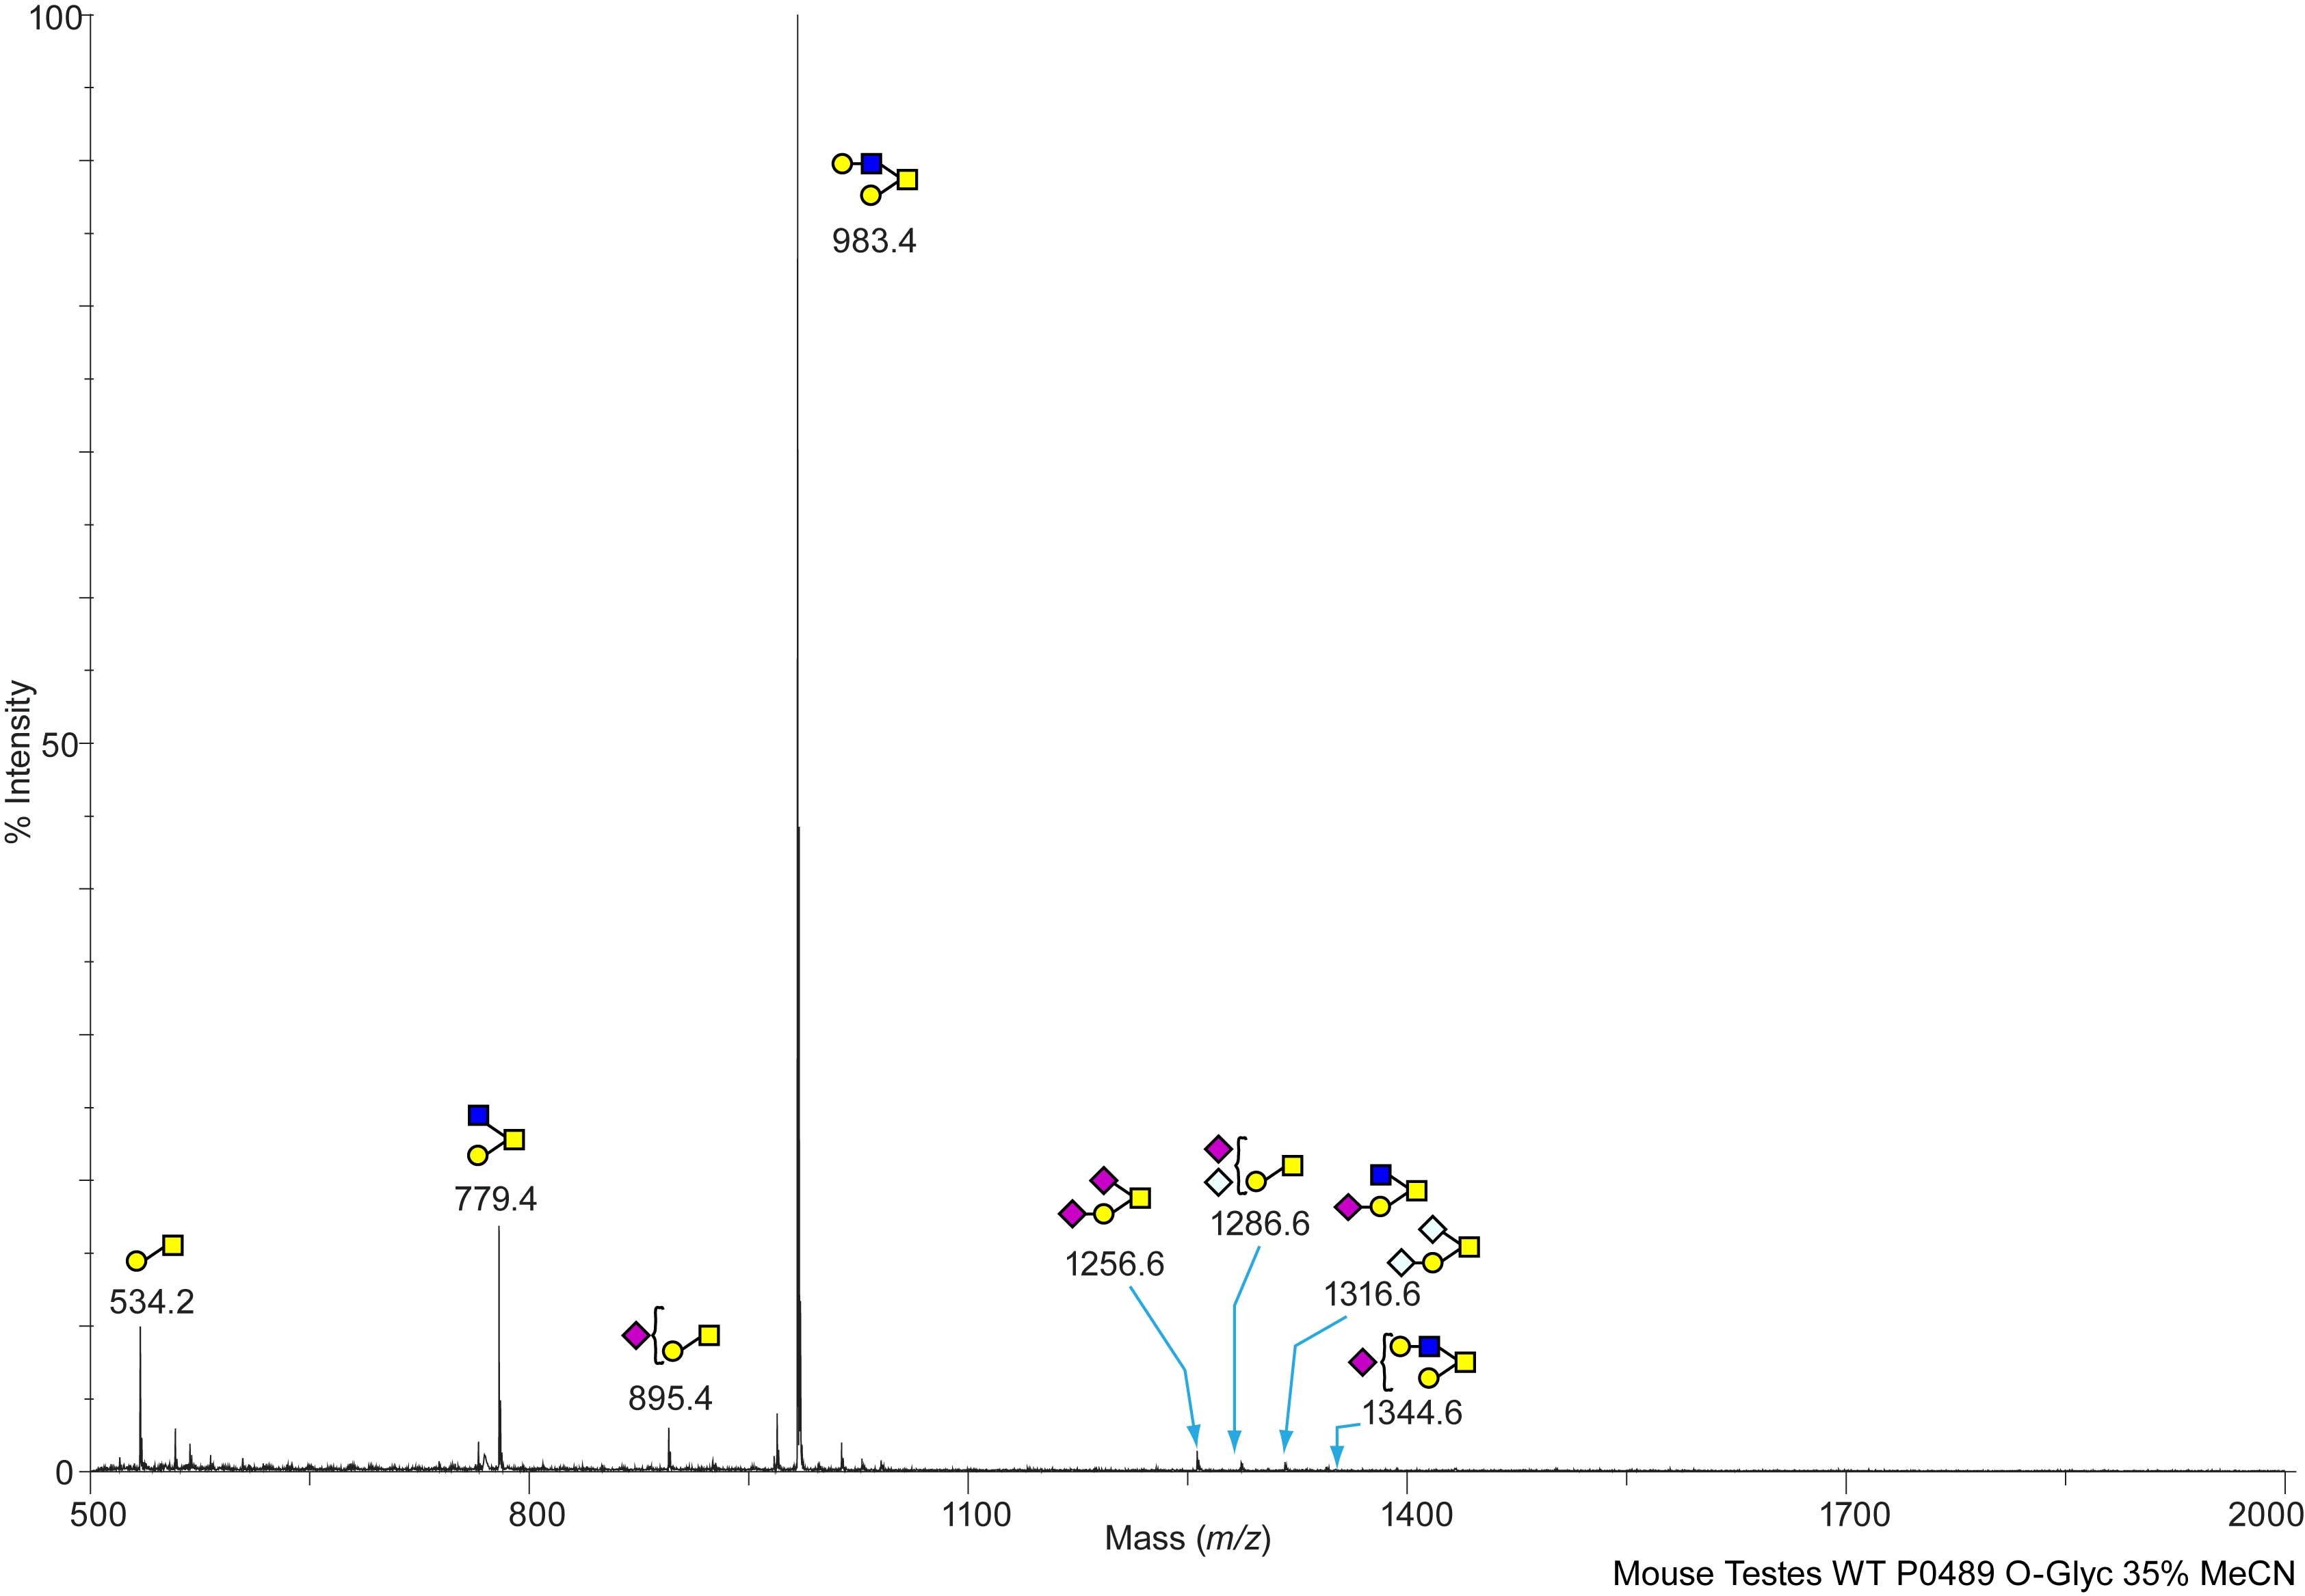
Mouse Wild Type Testes Testes ST6GalNAc-II WT (+/+), PO489, OG O-Linked C57BL/6 View experimental details      
Annotated file in JPG format Annotated file in PDF format
View Mass Spectrum data as text      
cfg_rRequest_2118
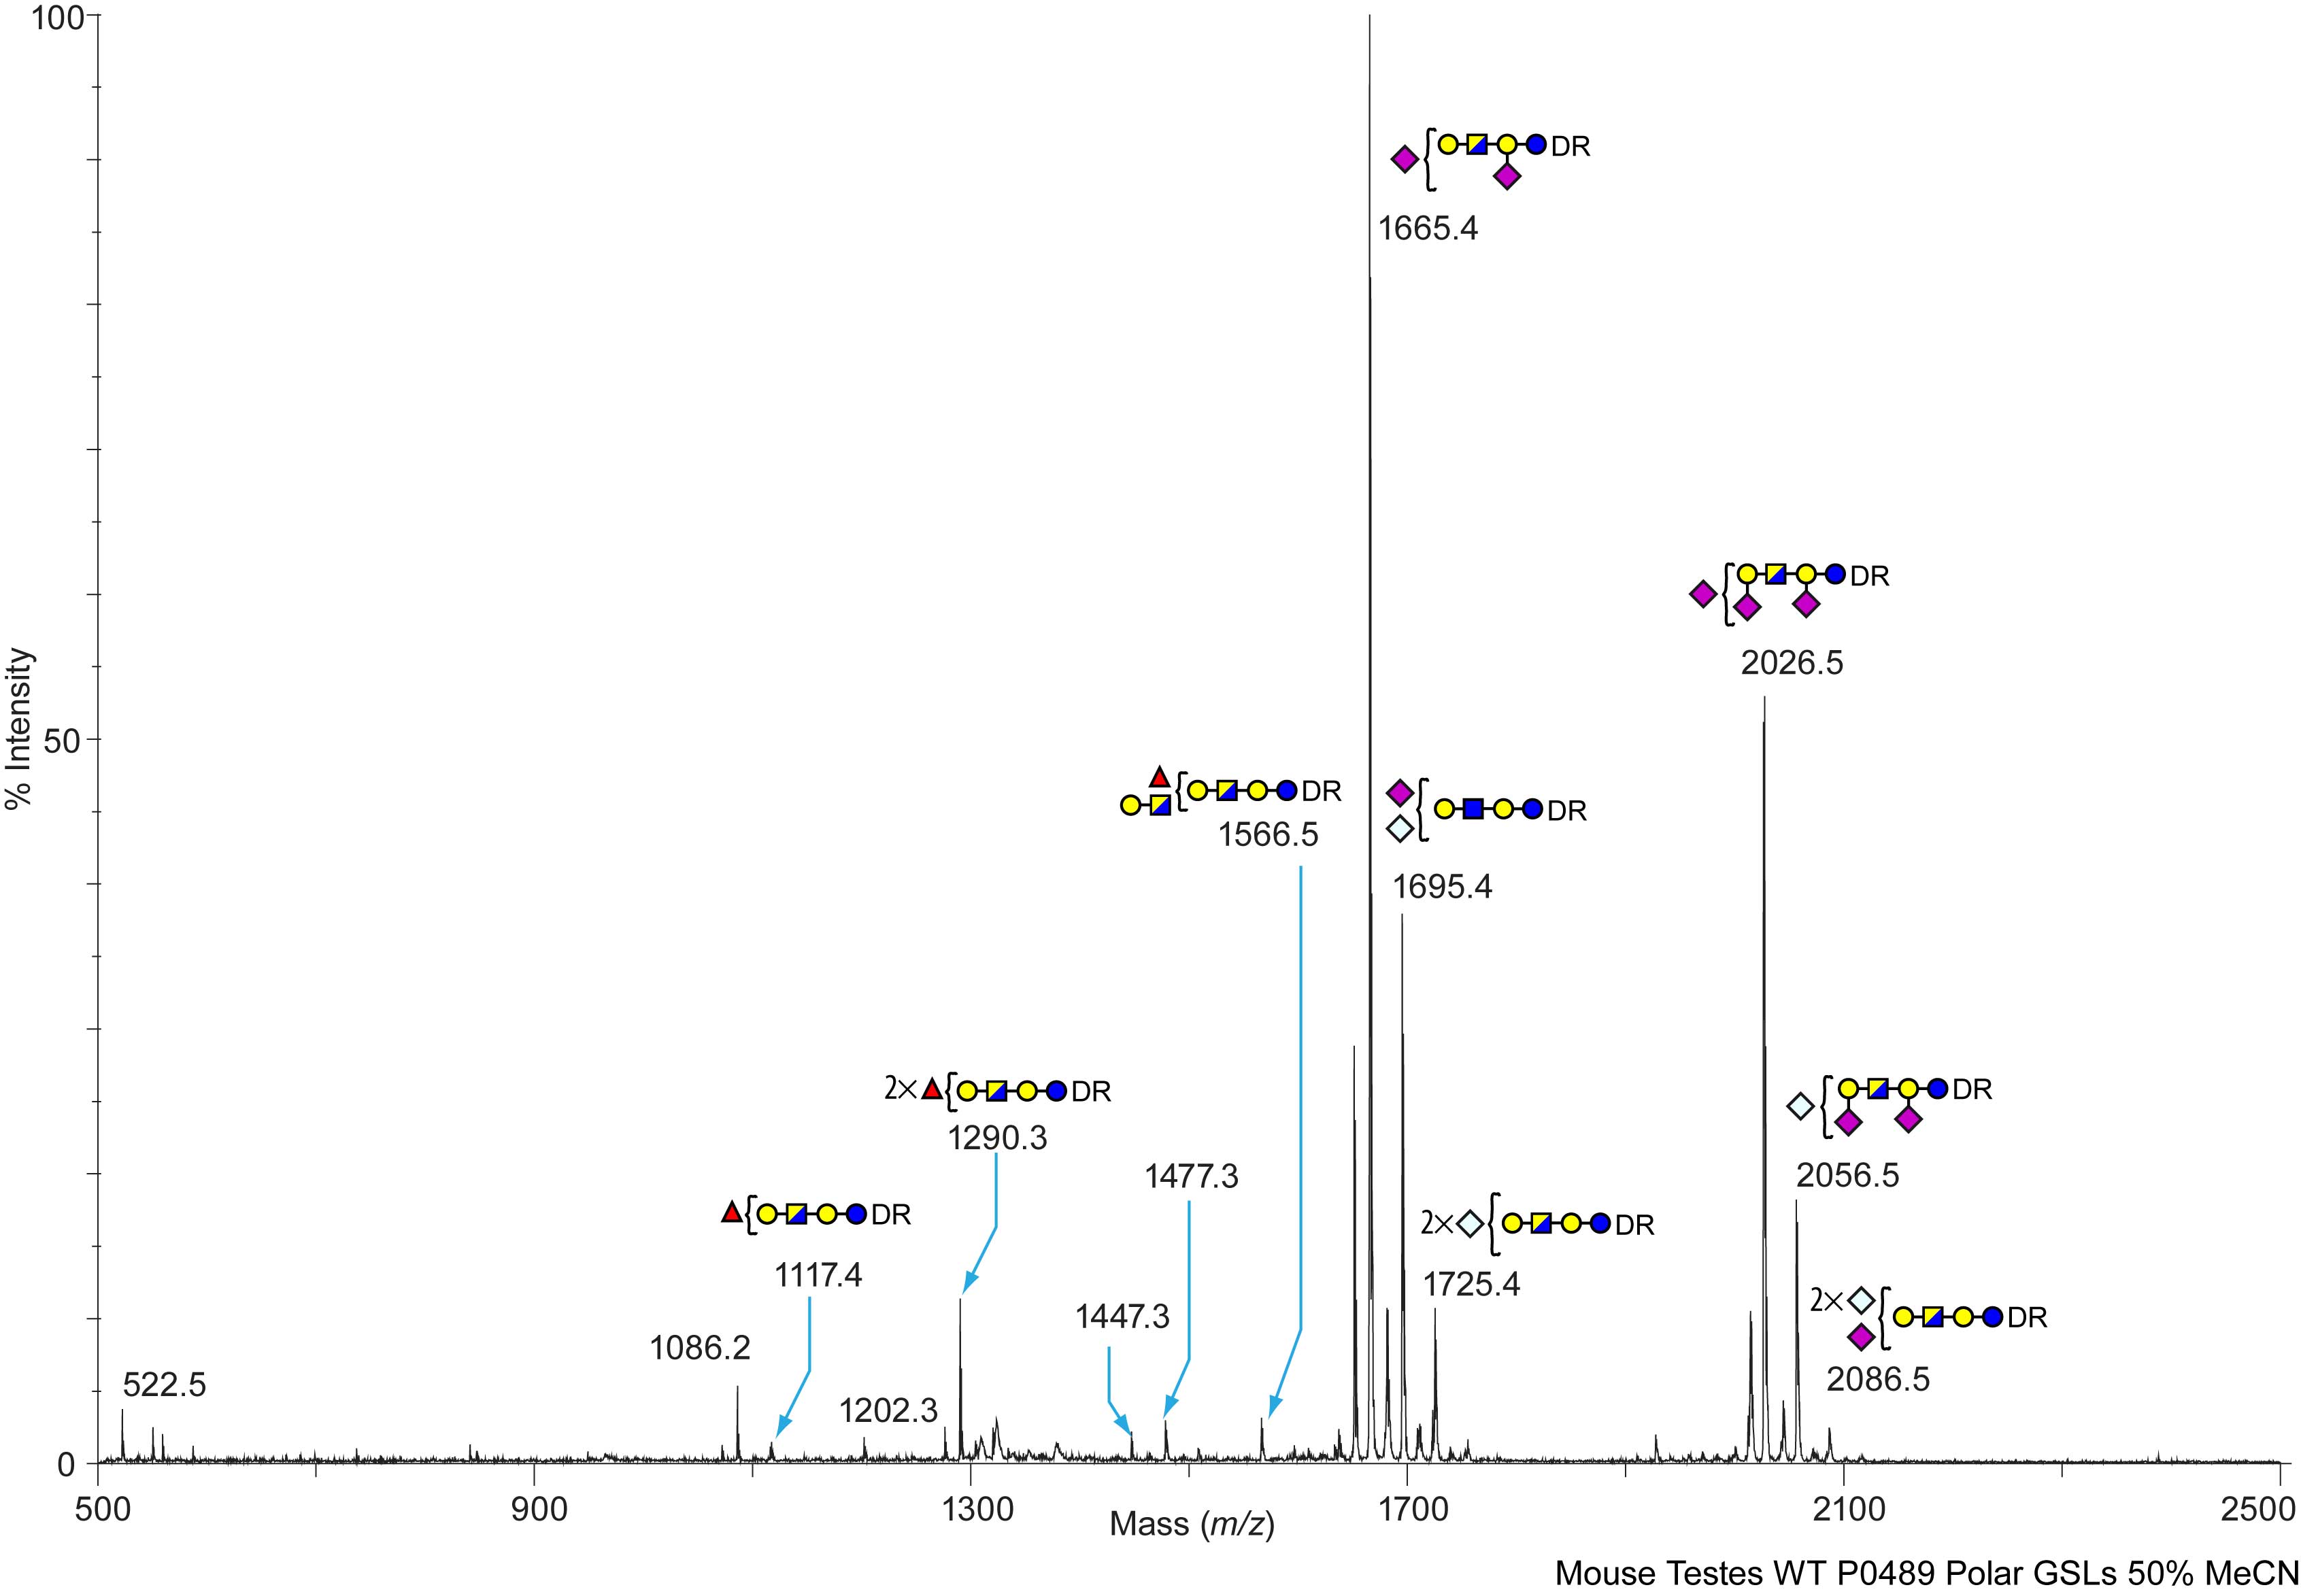
Mouse Wild Type Testes Testes ST6GalNAc-II WT (+/+), PO489, PGL Polar Glycolipids C57BL/6 View experimental details      
Annotated file in JPG format Annotated file in PDF format
View Mass Spectrum data as text View Mass Peak file   Interactive Mass Spectrum Viewer
cfg_rRequest_2118
SS-D Mouse ST6GalNAc-II (-/-) Testes Testes ST6GalNAc-II KO (-/-), 3891, NG N-Linked C57BL/6 View experimental details      
   
View Mass Spectrum data as text      
cfg_rRequest_2118
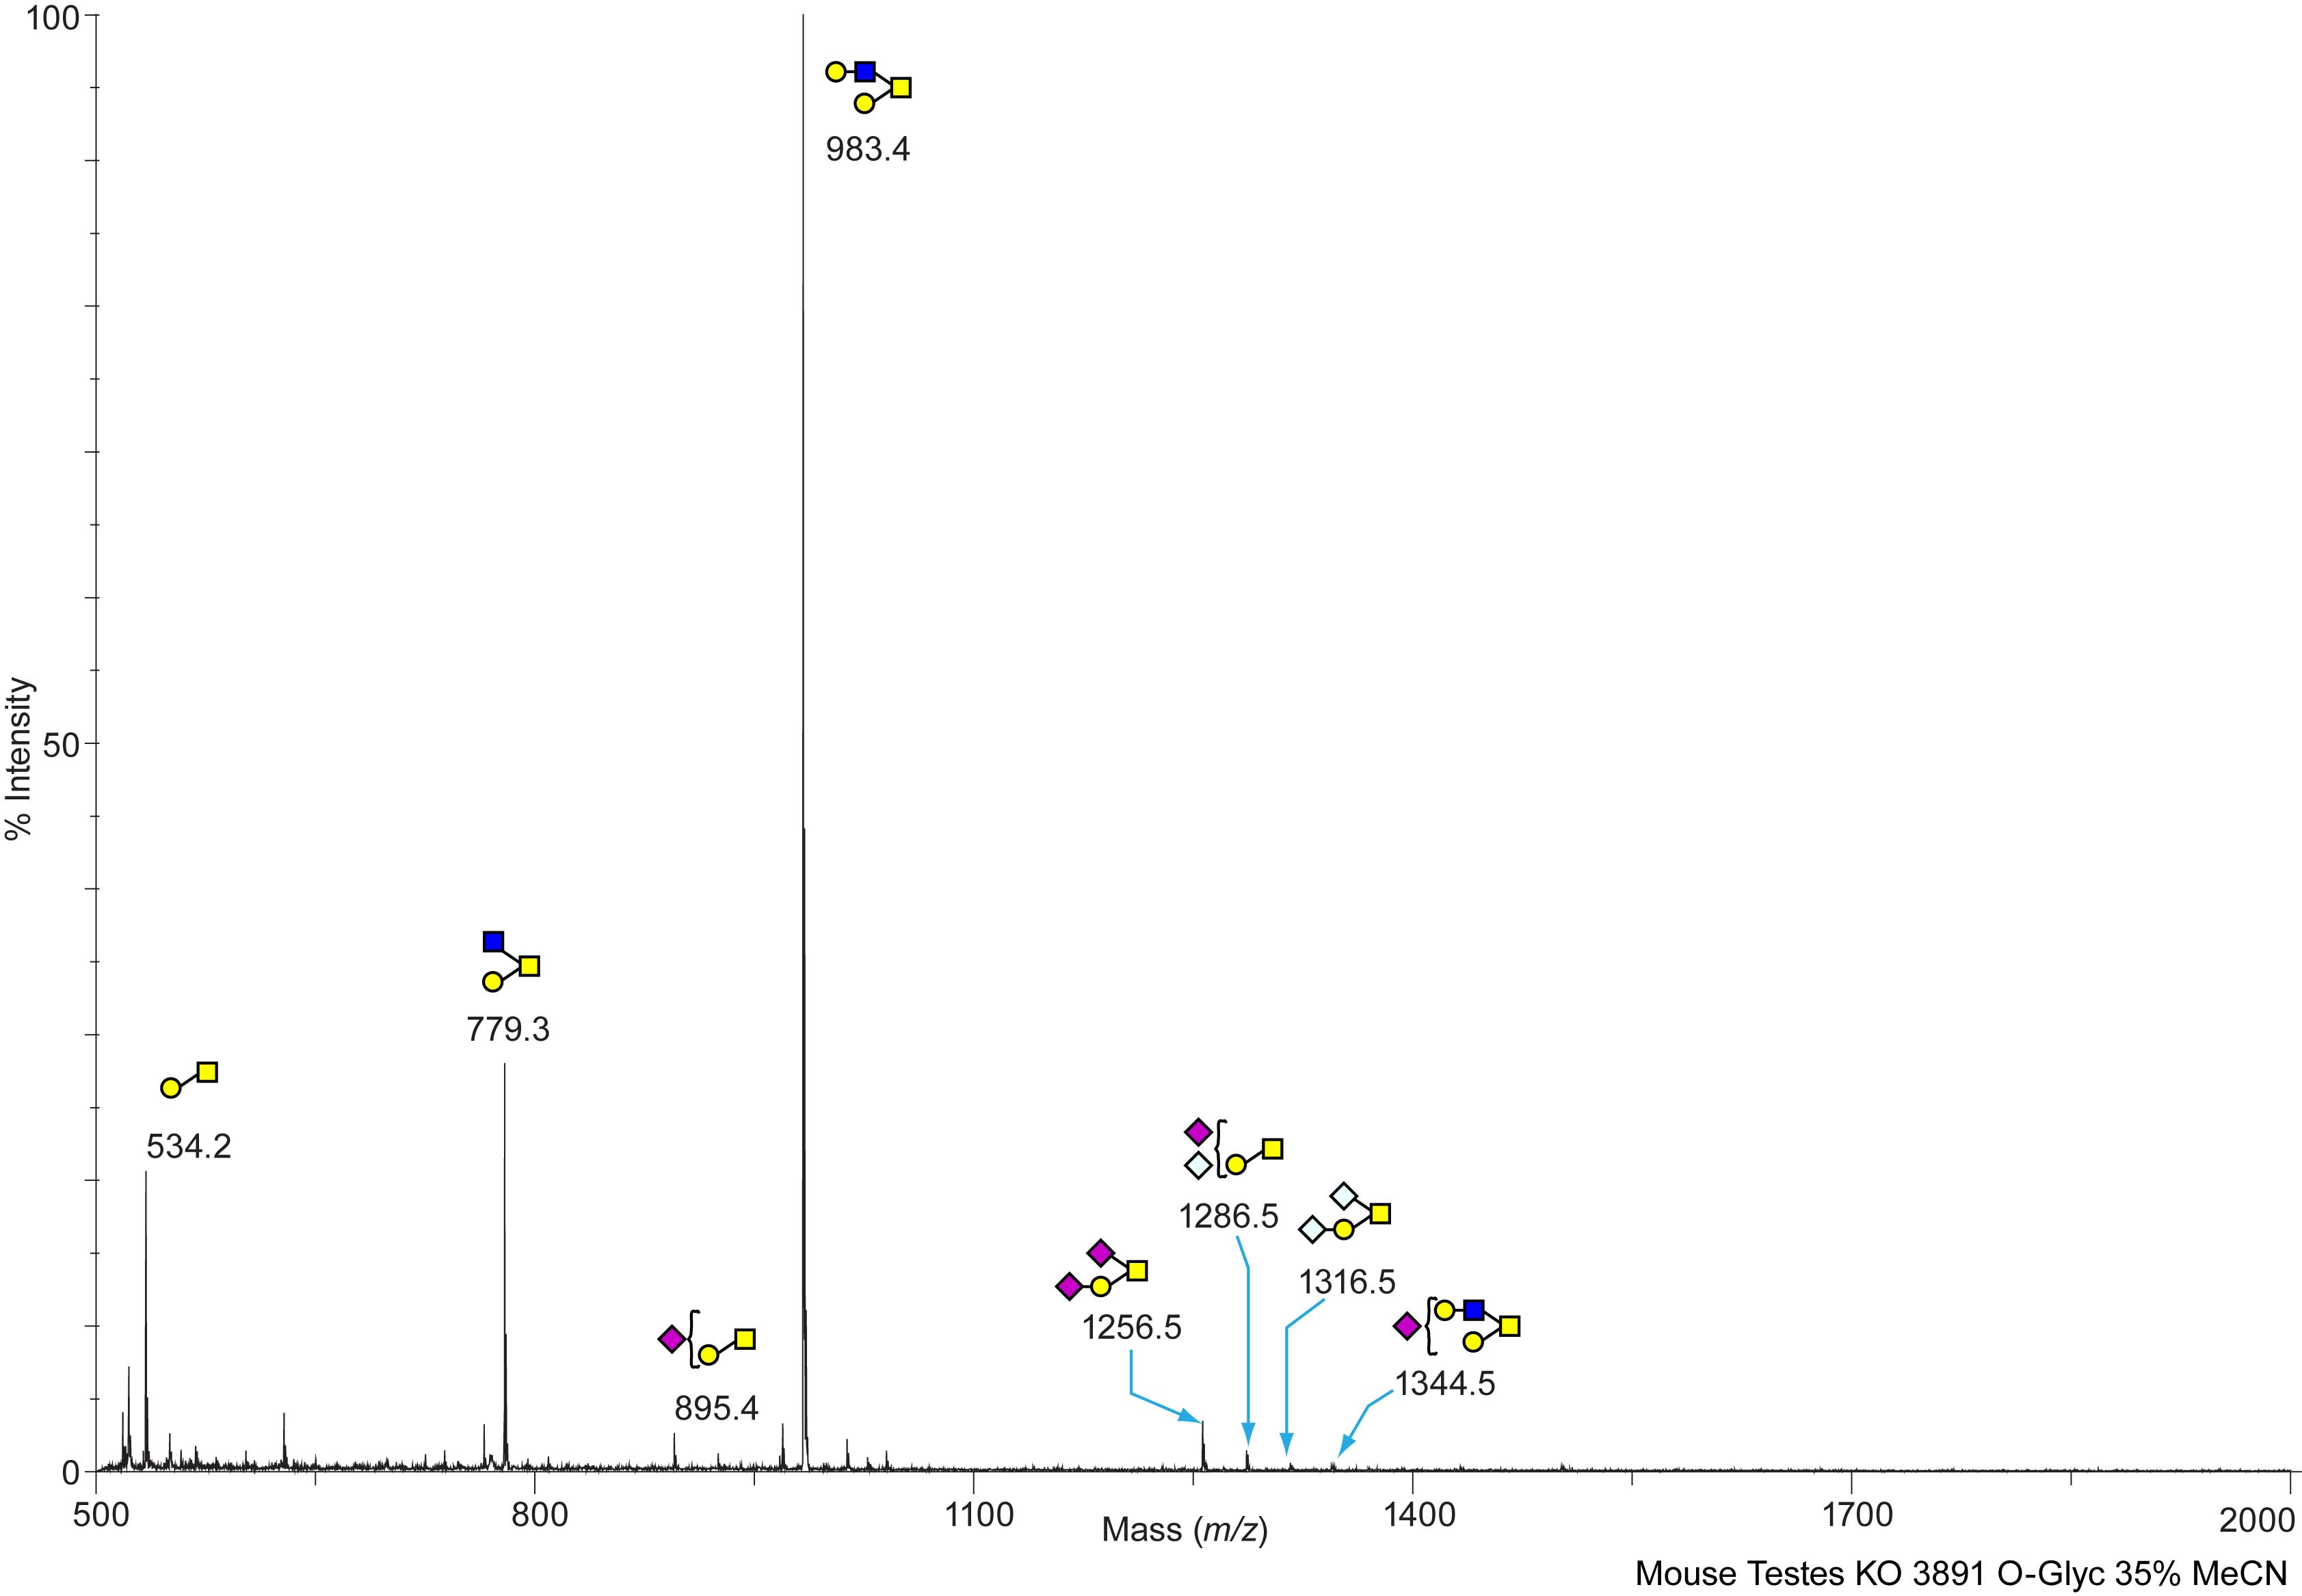
SS-D Mouse ST6GalNAc-II (-/-) Testes Testes ST6GalNAc-II KO (-/-), 3891, OG O-Linked C57BL/6 View experimental details      
Annotated file in JPG format Annotated file in PDF format
View Mass Spectrum data as text View Mass Peak file   Interactive Mass Spectrum Viewer
cfg_rRequest_2118
SS-D Mouse ST6GalNAc-II (-/-) Testes Testes ST6GalNAc-II KO (-/-), 3891, PGL Polar Glycolipids C57BL/6 View experimental details      
Annotated file in JPG format Annotated file in PDF format
View Mass Spectrum data as text View Mass Peak file   Interactive Mass Spectrum Viewer
cfg_rRequest_2118
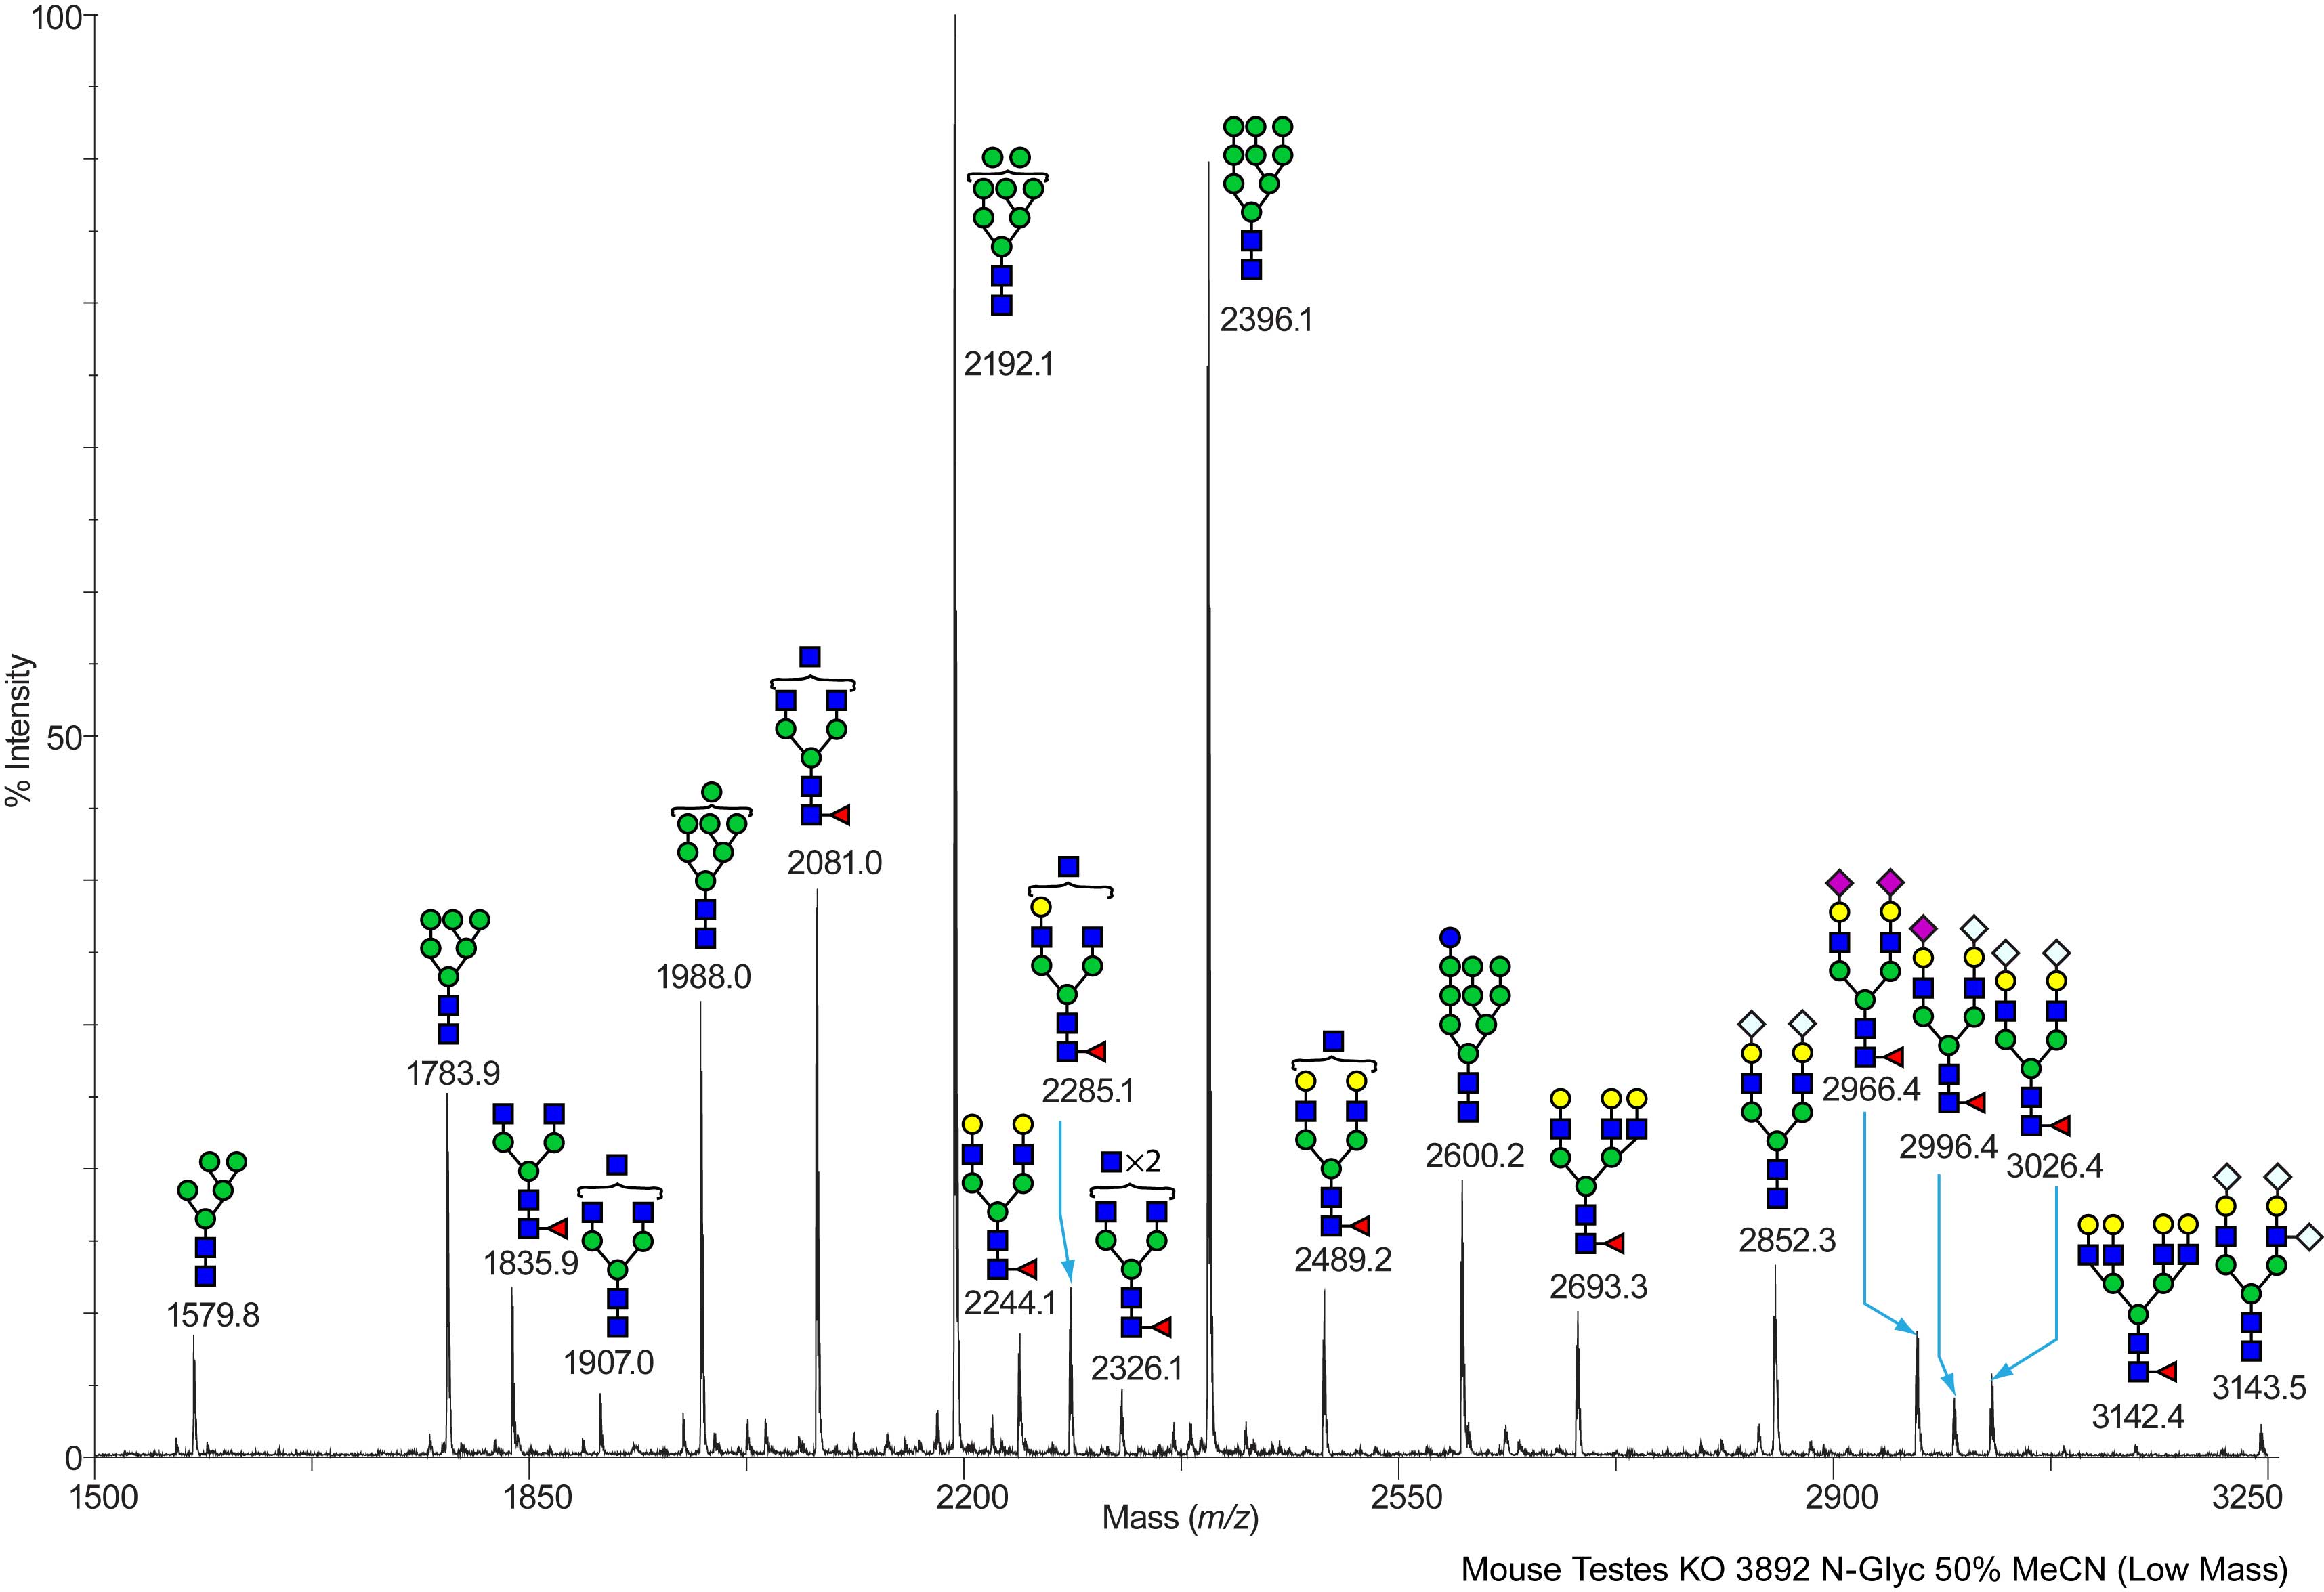
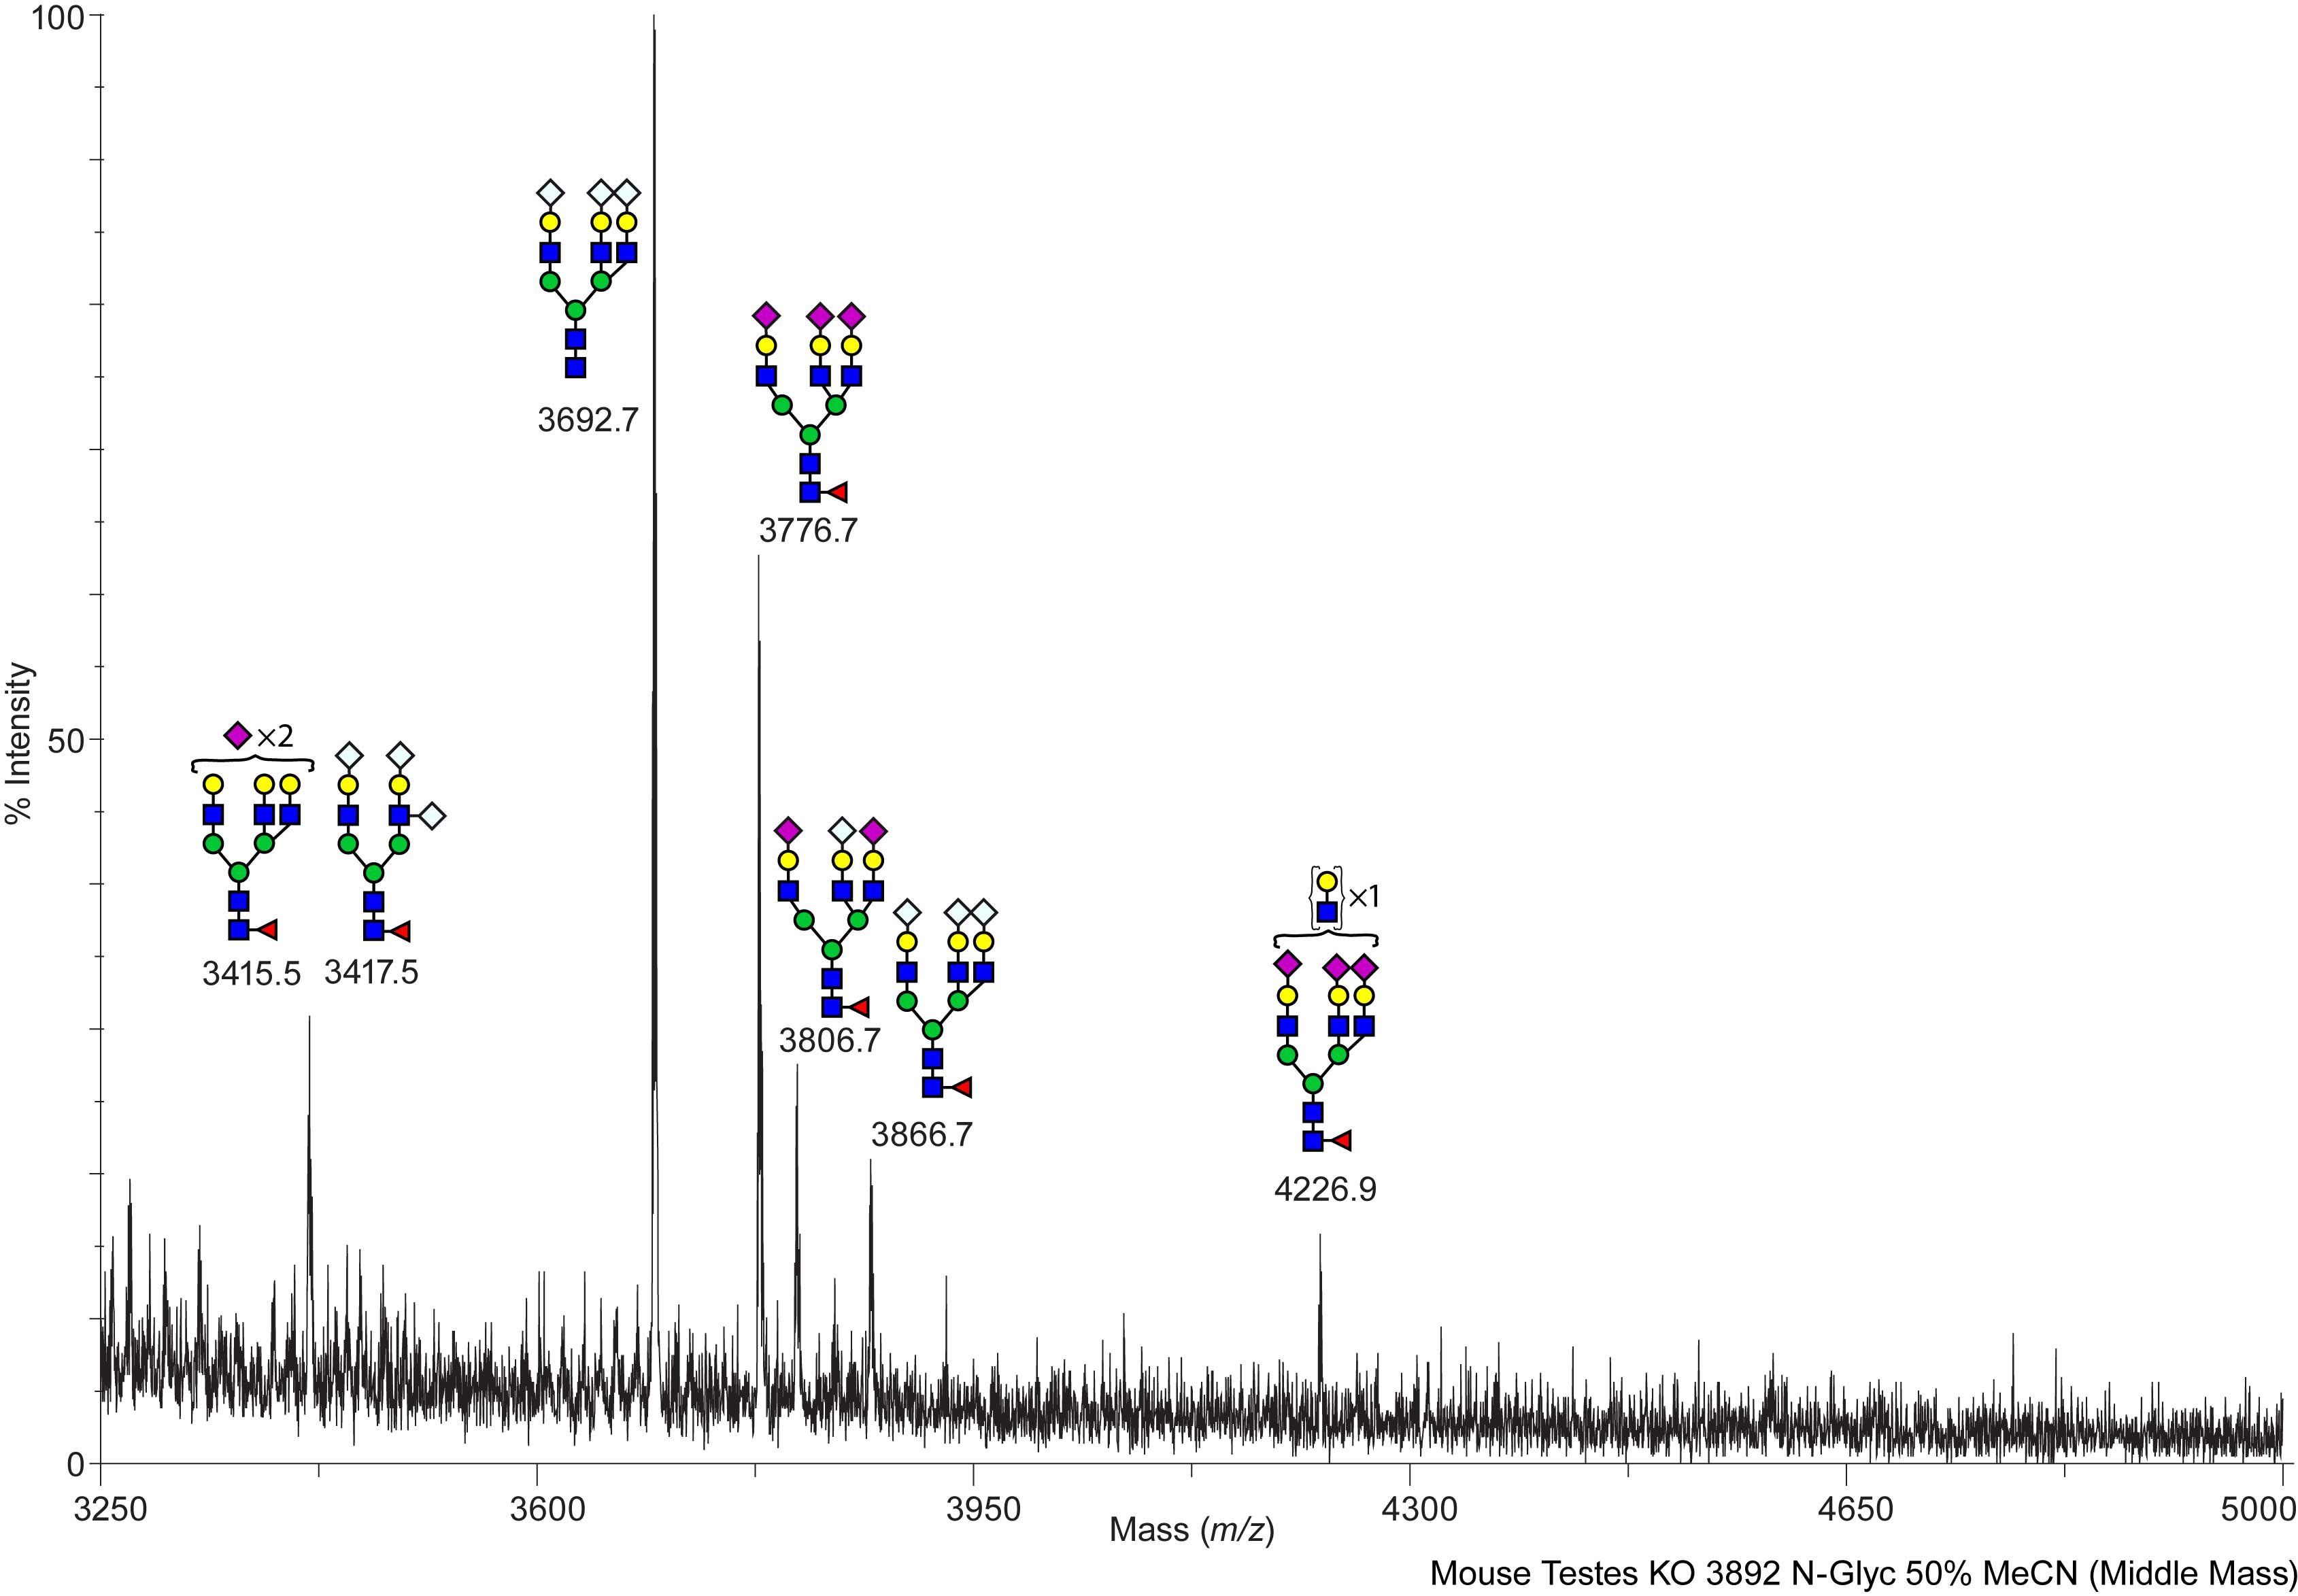
SS-D Mouse ST6GalNAc-II (-/-) Testes Testes ST6GalNAc-II KO (-/-), 3892, NG N-Linked C57BL/6 View experimental details      
Annotated file for lower mass range in JPG formatAnnotated file for higher mass range in JPG format Annotated file for lower mass range in PDF formatAnnotated file for higher mass range in PDF format
View Mass Spectrum data as text      
cfg_rRequest_2118
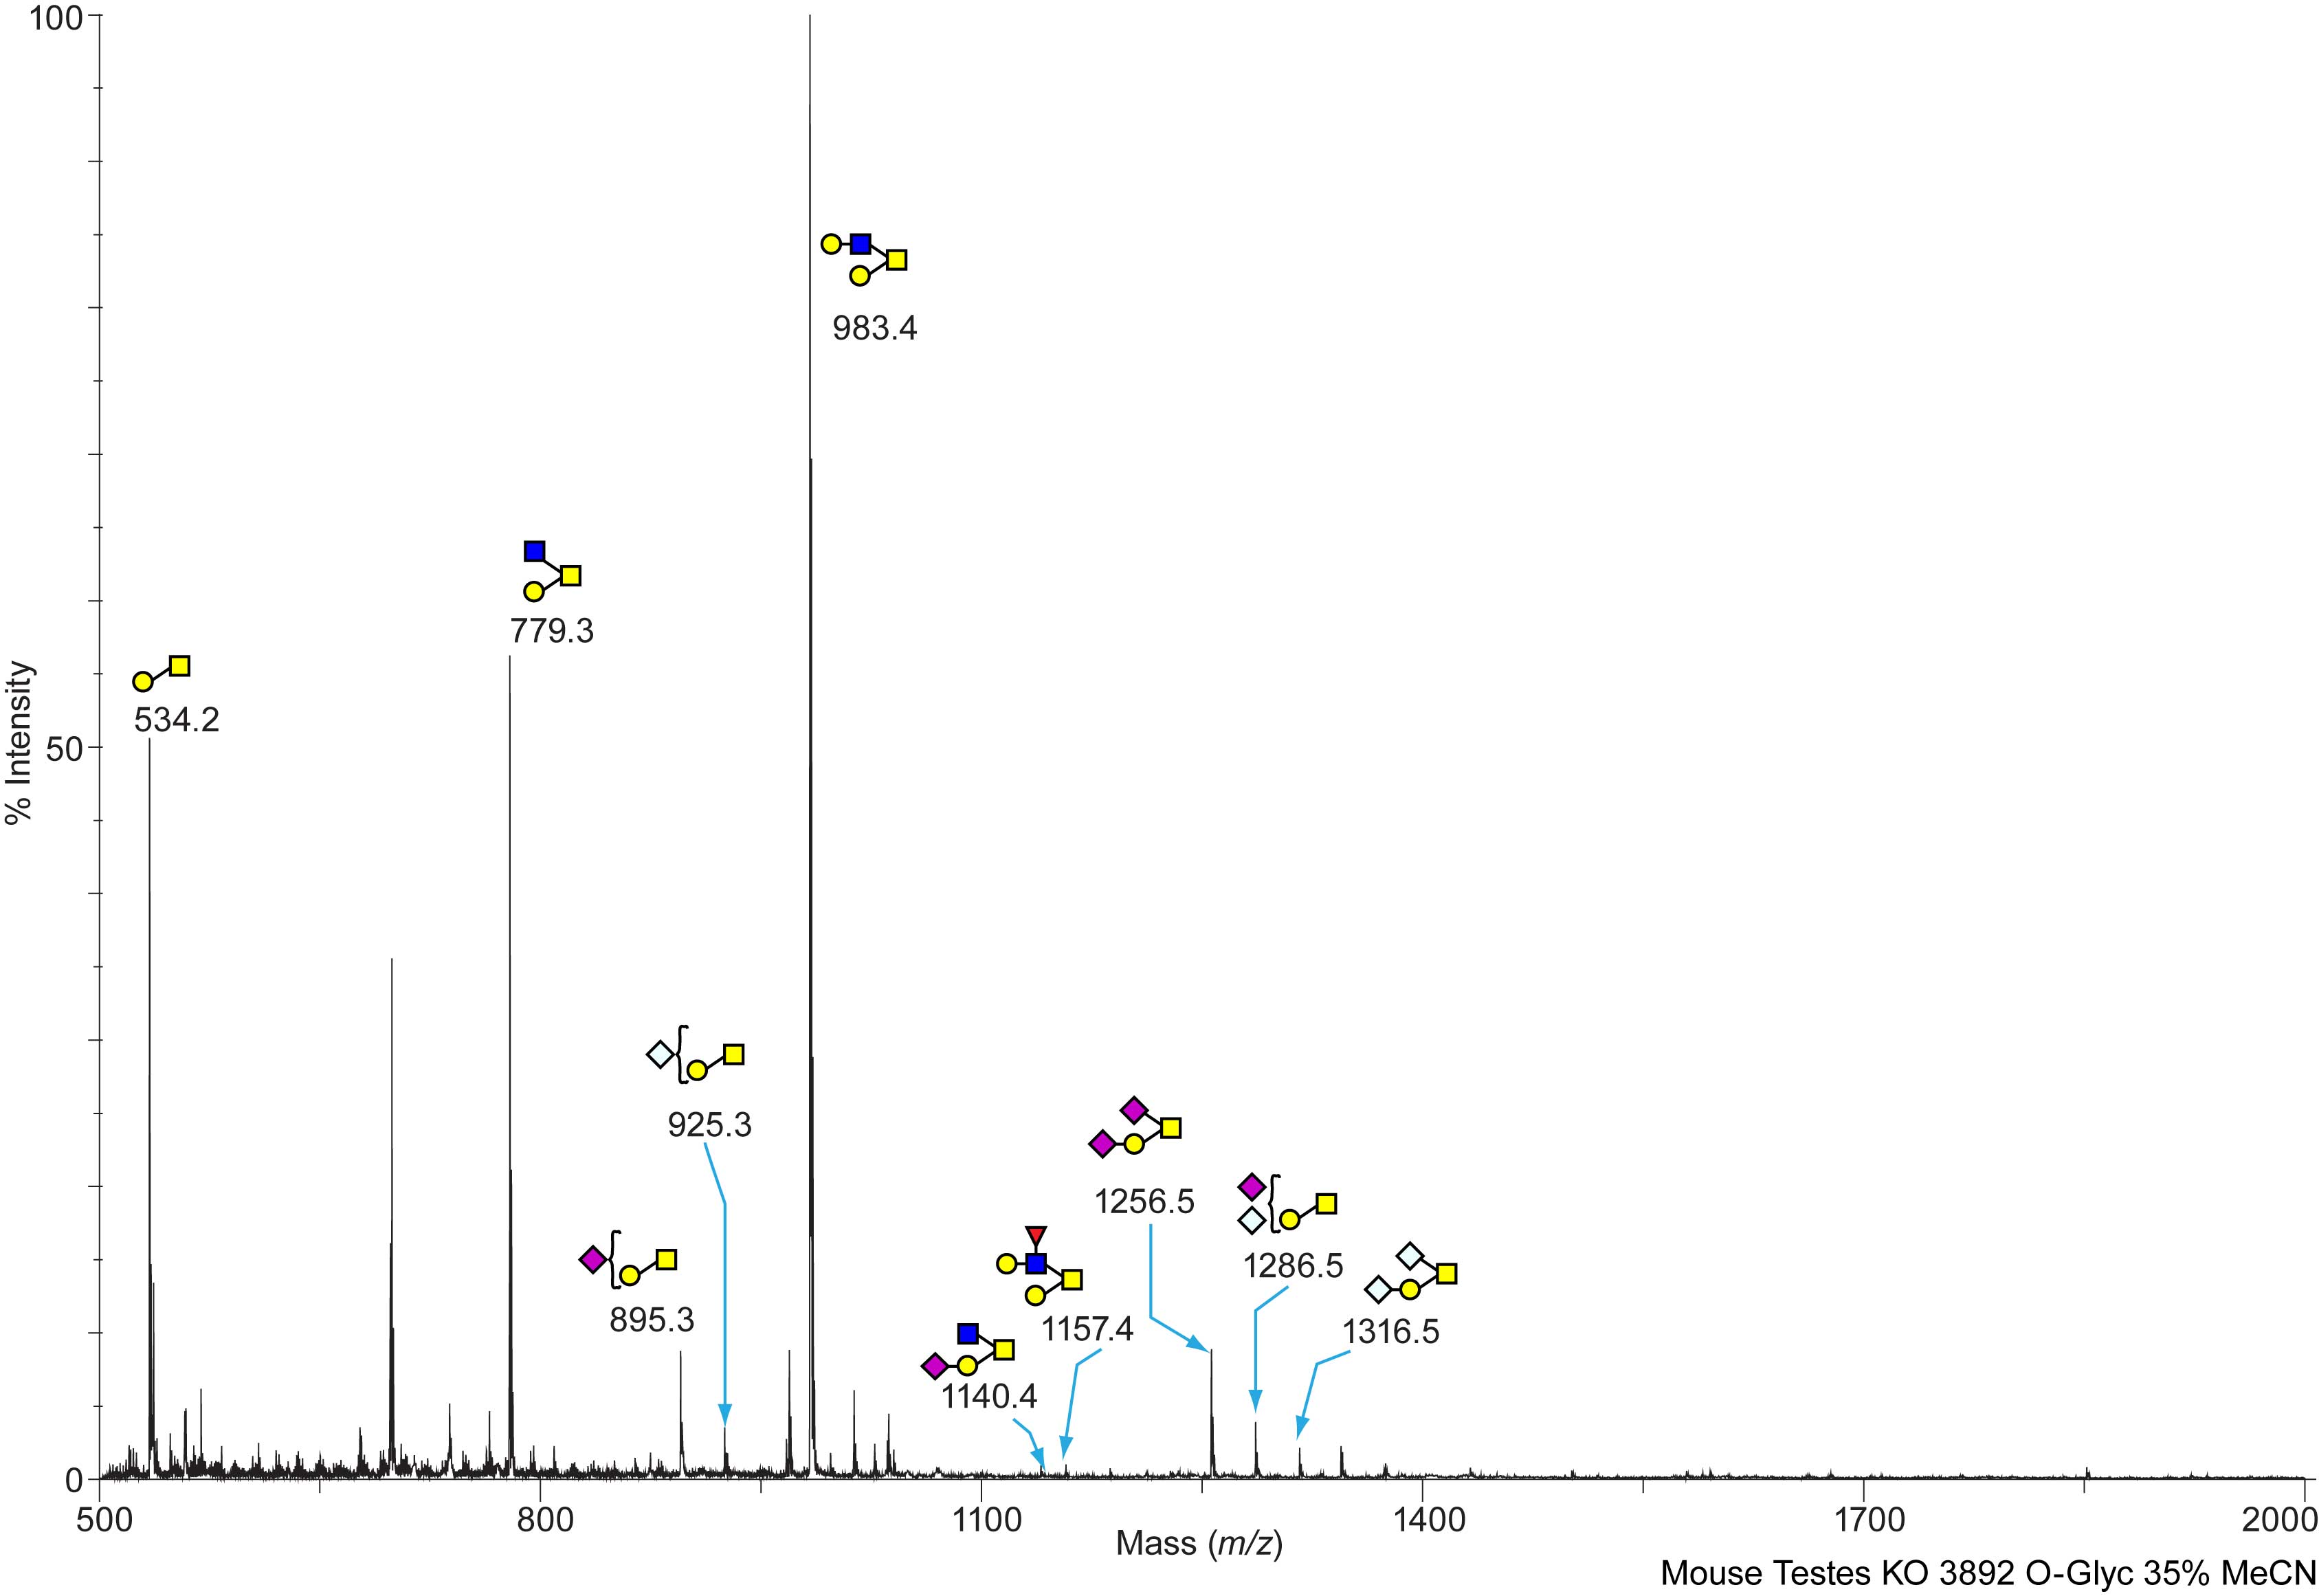
SS-D Mouse ST6GalNAc-II (-/-) Testes Testes ST6GalNAc-II KO (-/-), 3892, OG O-Linked C57BL/6 View experimental details      
Annotated file in JPG format Annotated file in PDF format
View Mass Spectrum data as text View Mass Peak file   Interactive Mass Spectrum Viewer
cfg_rRequest_2118
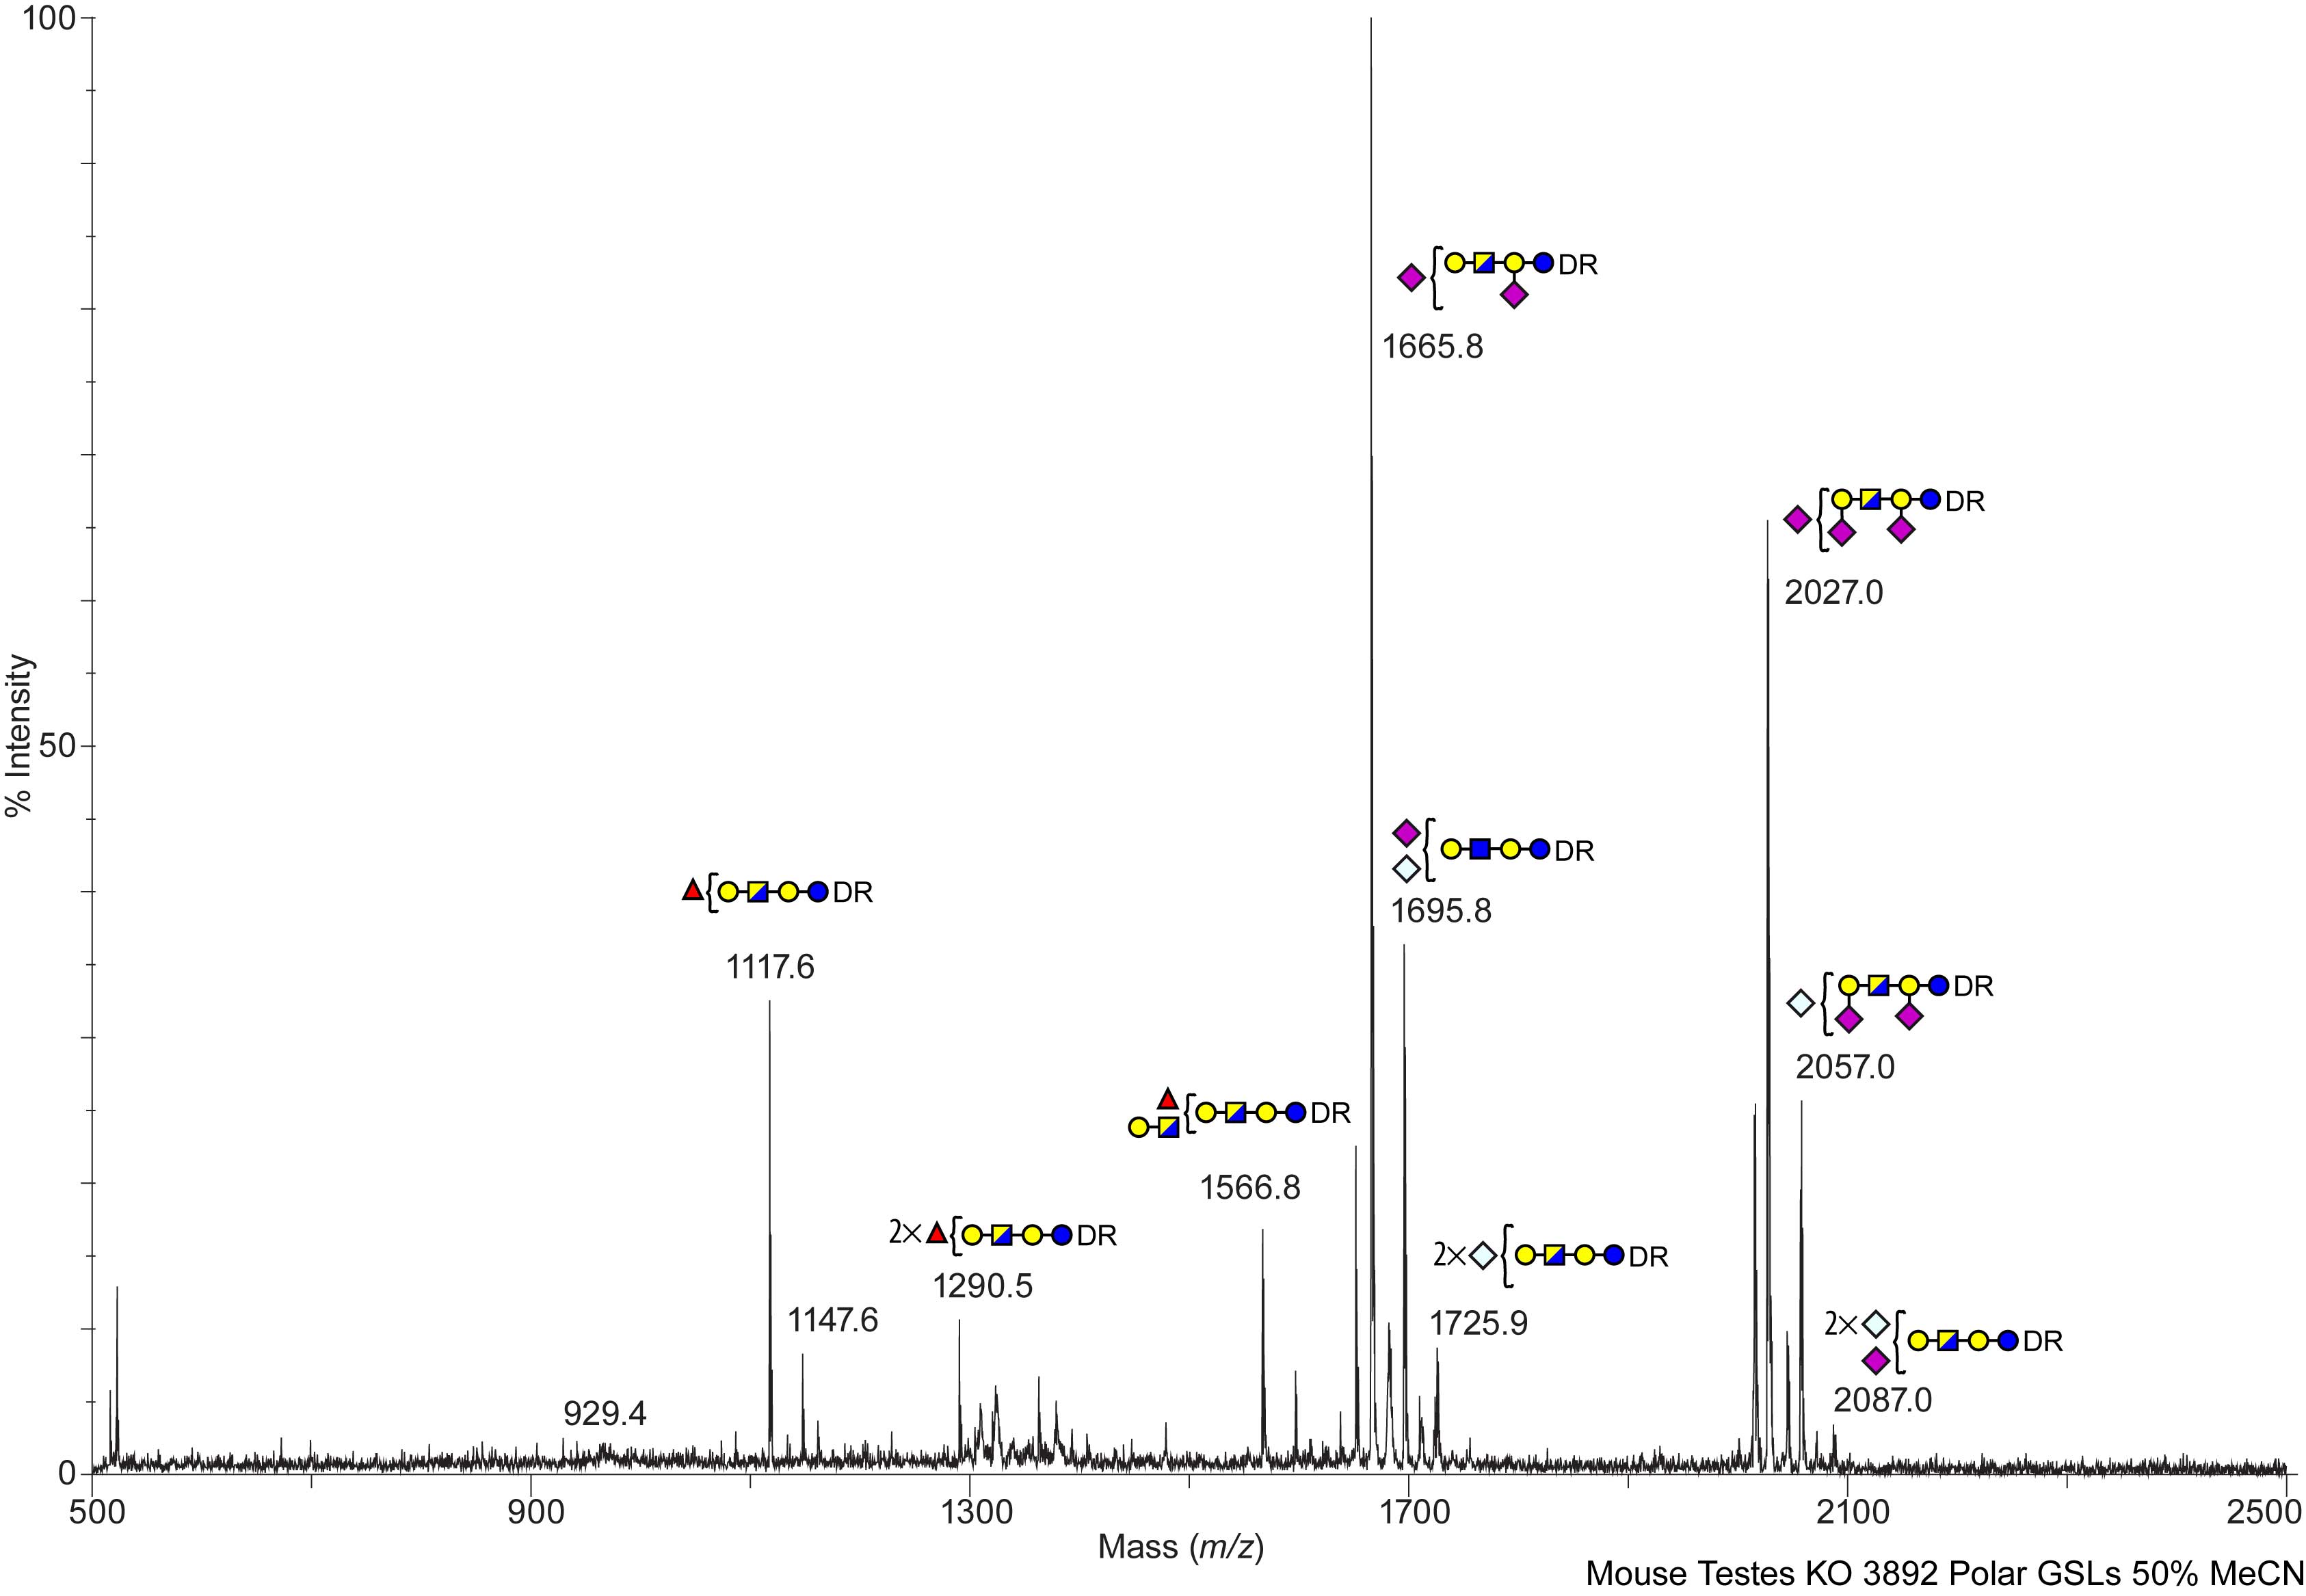
SS-D Mouse ST6GalNAc-II (-/-) Testes Testes ST6GalNAc-II KO (-/-), 3892, PGL Polar Glycolipids C57BL/6 View experimental details      
Annotated file in JPG format Annotated file in PDF format
View Mass Spectrum data as text View Mass Peak file   Interactive Mass Spectrum Viewer
cfg_rRequest_2118
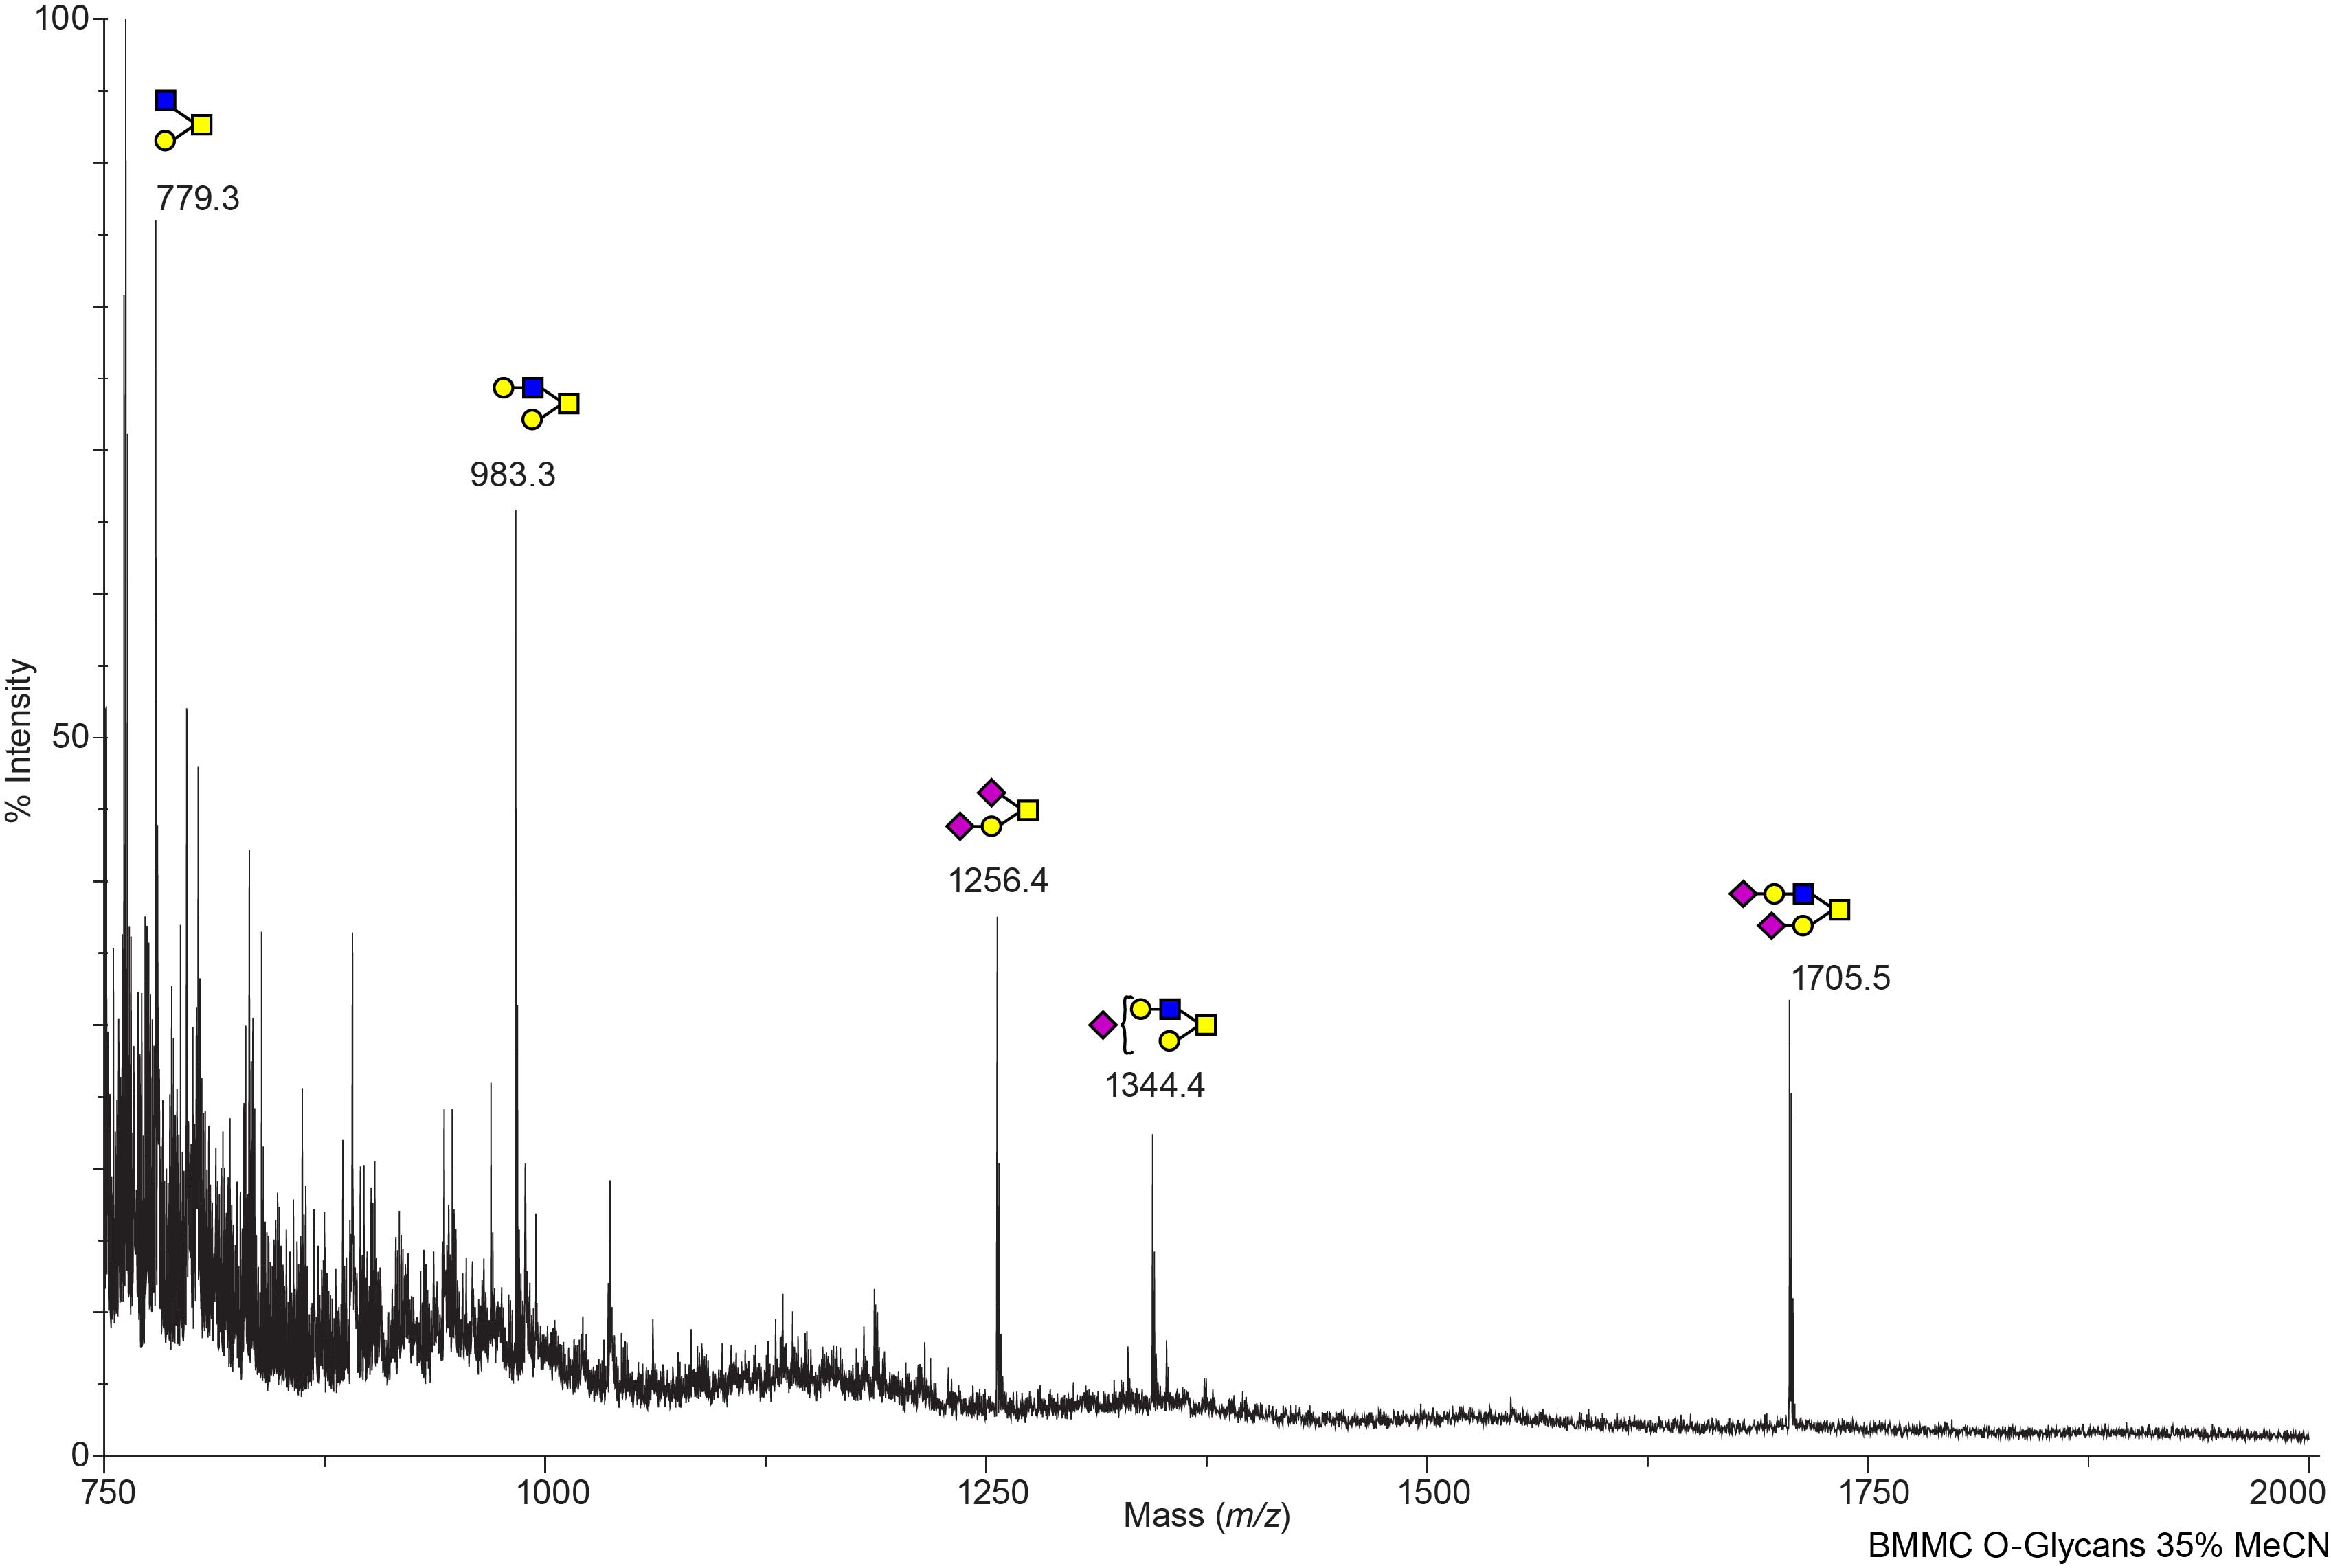
Human Bone marrow mast cells (BMMC), control (rpt), NG N-Linked Liu, FuTong View experimental details      
Annotated file in JPG format Annotated file in PDF format
View Mass Spectrum data as text View Mass Peak file   Interactive Mass Spectrum Viewer
cfg_rRequest_1477
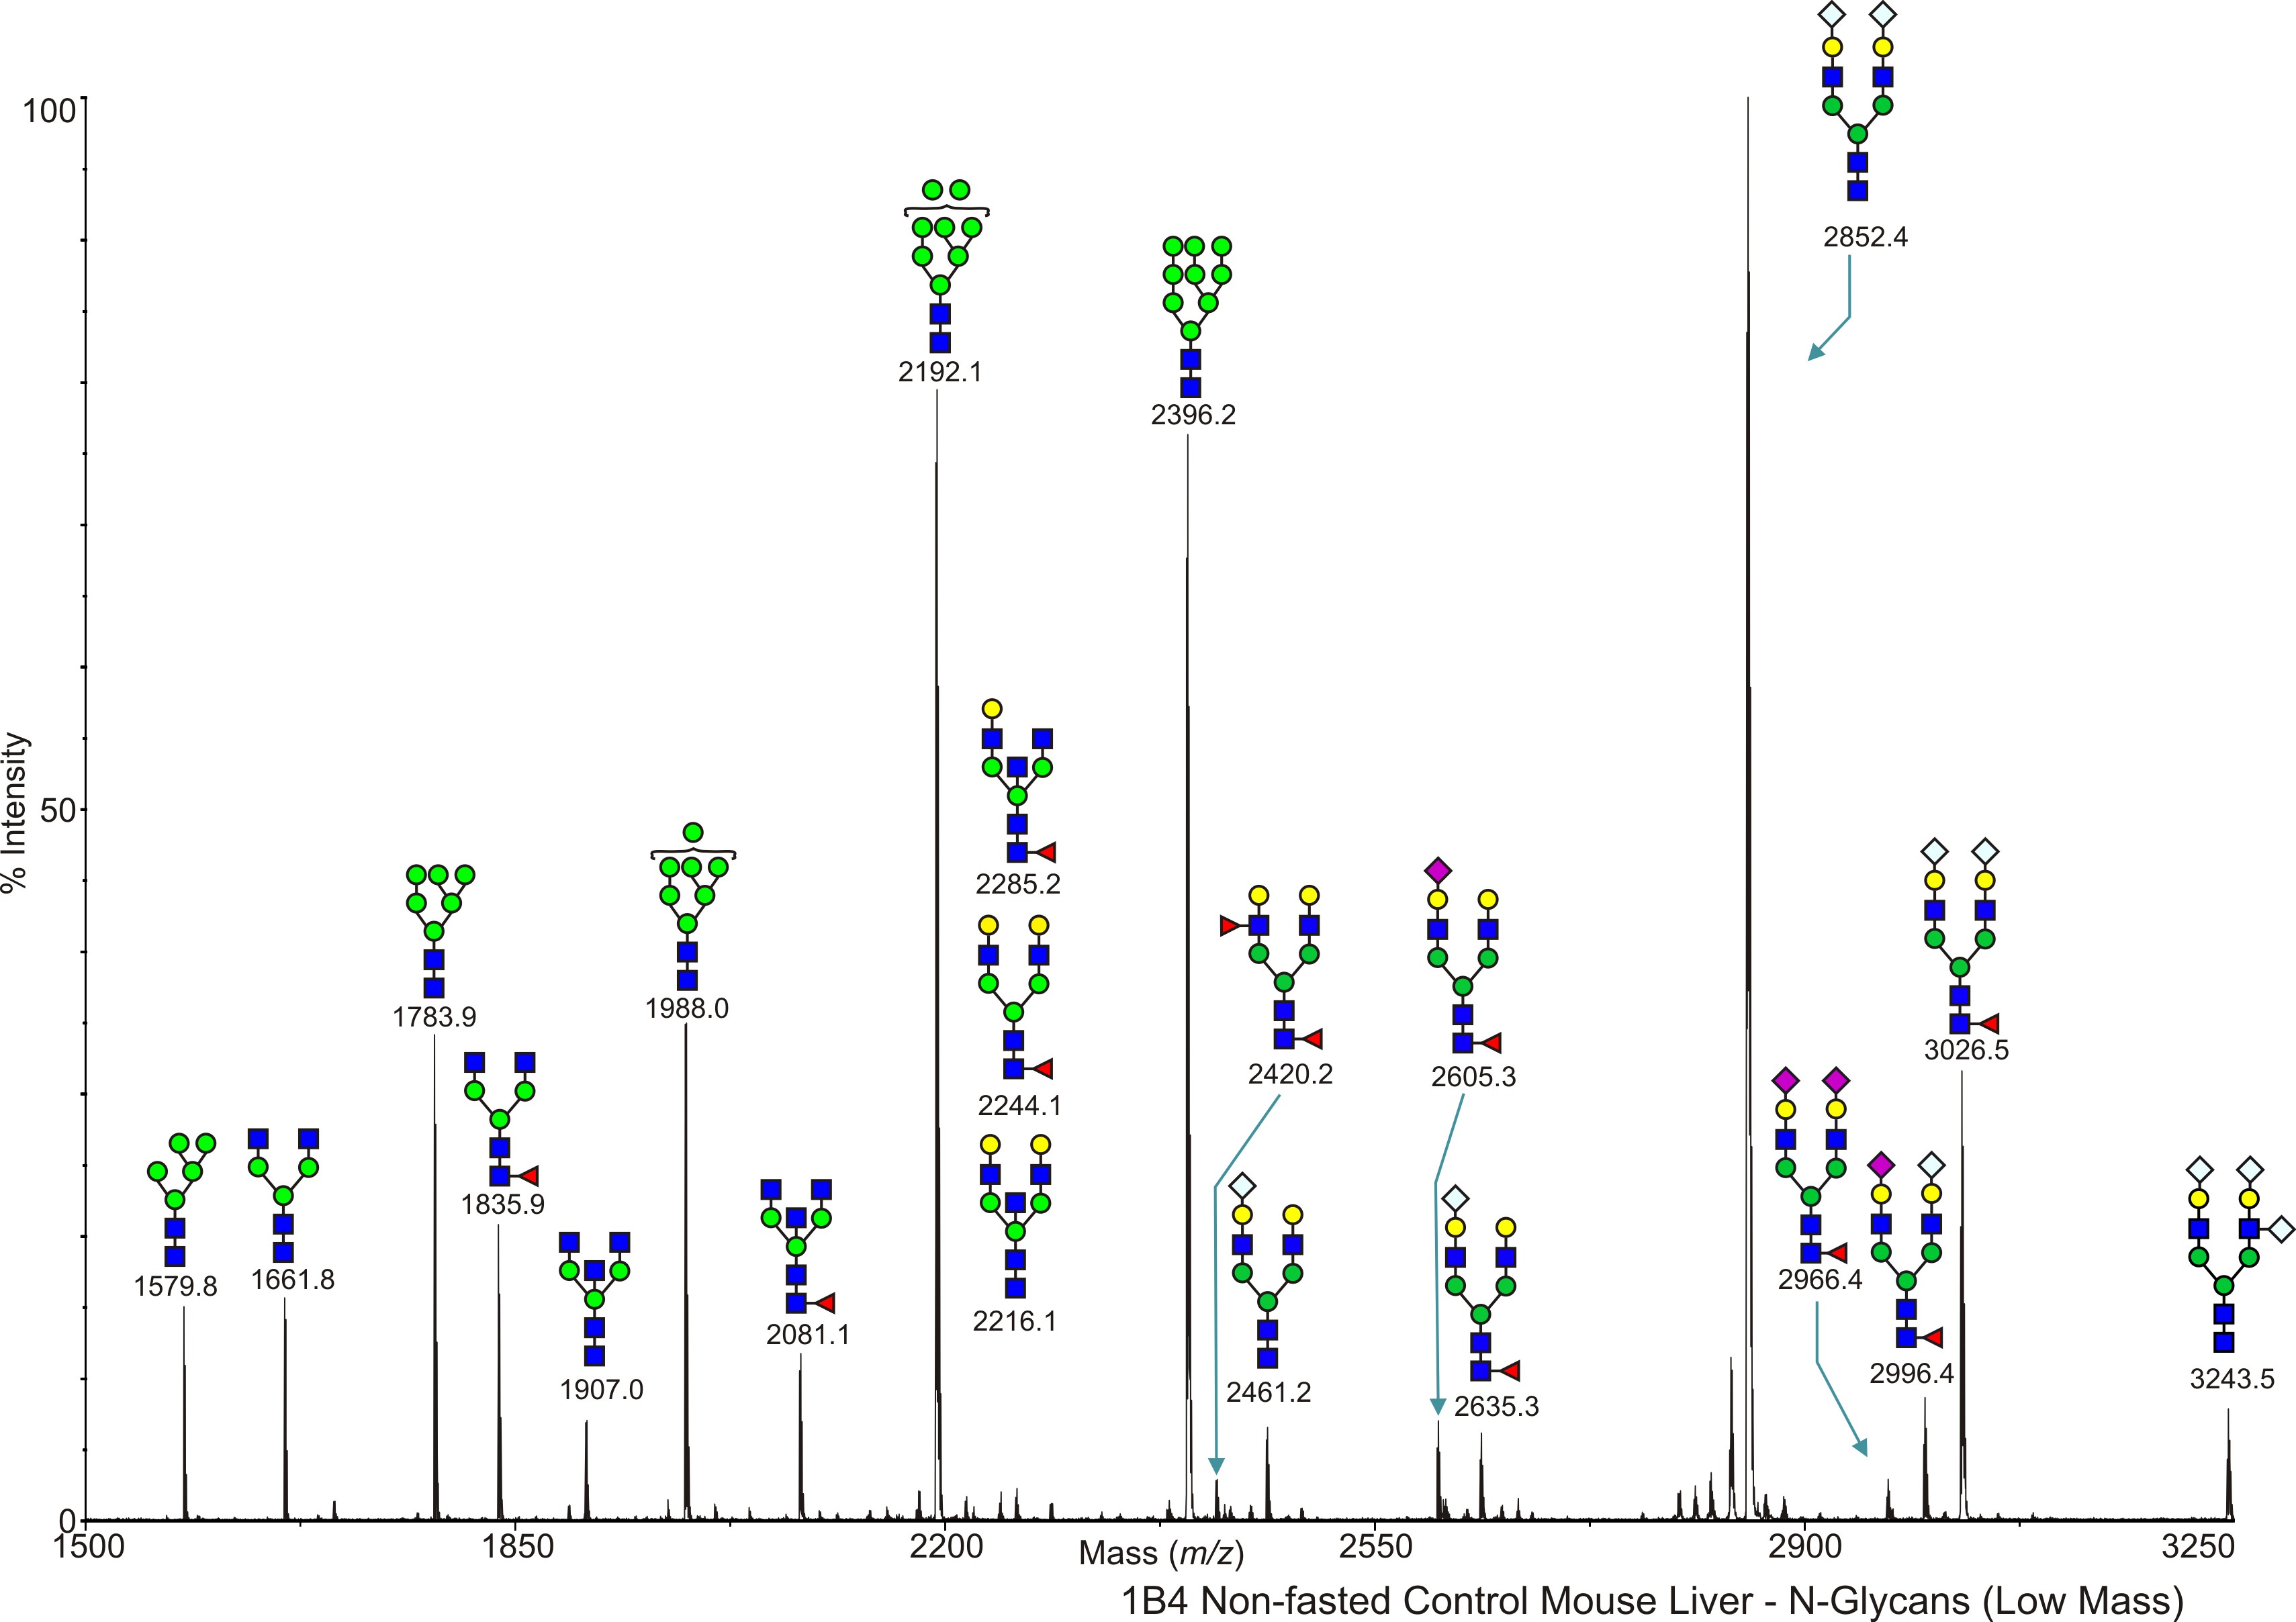
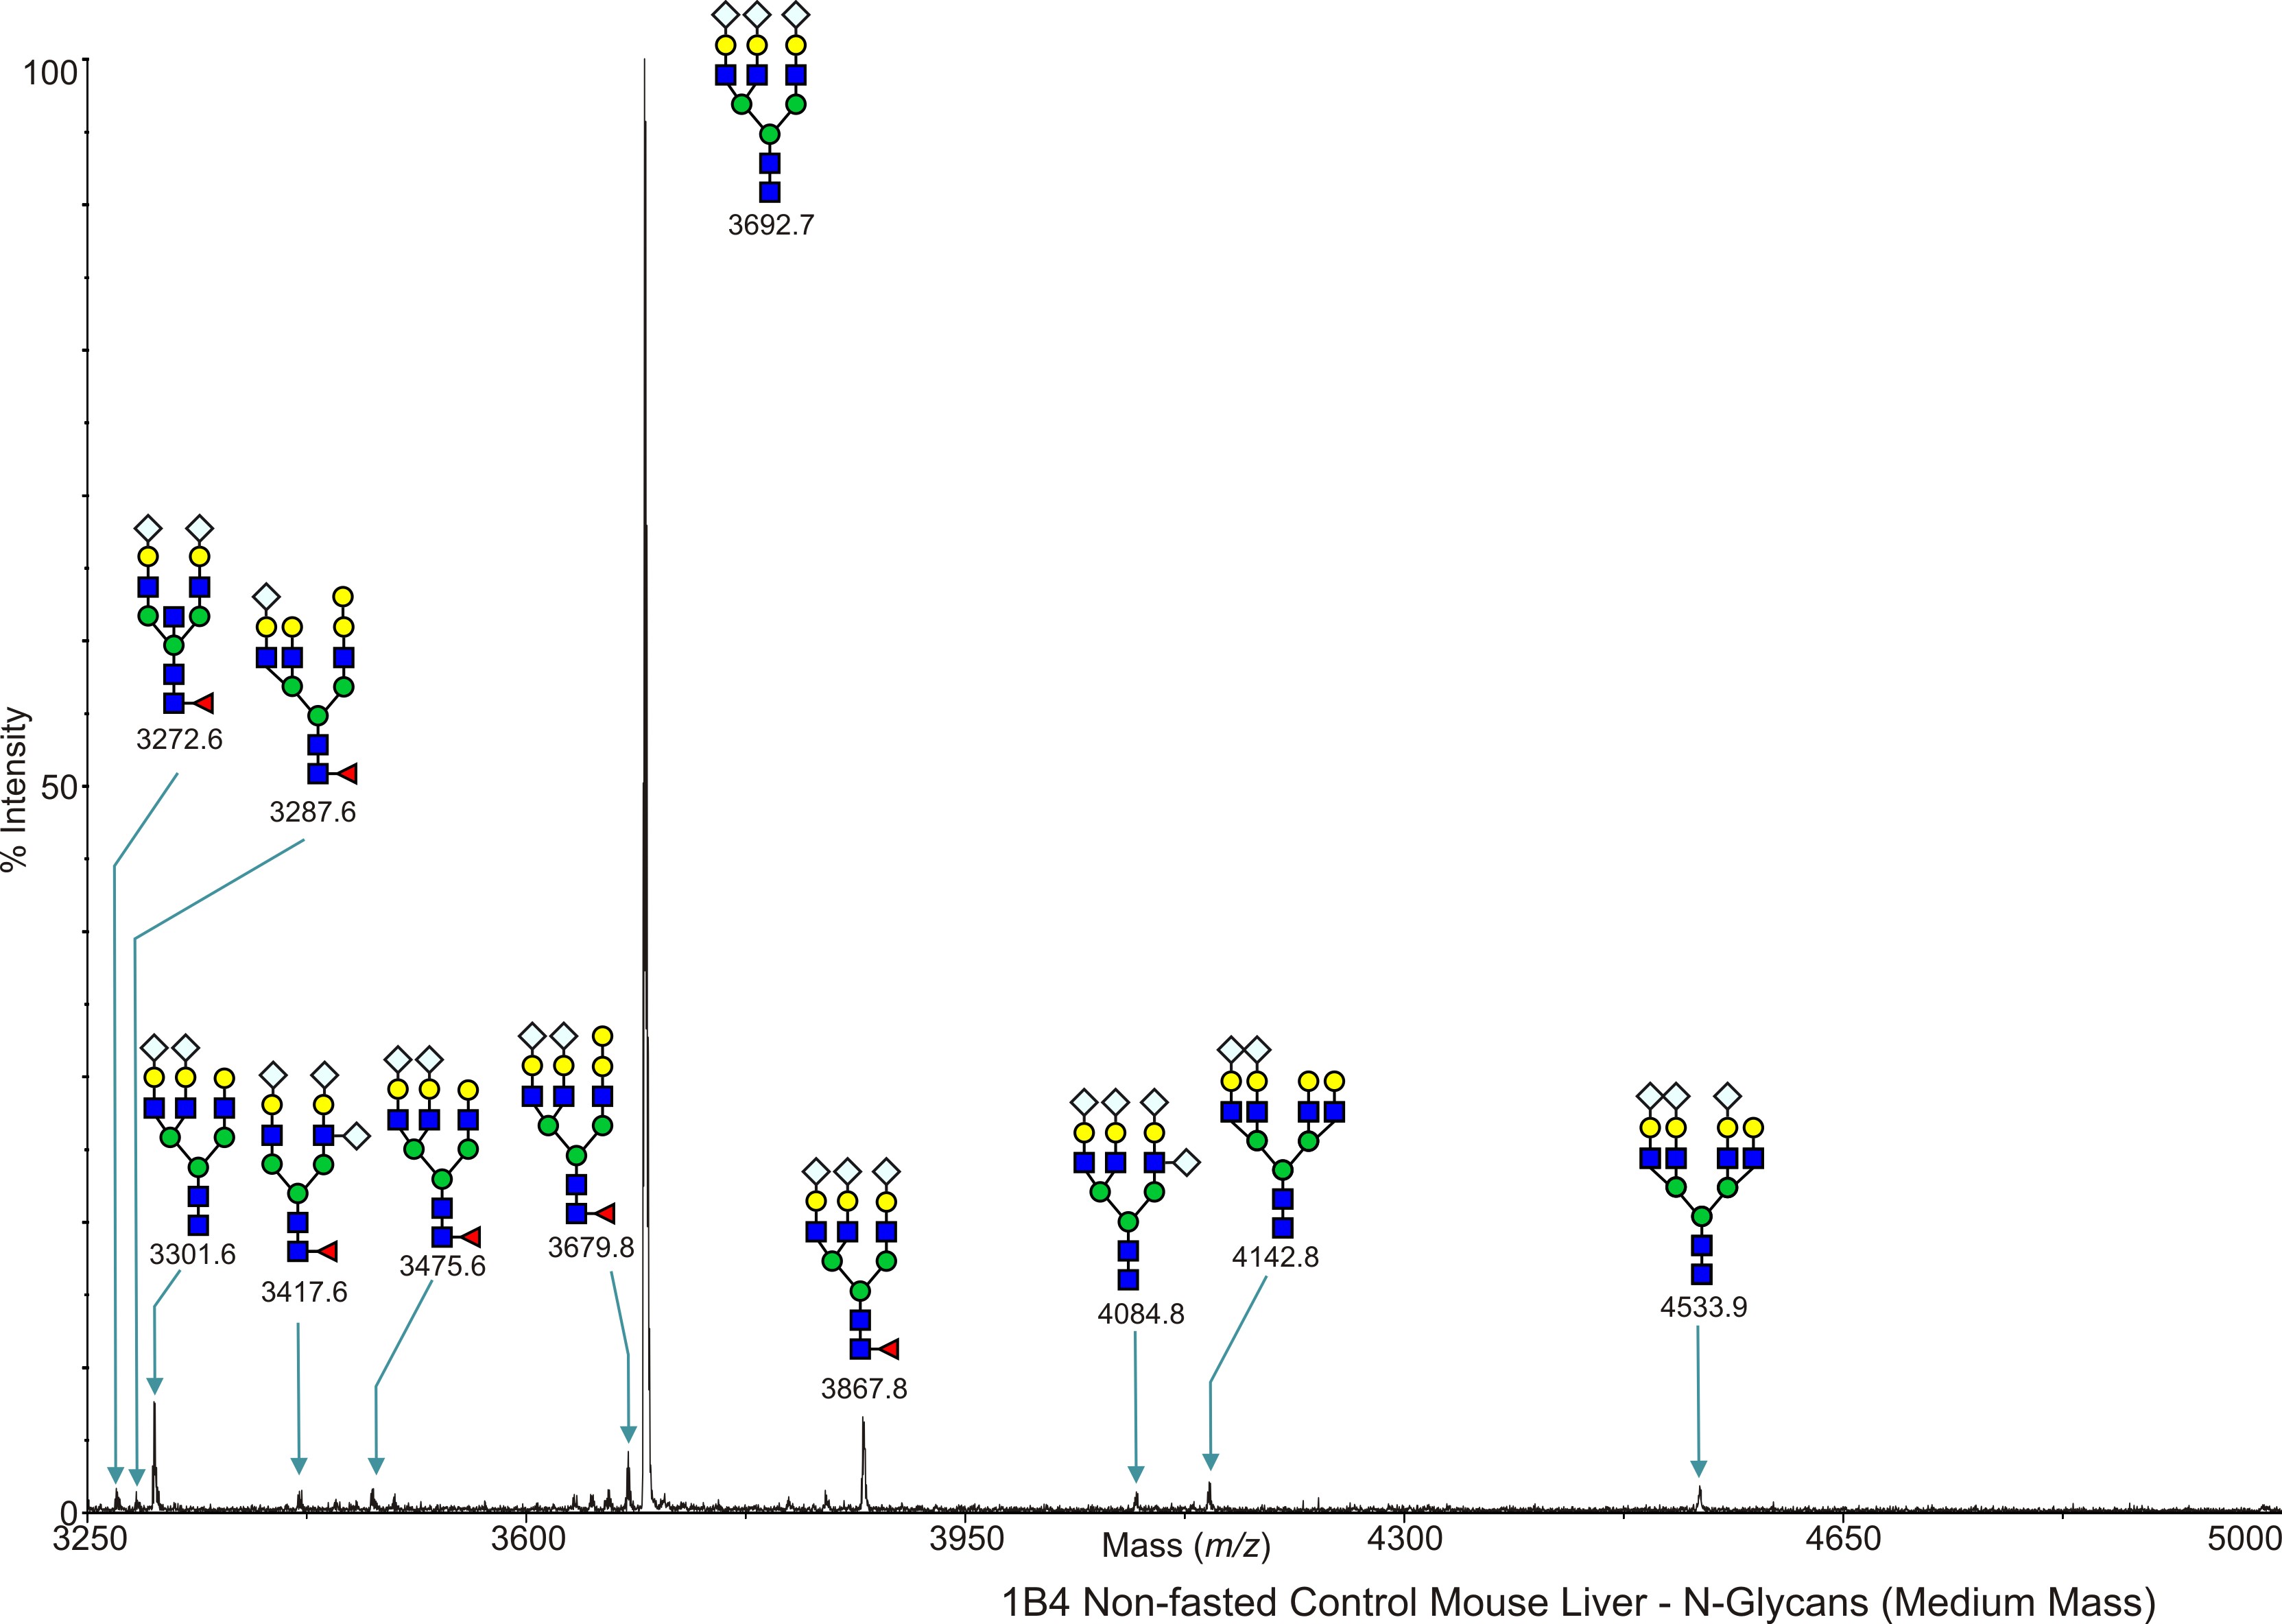
Mouse Liver 1B4-Non-fasted high fat diet control mouse liver, NG N-Linked Dennis, James W. View experimental details      
Annotated file for lower mass range in JPG formatAnnotated file for higher mass range in JPG format Annotated file for lower mass range in PDF formatAnnotated file for higher mass range in PDF format
View Mass Spectrum data as text View Mass Peak file   Interactive Mass Spectrum Viewer
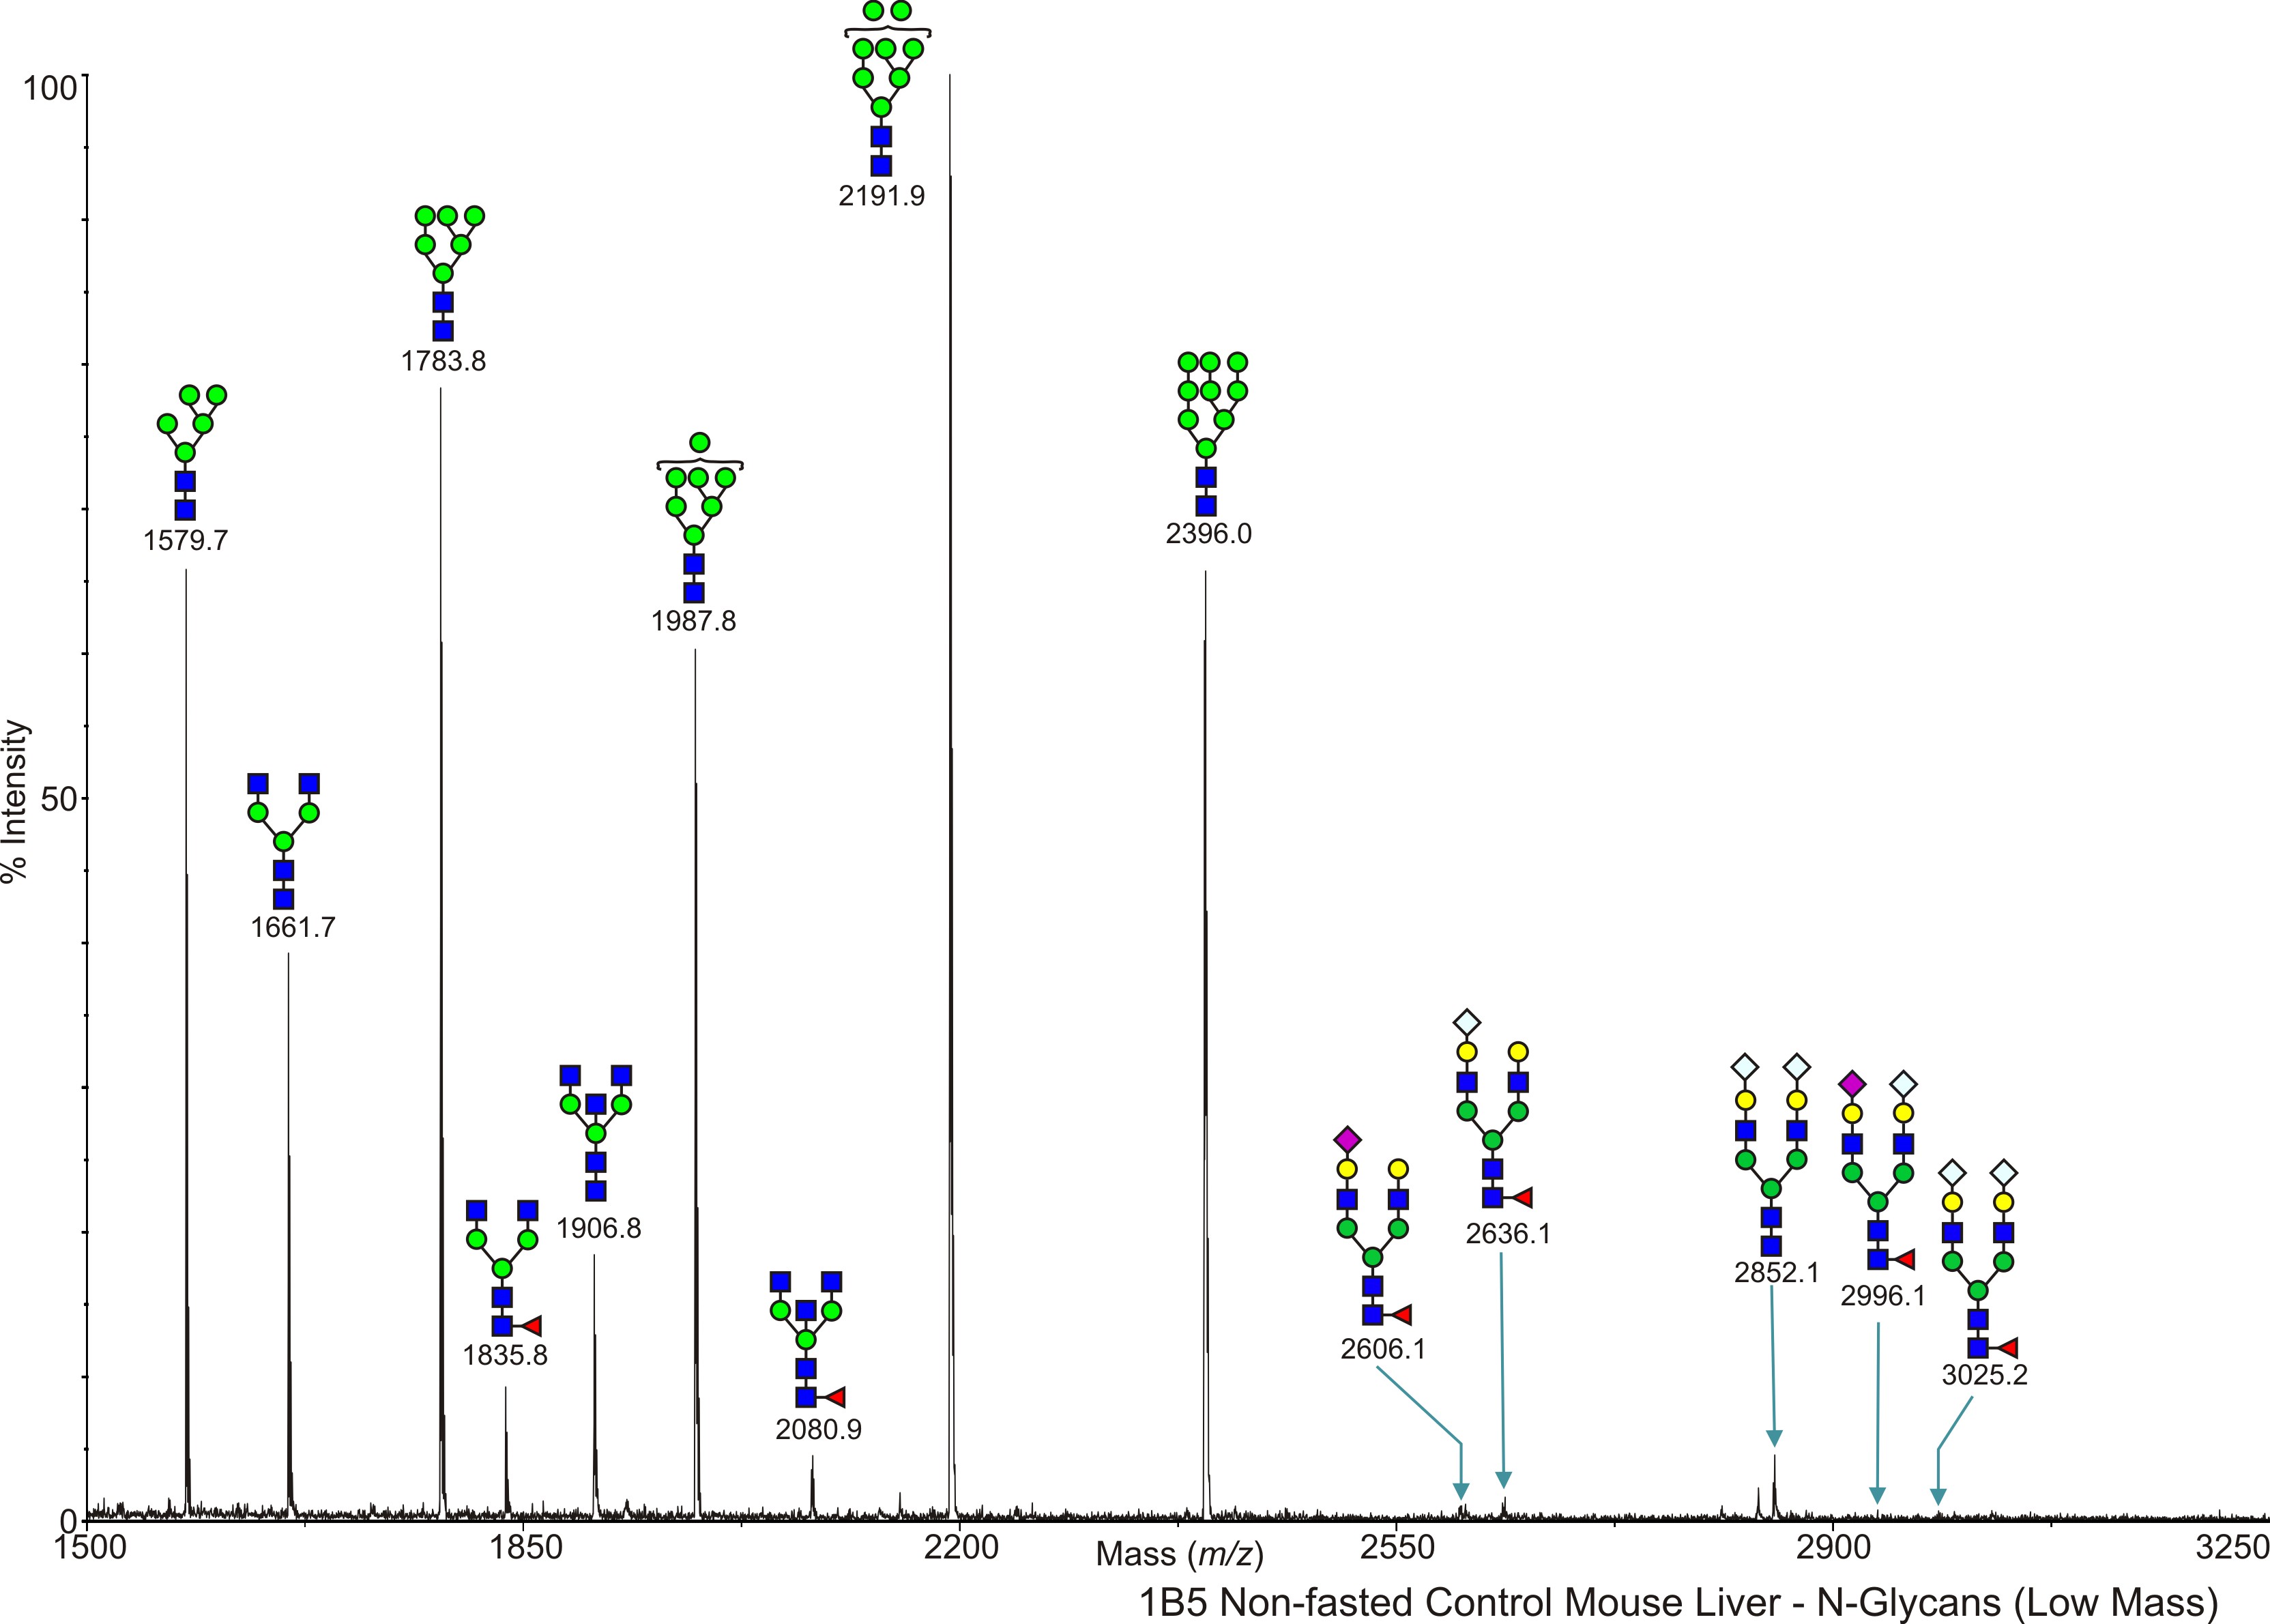
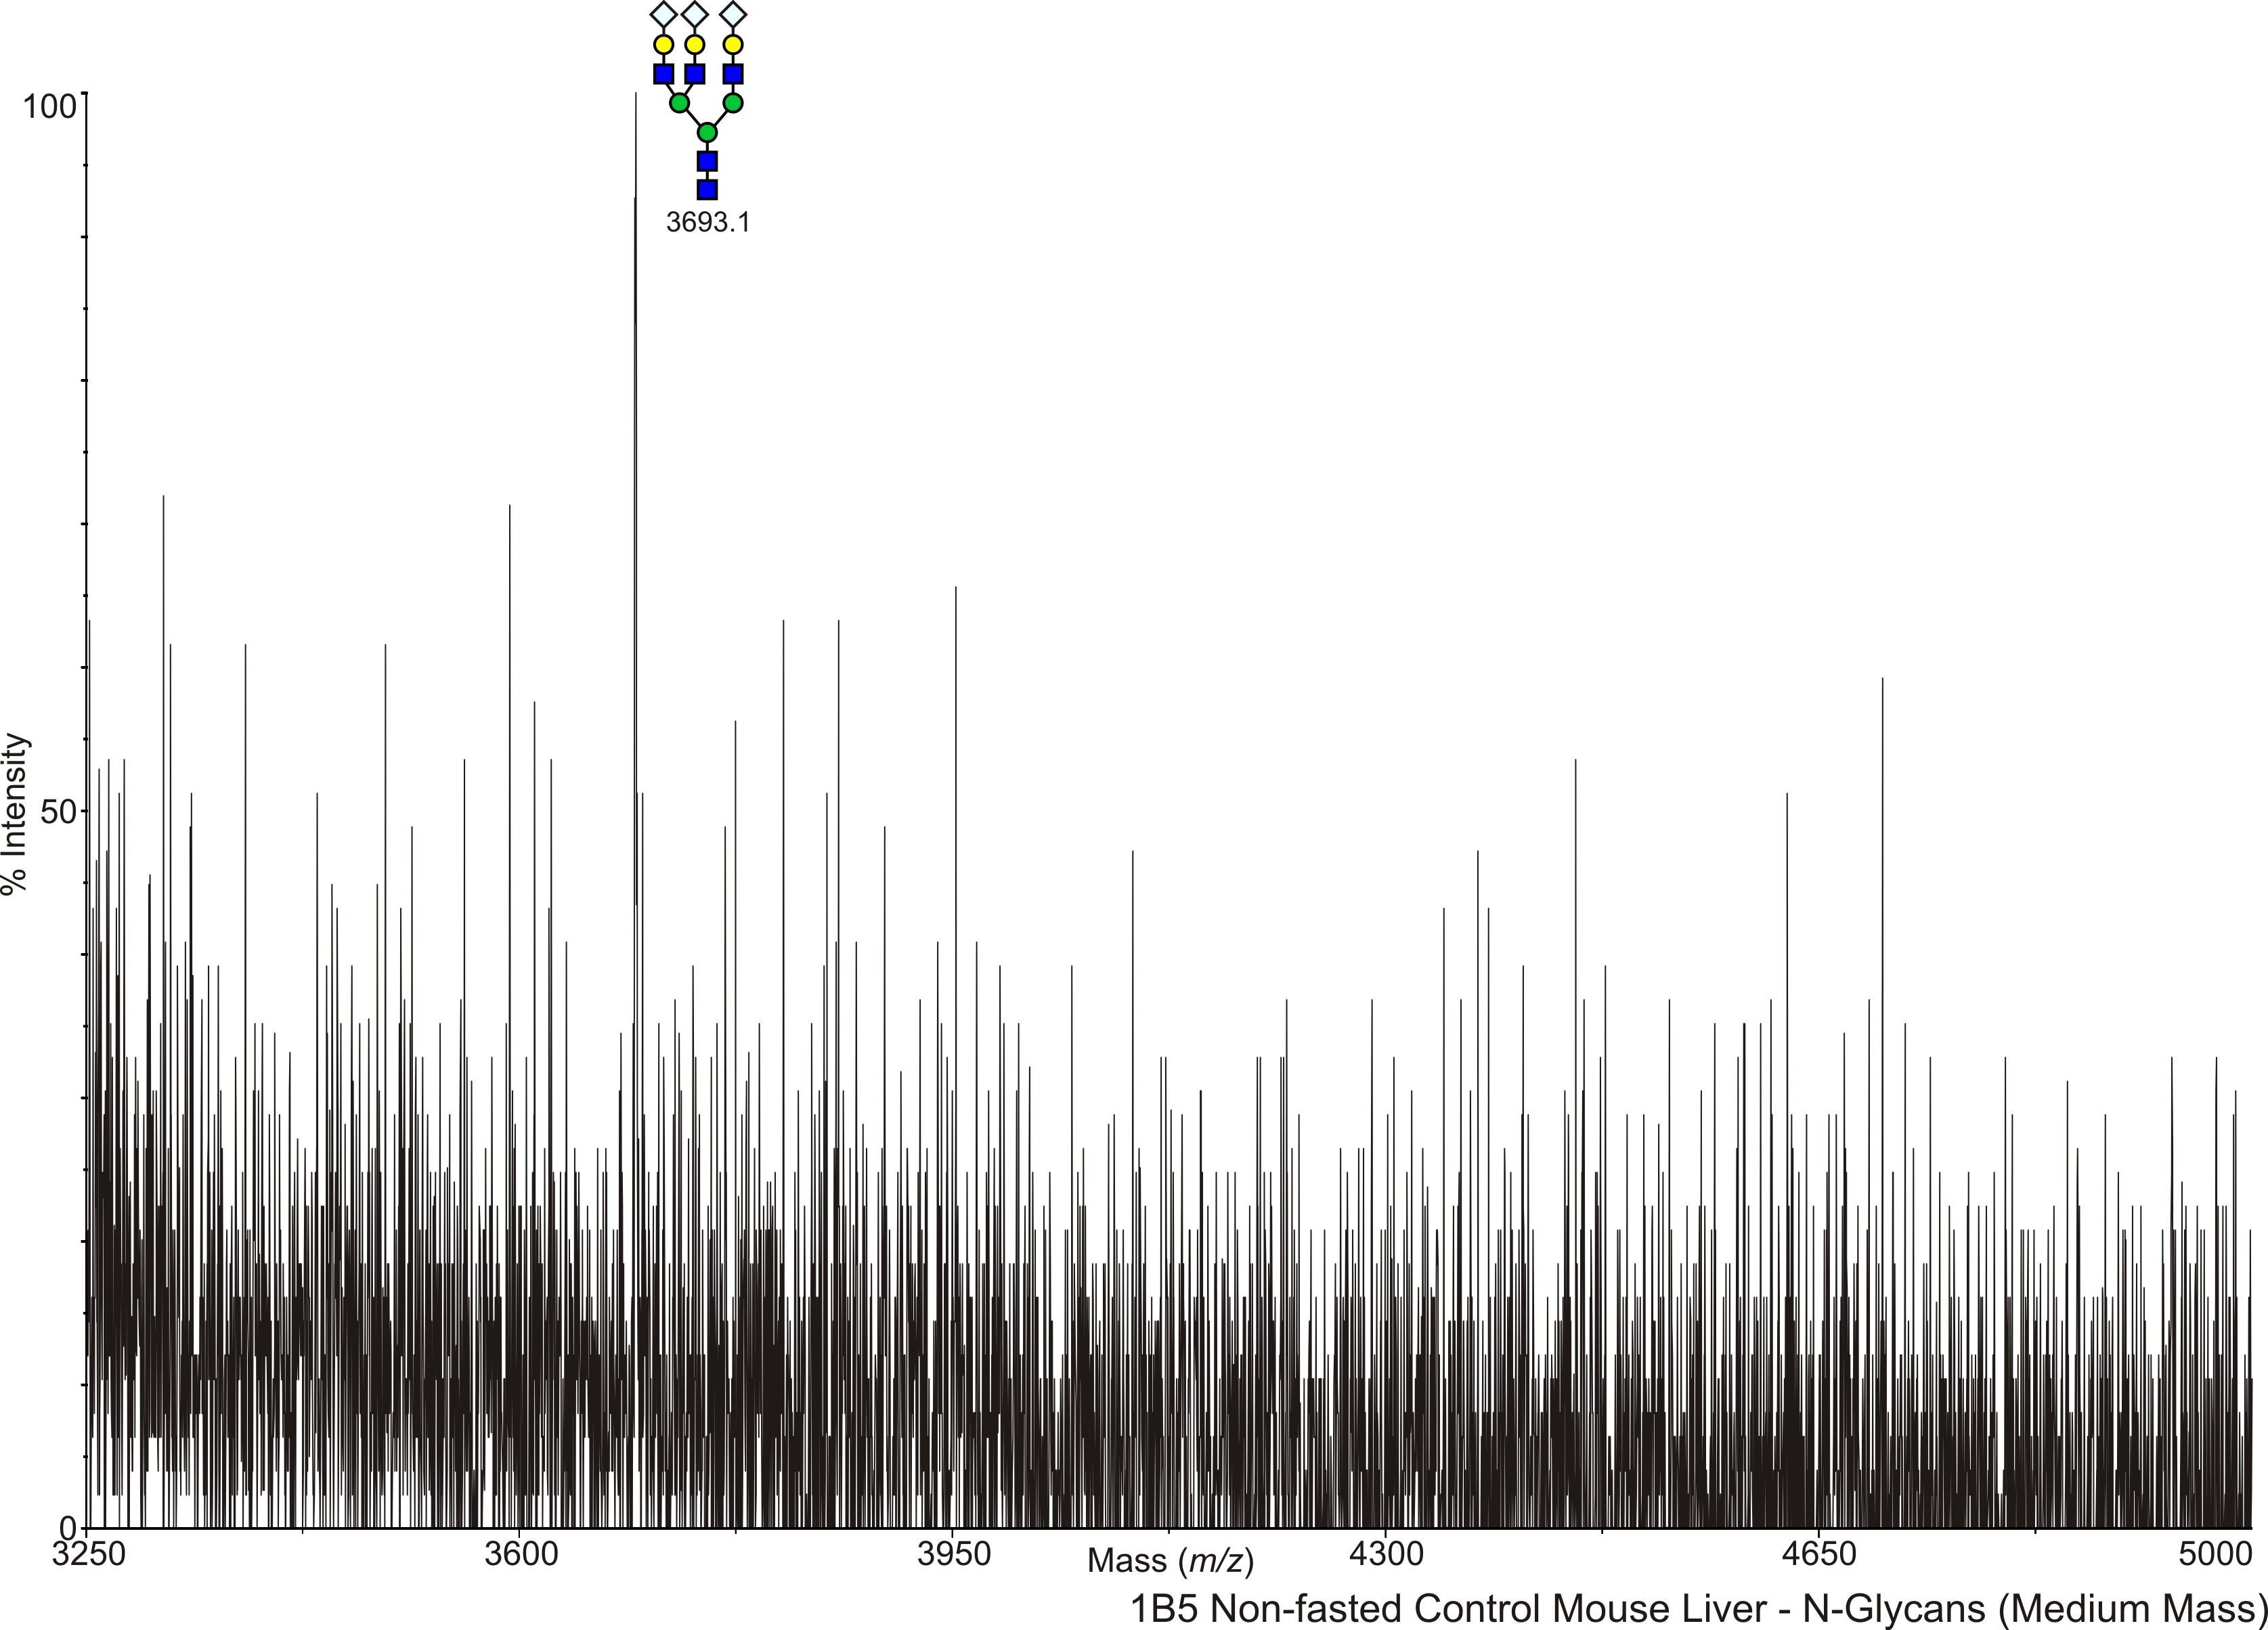
Mouse Liver 1B5-Non-fasted high fat diet control mouse liver, NG N-Linked Dennis, James W. View experimental details      
Annotated file for lower mass range in JPG formatAnnotated file for higher mass range in JPG format Annotated file for lower mass range in PDF formatAnnotated file for higher mass range in PDF format
View Mass Spectrum data as text View Mass Peak file   Interactive Mass Spectrum Viewer
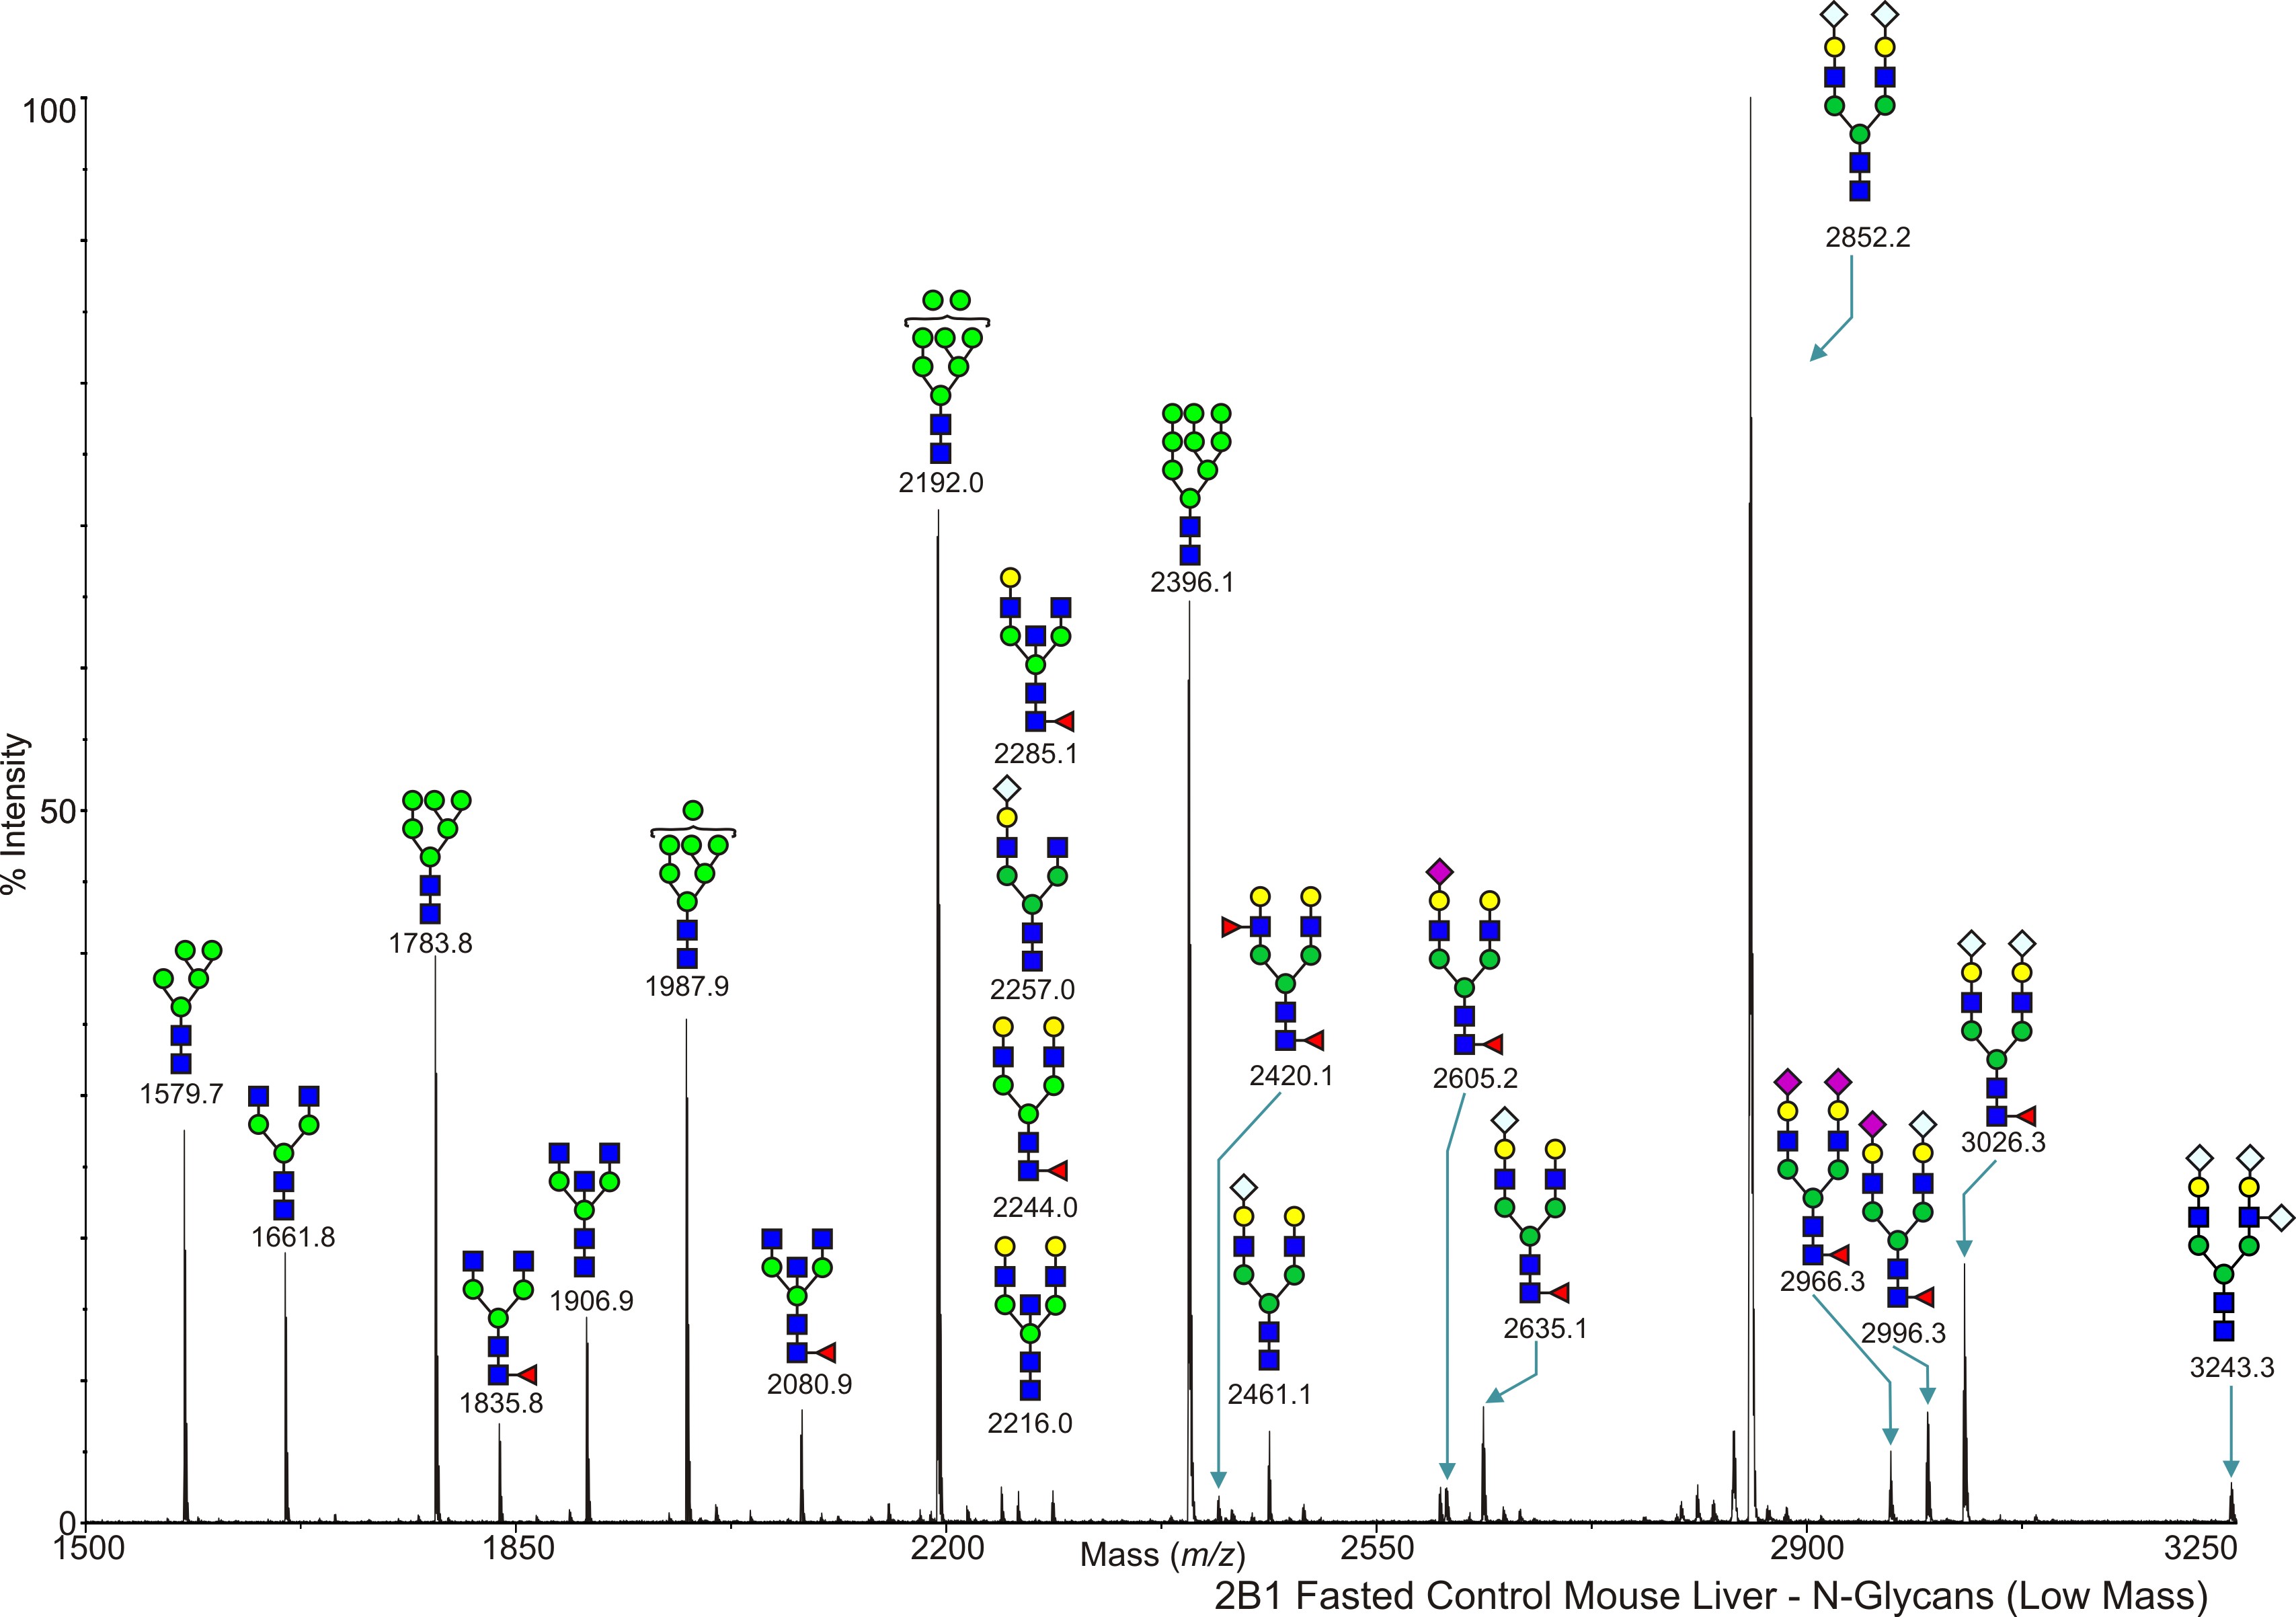
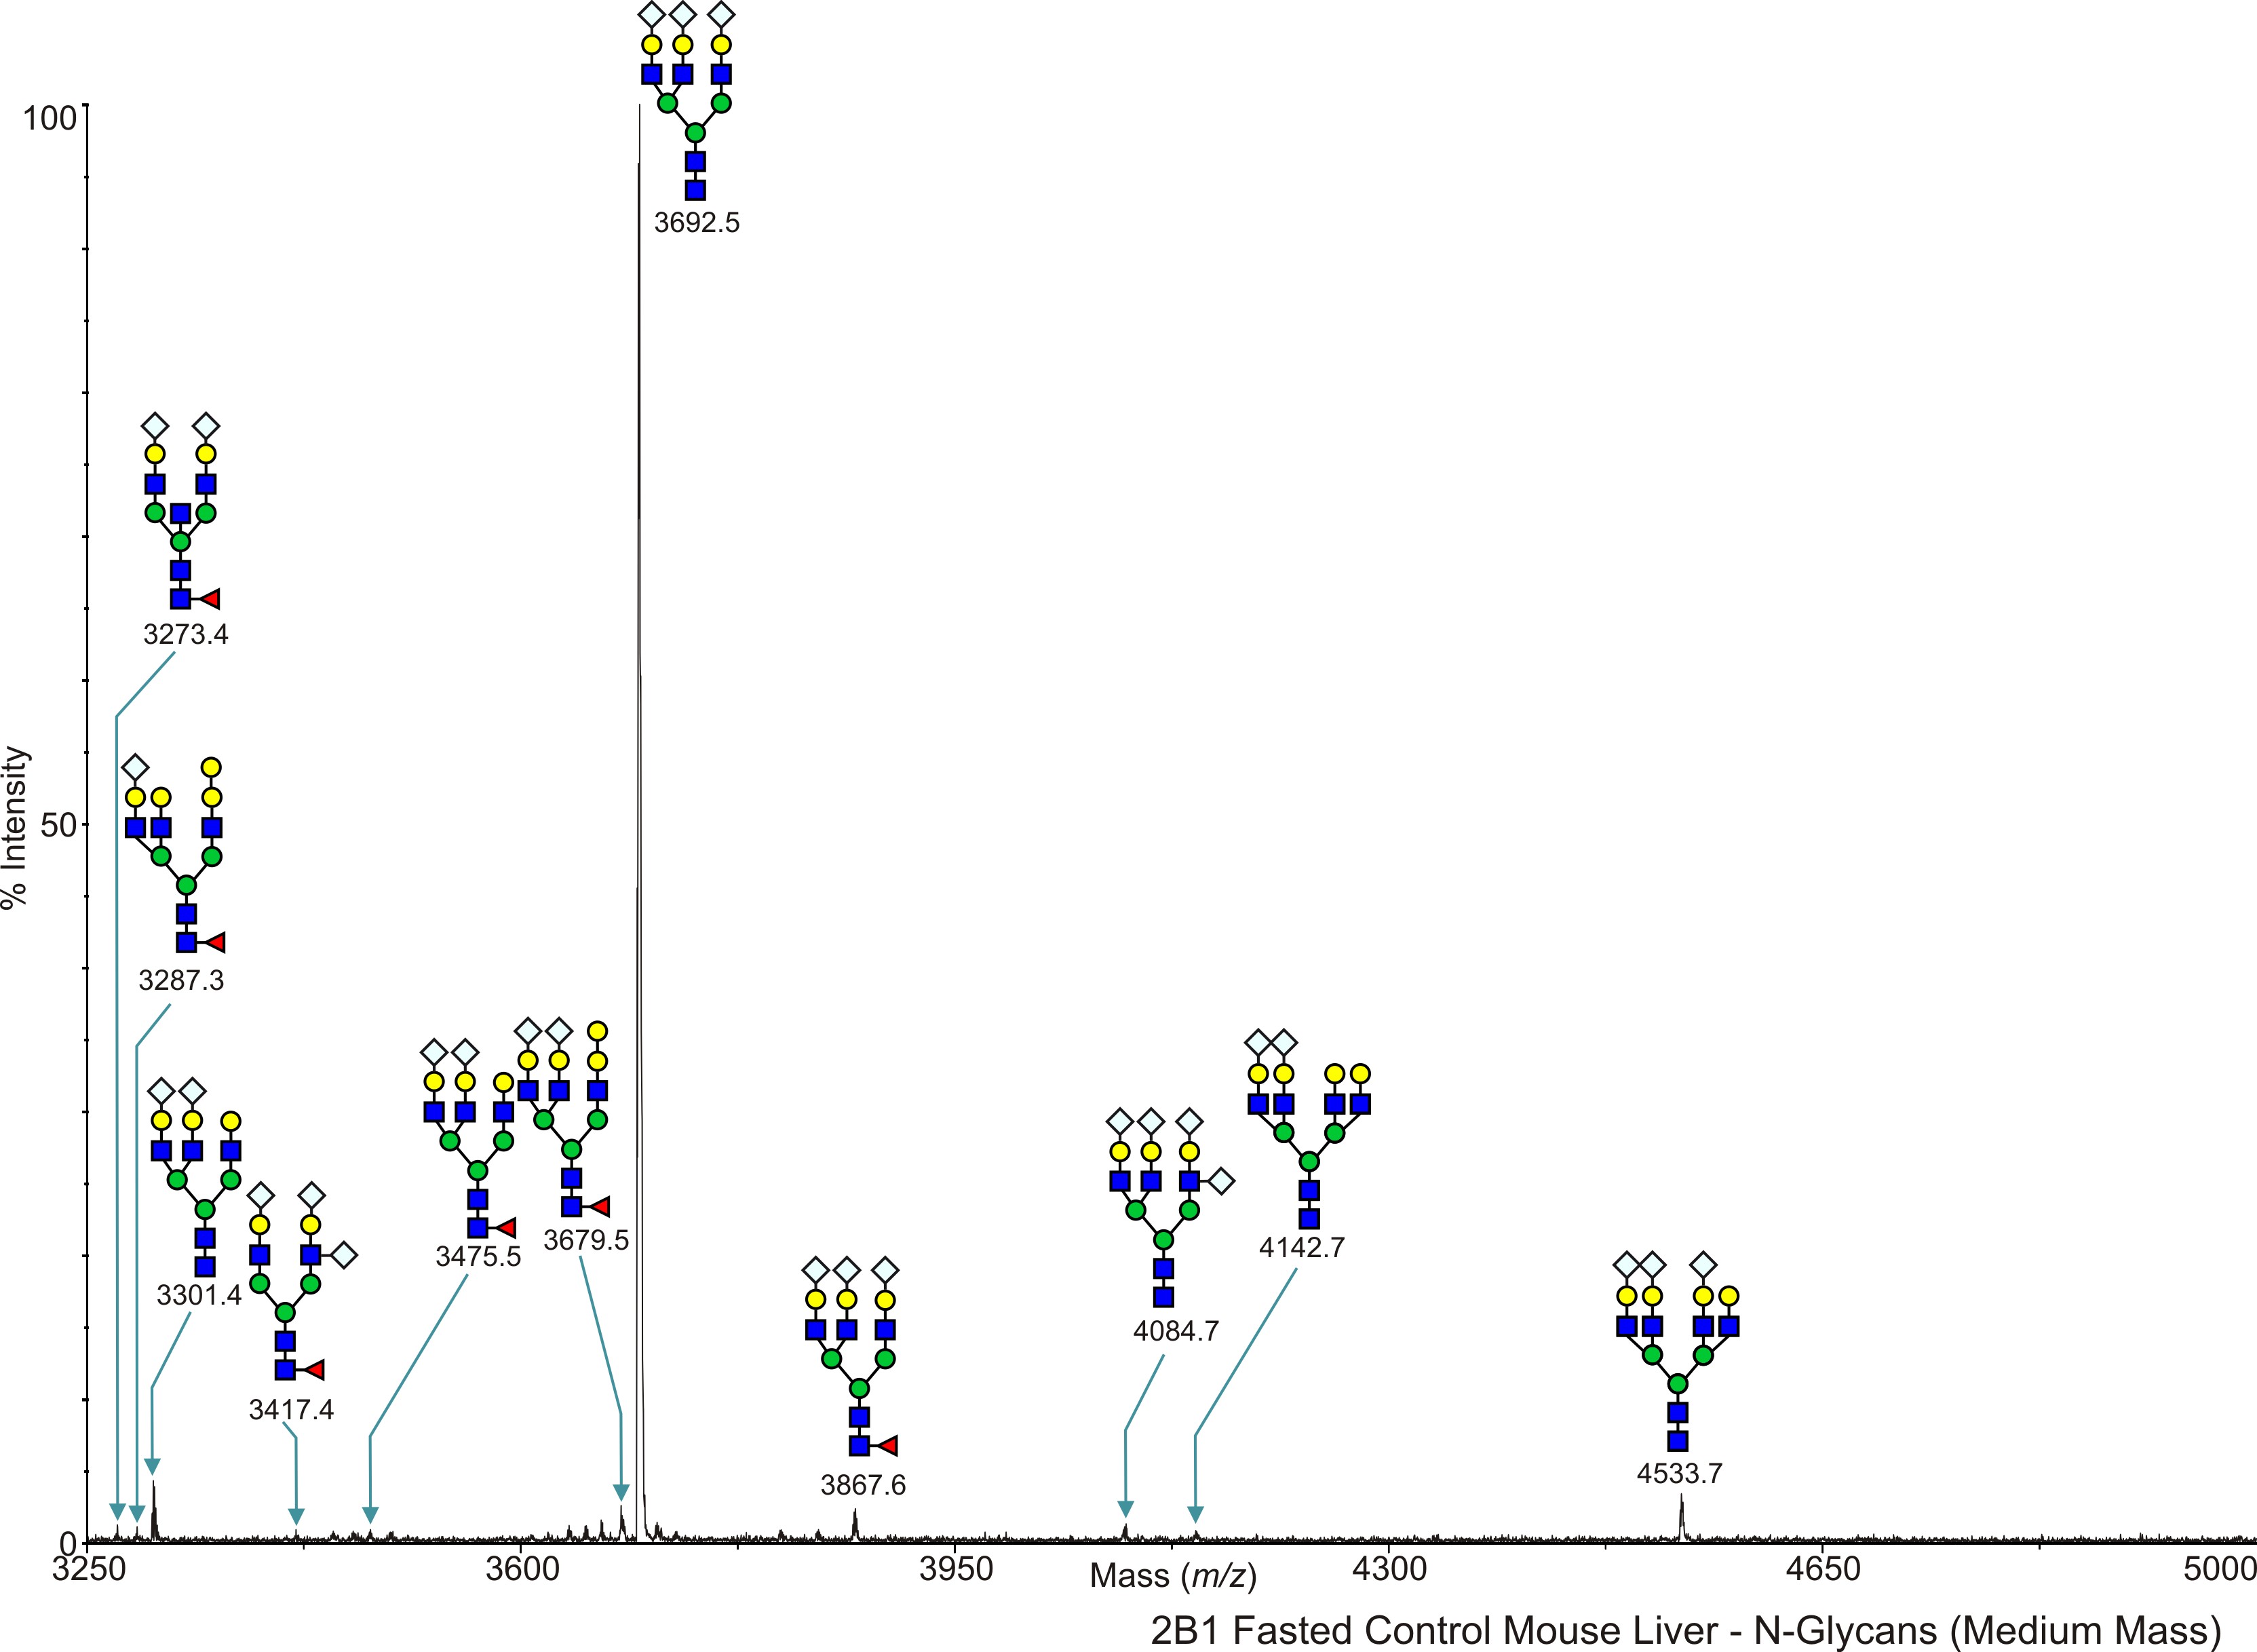
Mouse Liver 2B1 - Fasted high fat diet control mouse liver, NG N-Linked Dennis, James W. View experimental details      
Annotated file for lower mass range in JPG formatAnnotated file for higher mass range in JPG format Annotated file for lower mass range in PDF formatAnnotated file for higher mass range in PDF format
View Mass Spectrum data as text View Mass Peak file   Interactive Mass Spectrum Viewer
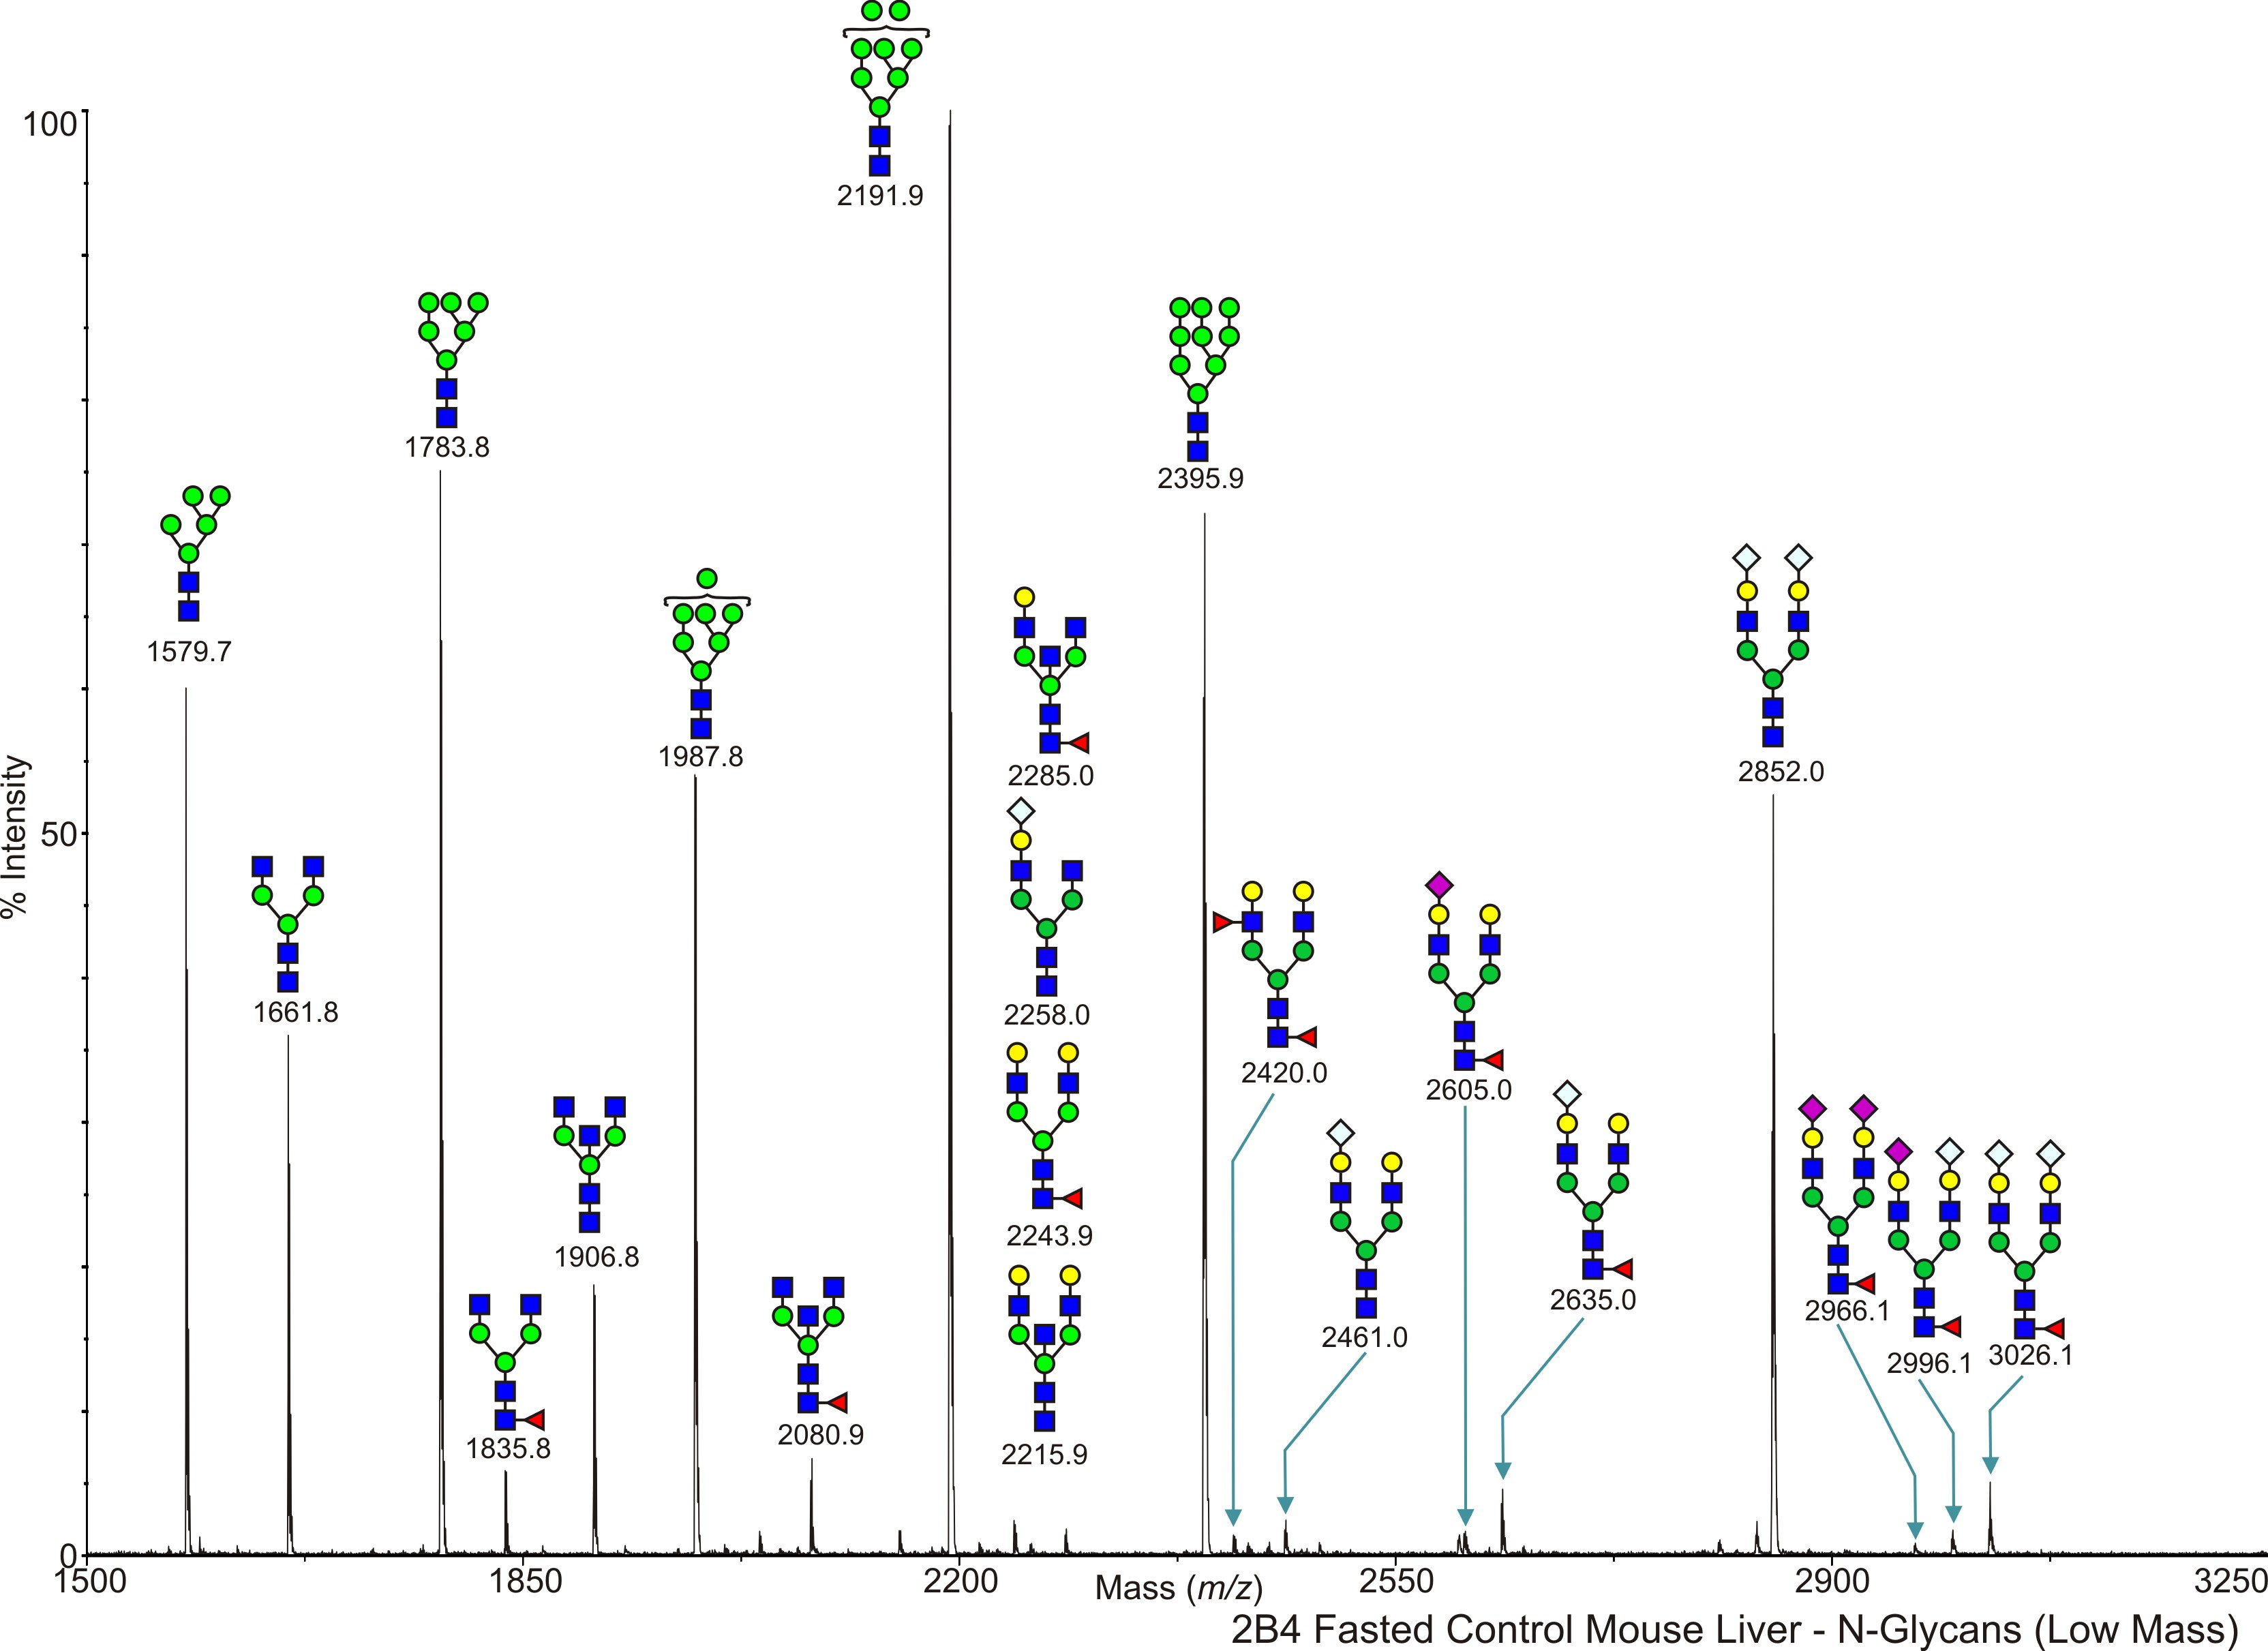
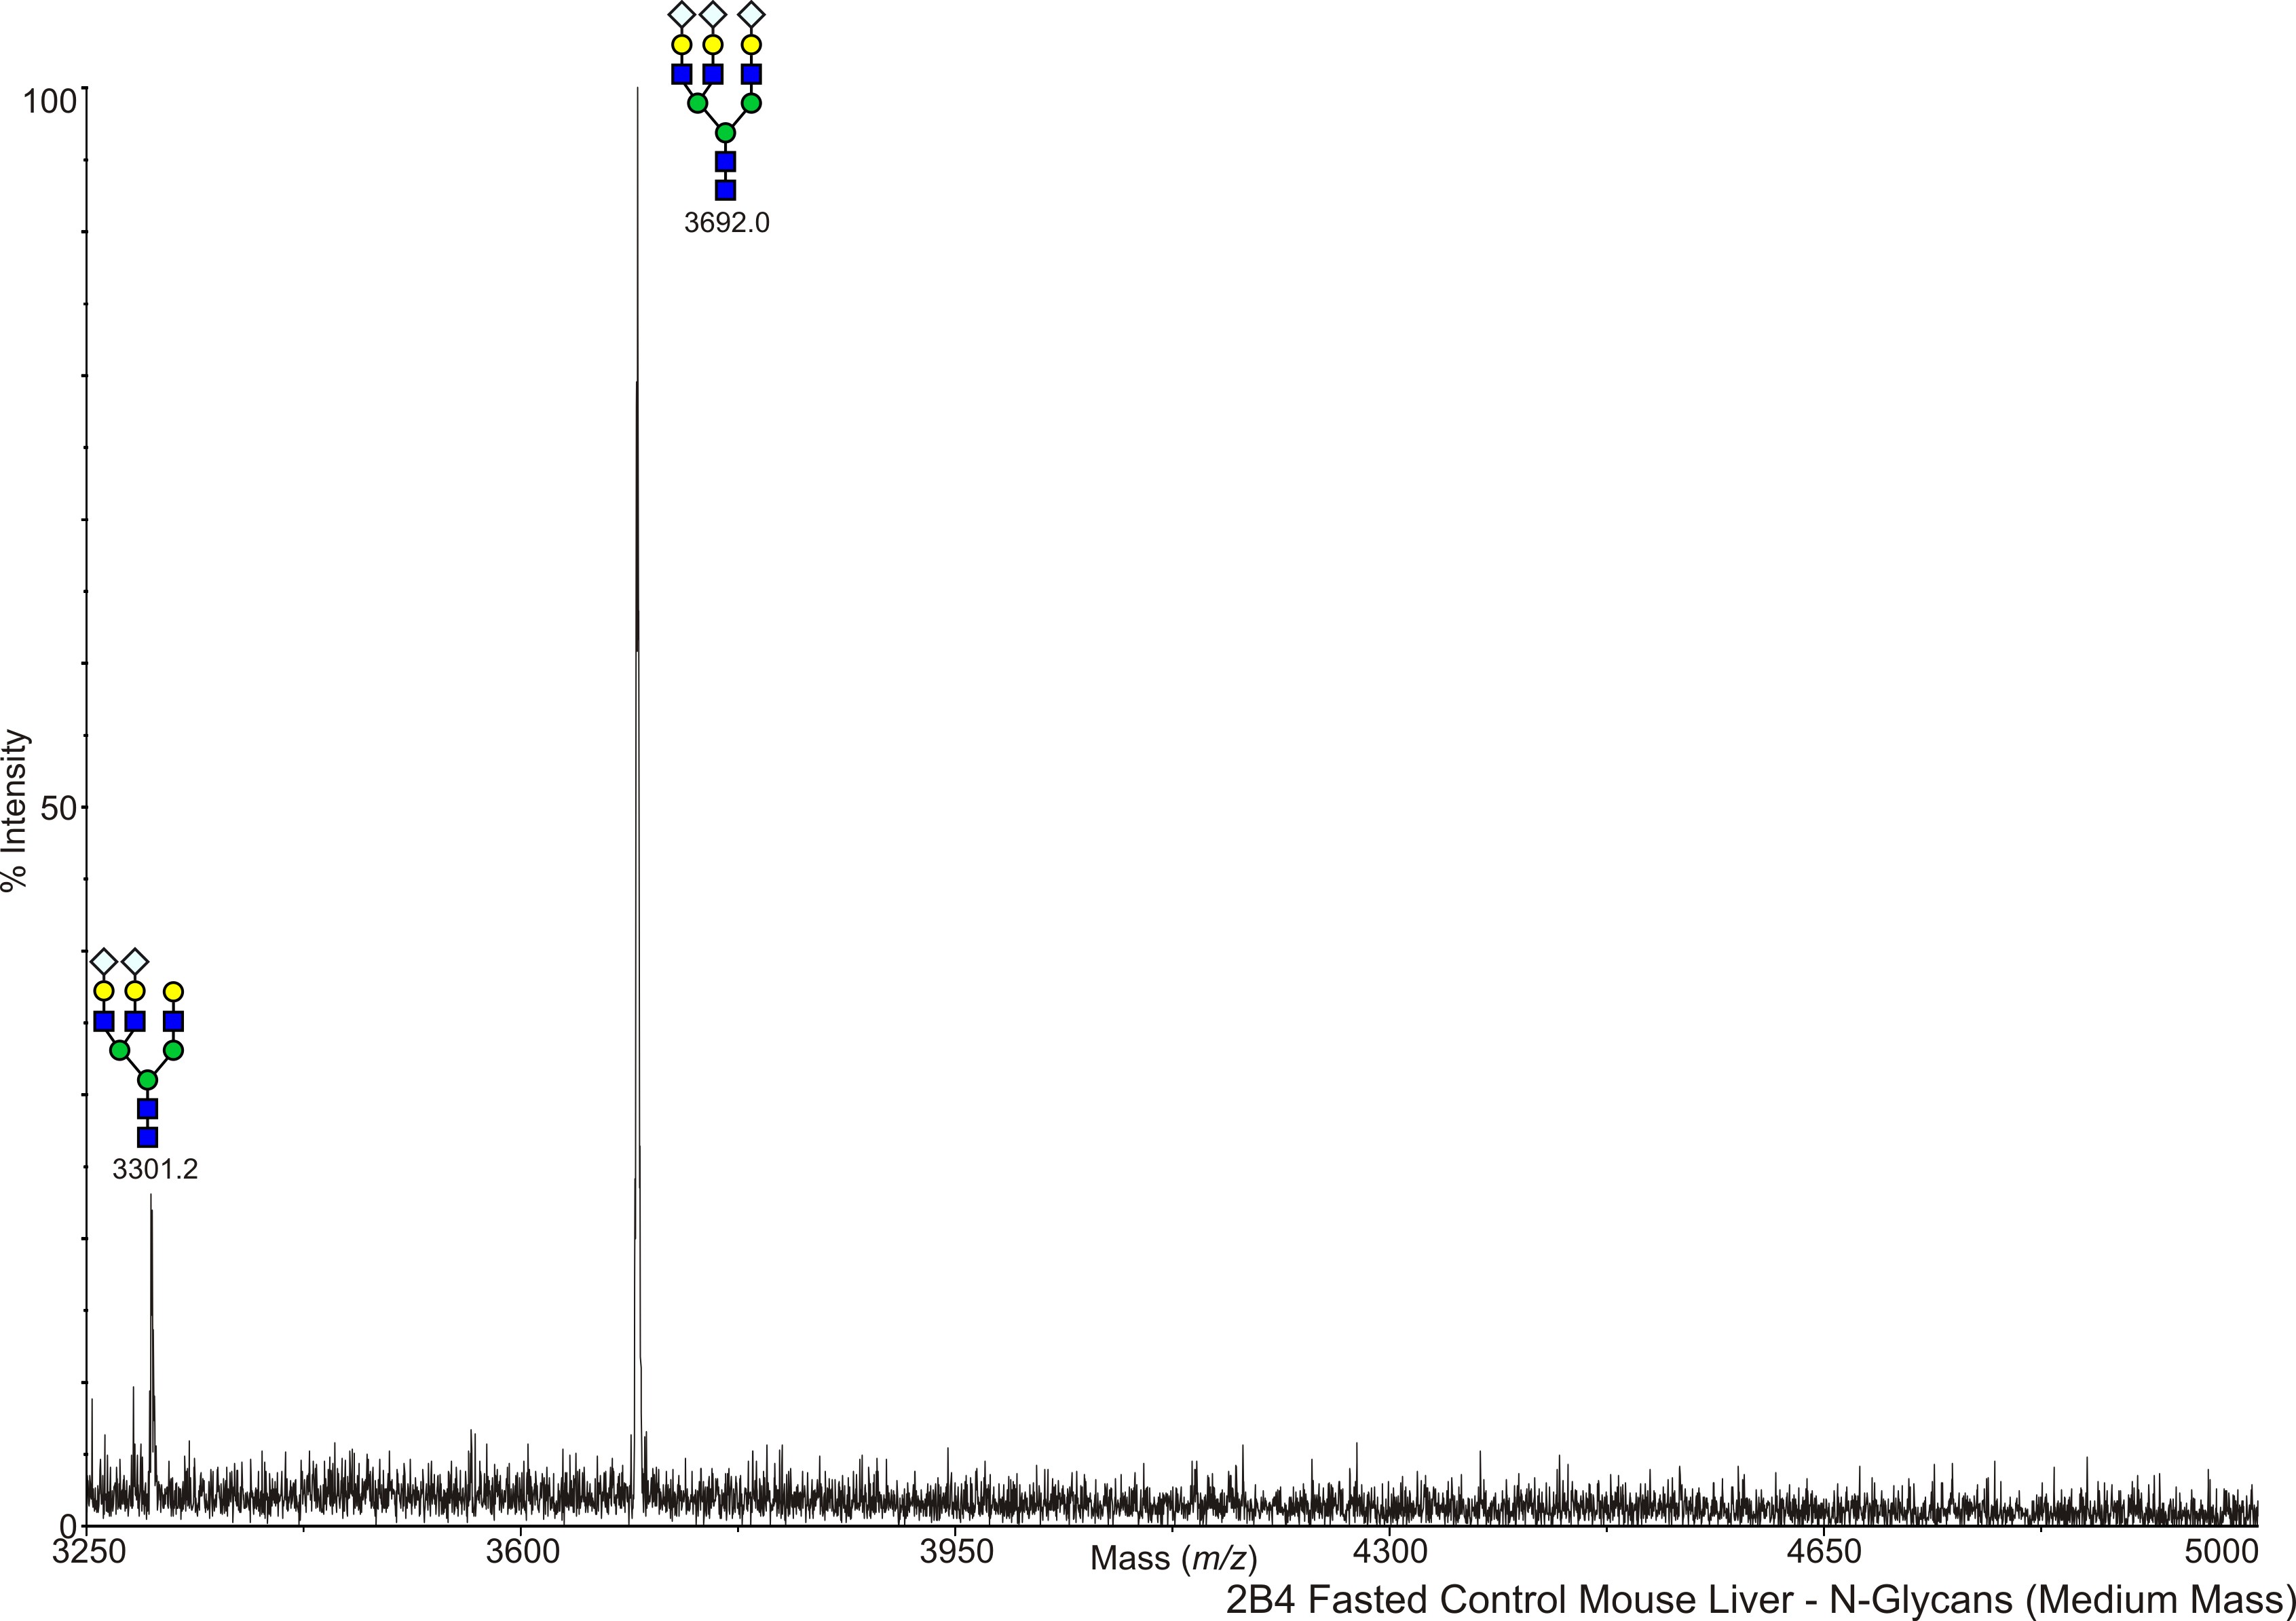
Mouse Liver 2B4 - Fasted high fat diet control mouse liver, NG N-Linked Dennis, James W. View experimental details      
Annotated file for lower mass range in JPG formatAnnotated file for higher mass range in JPG format Annotated file for lower mass range in PDF formatAnnotated file for higher mass range in PDF format
View Mass Spectrum data as text View Mass Peak file   Interactive Mass Spectrum Viewer
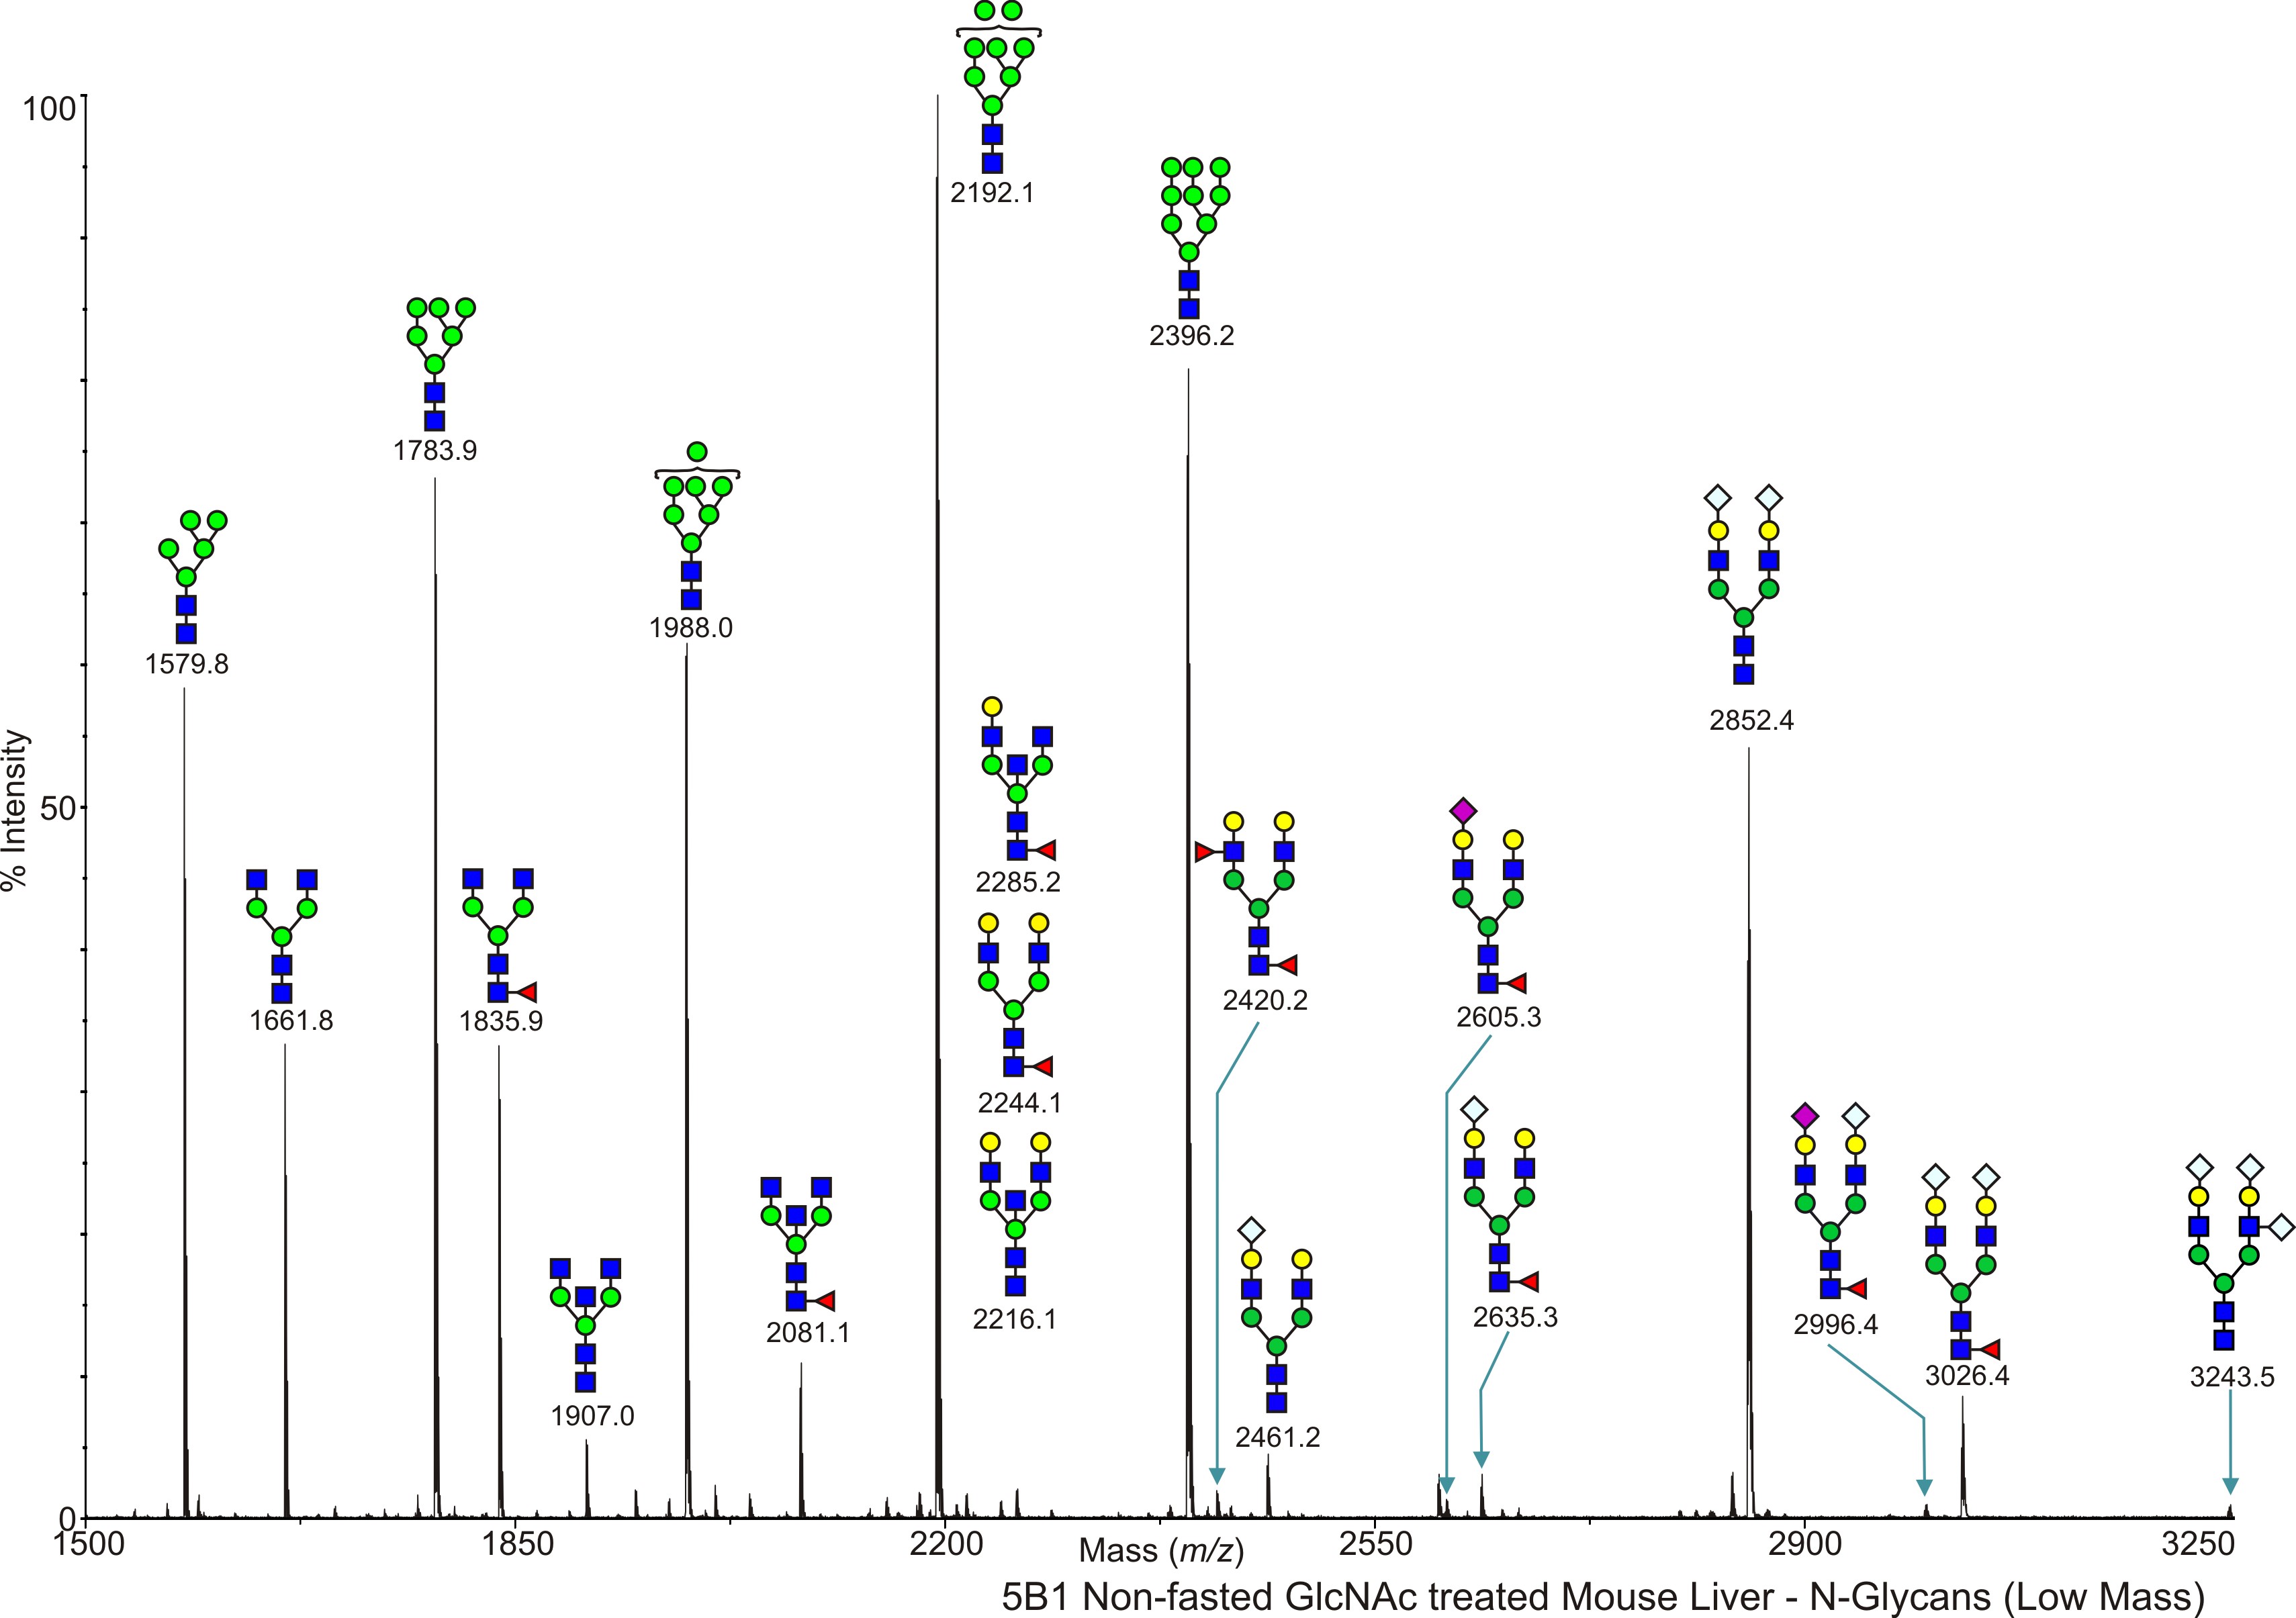
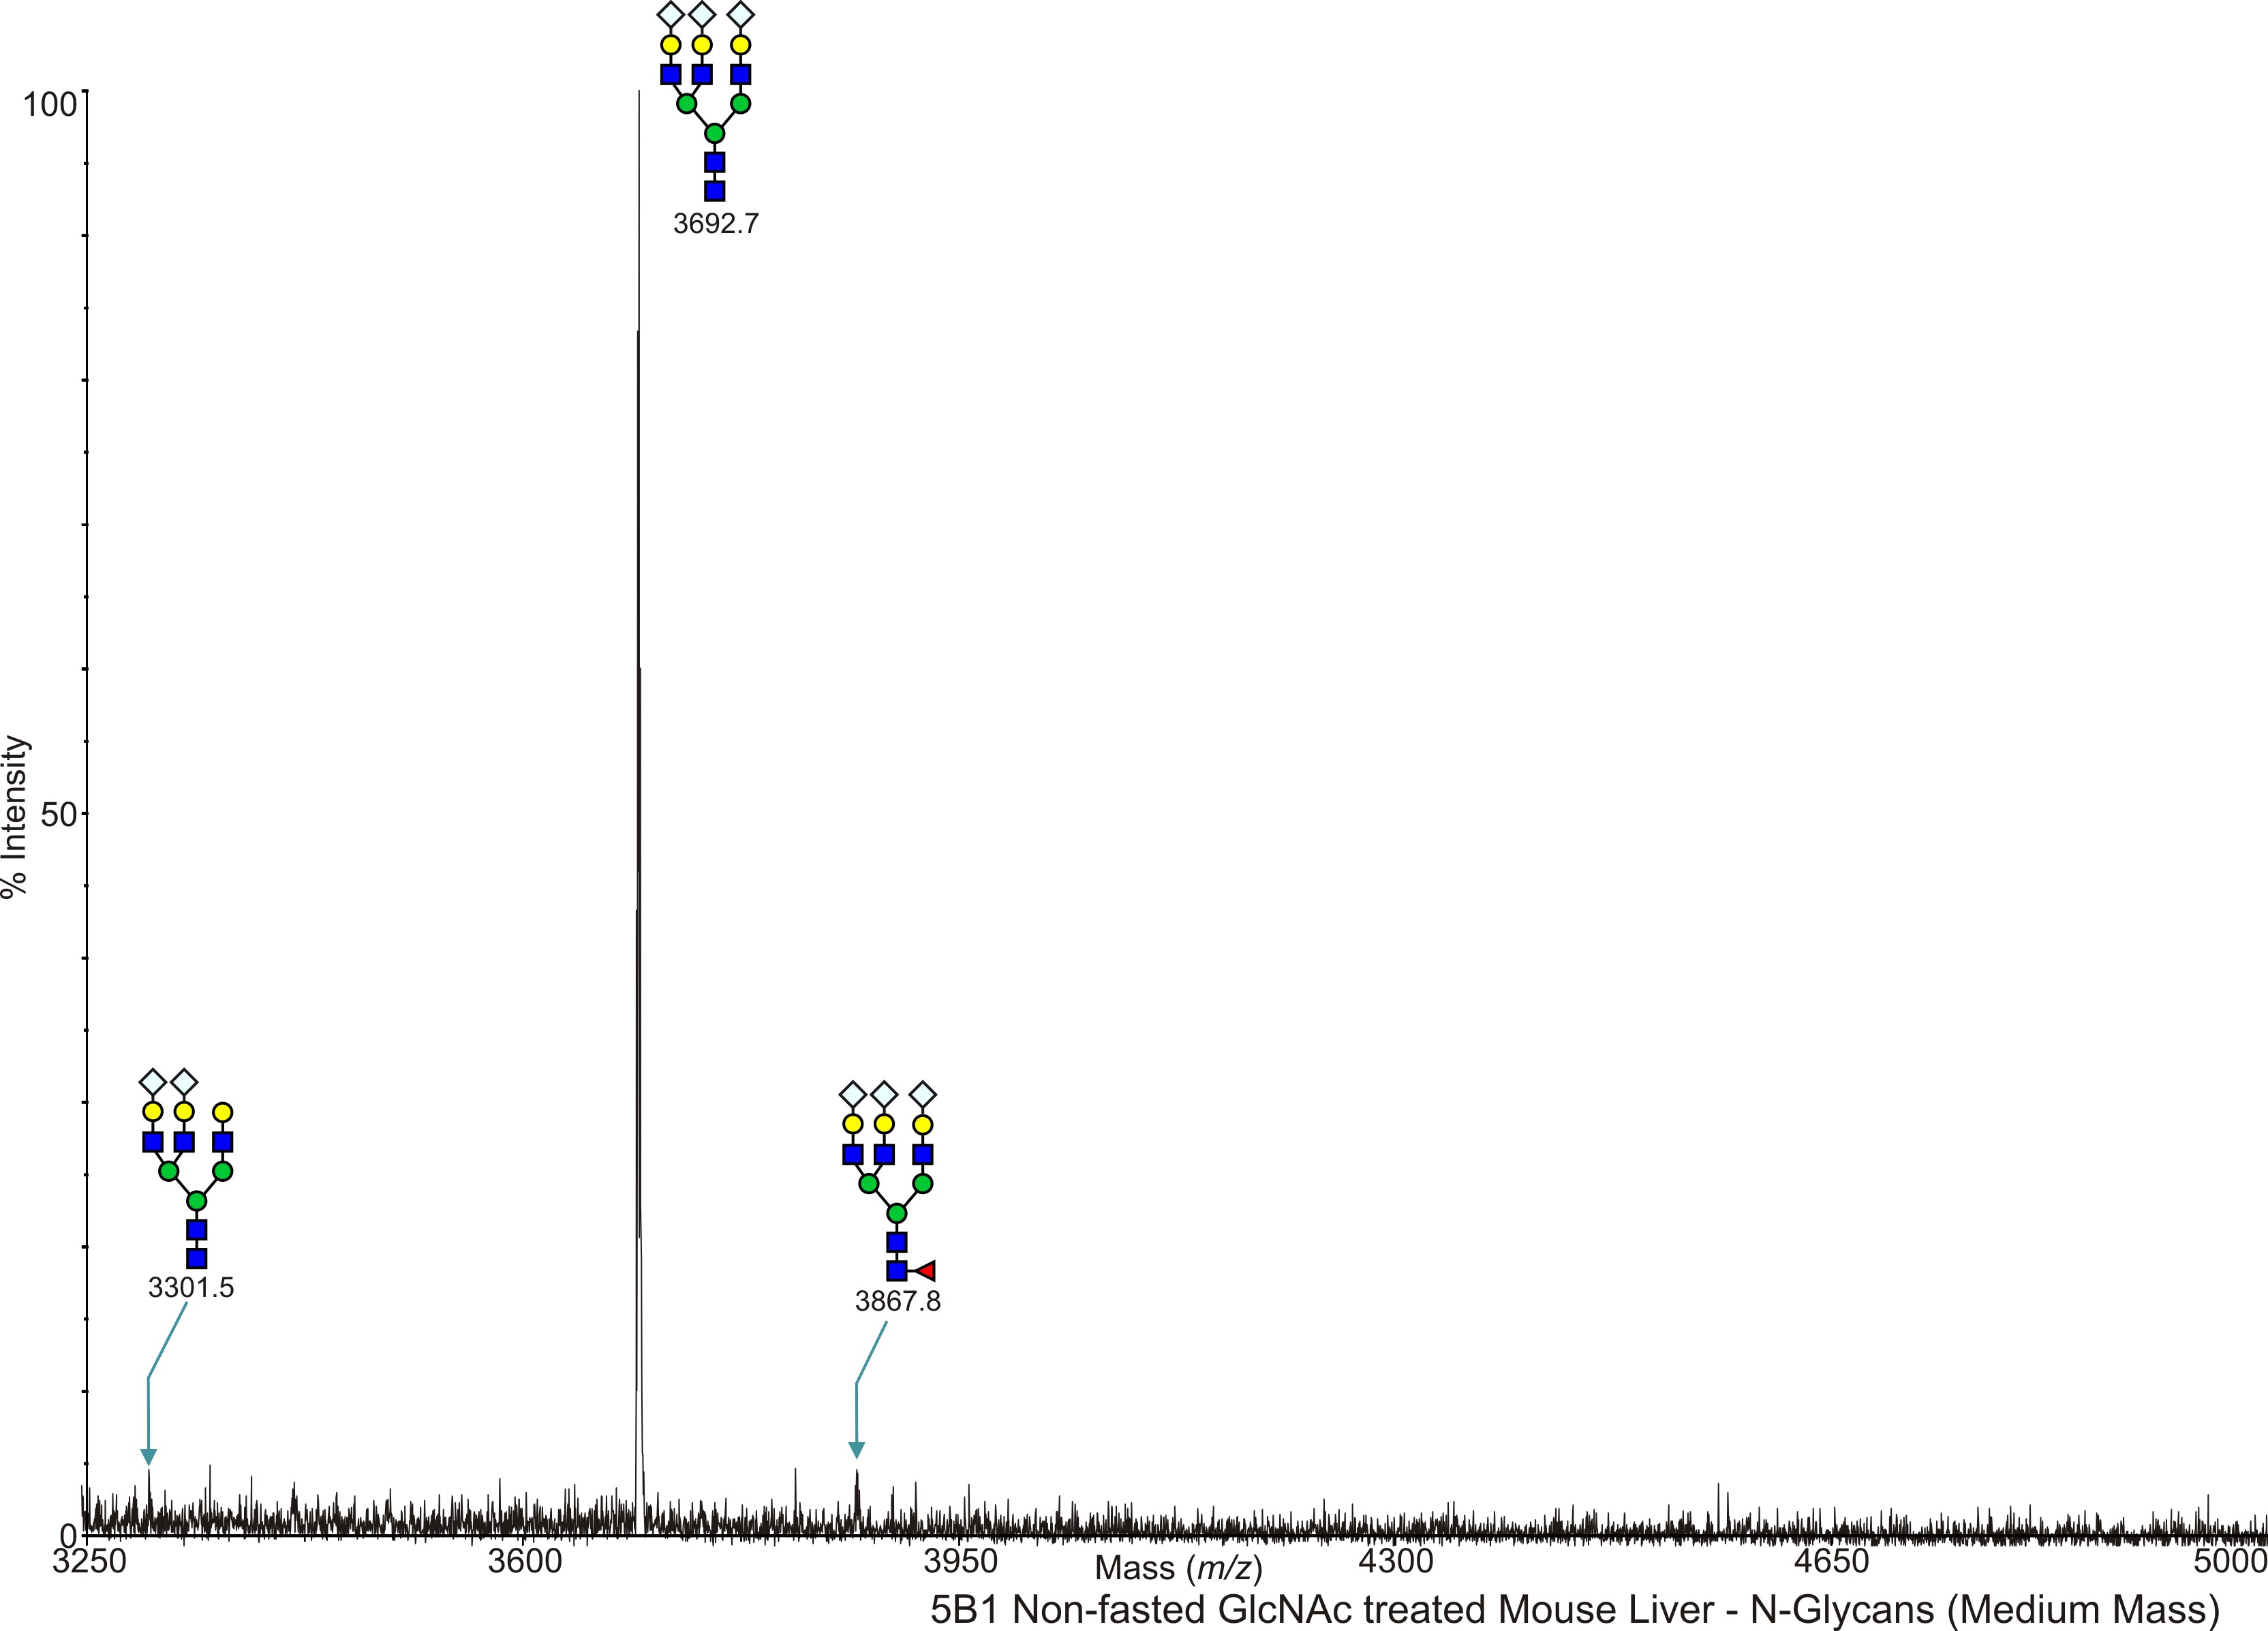
Mouse Liver 5B1 - Non-fasted high fat diet GlcNAc treated mouse liver, NG N-Linked Dennis, James W. View experimental details      
Annotated file for lower mass range in JPG formatAnnotated file for higher mass range in JPG format Annotated file for lower mass range in PDF formatAnnotated file for higher mass range in PDF format
View Mass Spectrum data as text View Mass Peak file   Interactive Mass Spectrum Viewer
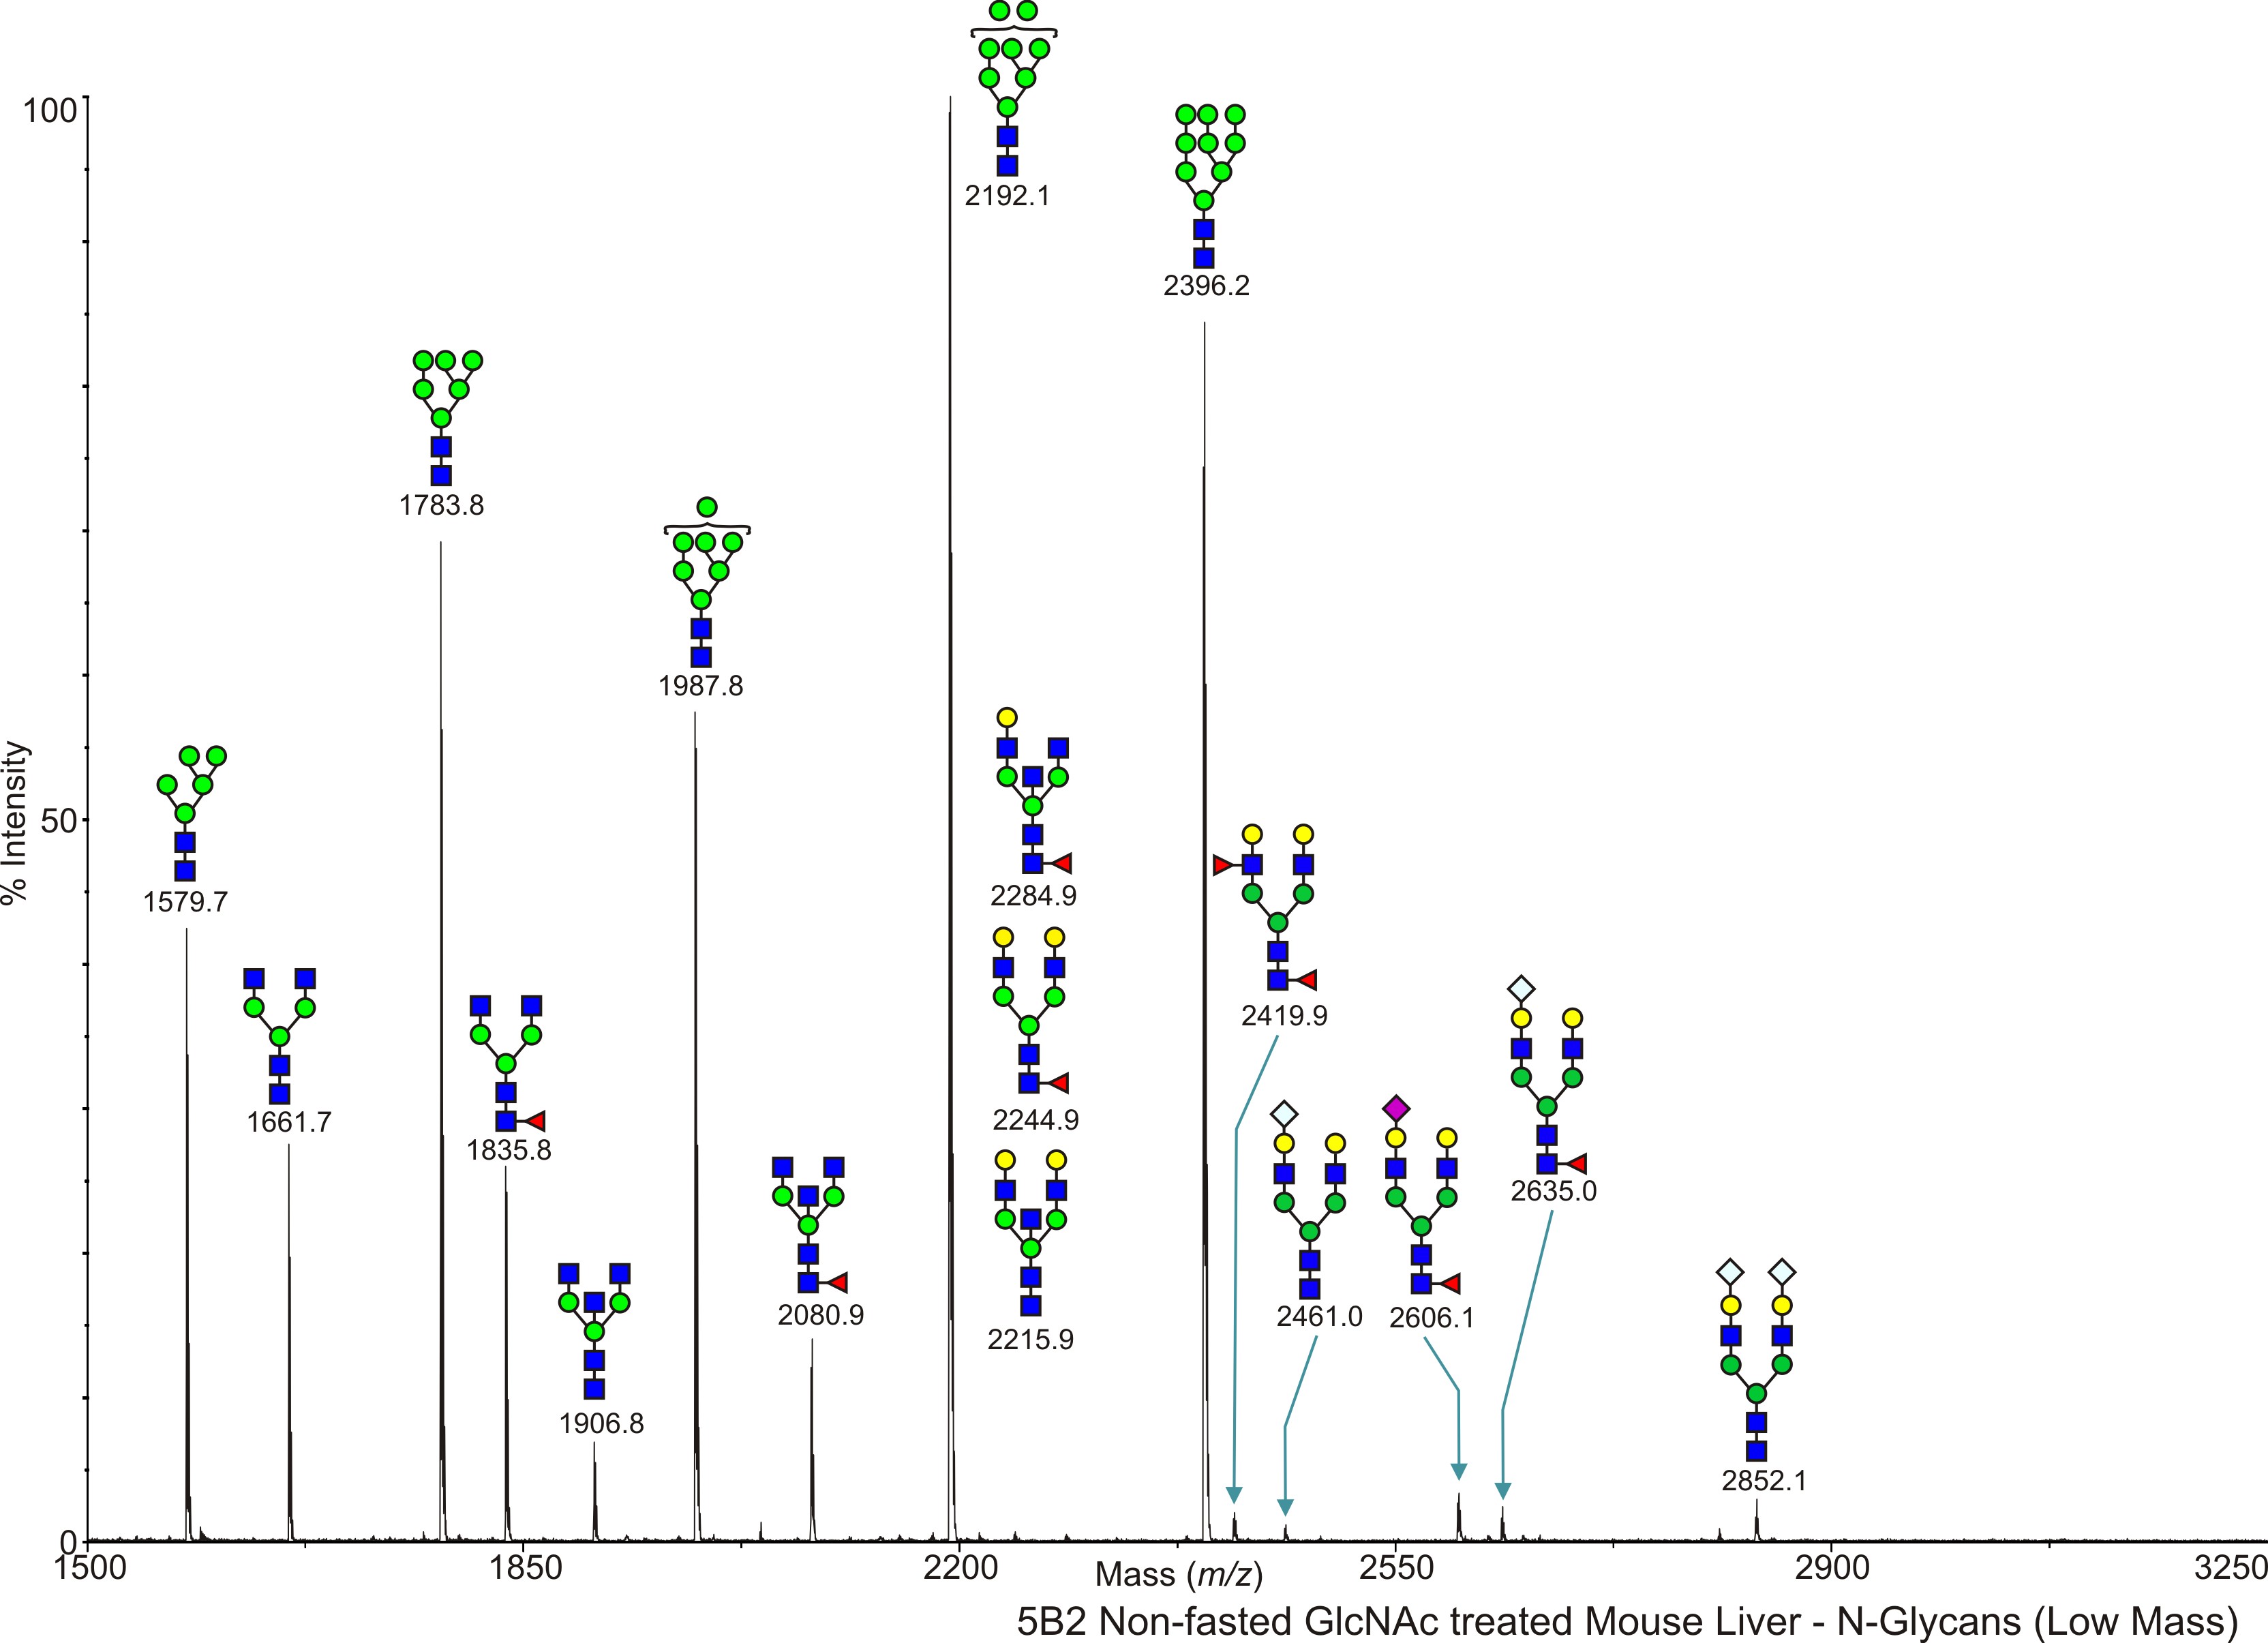
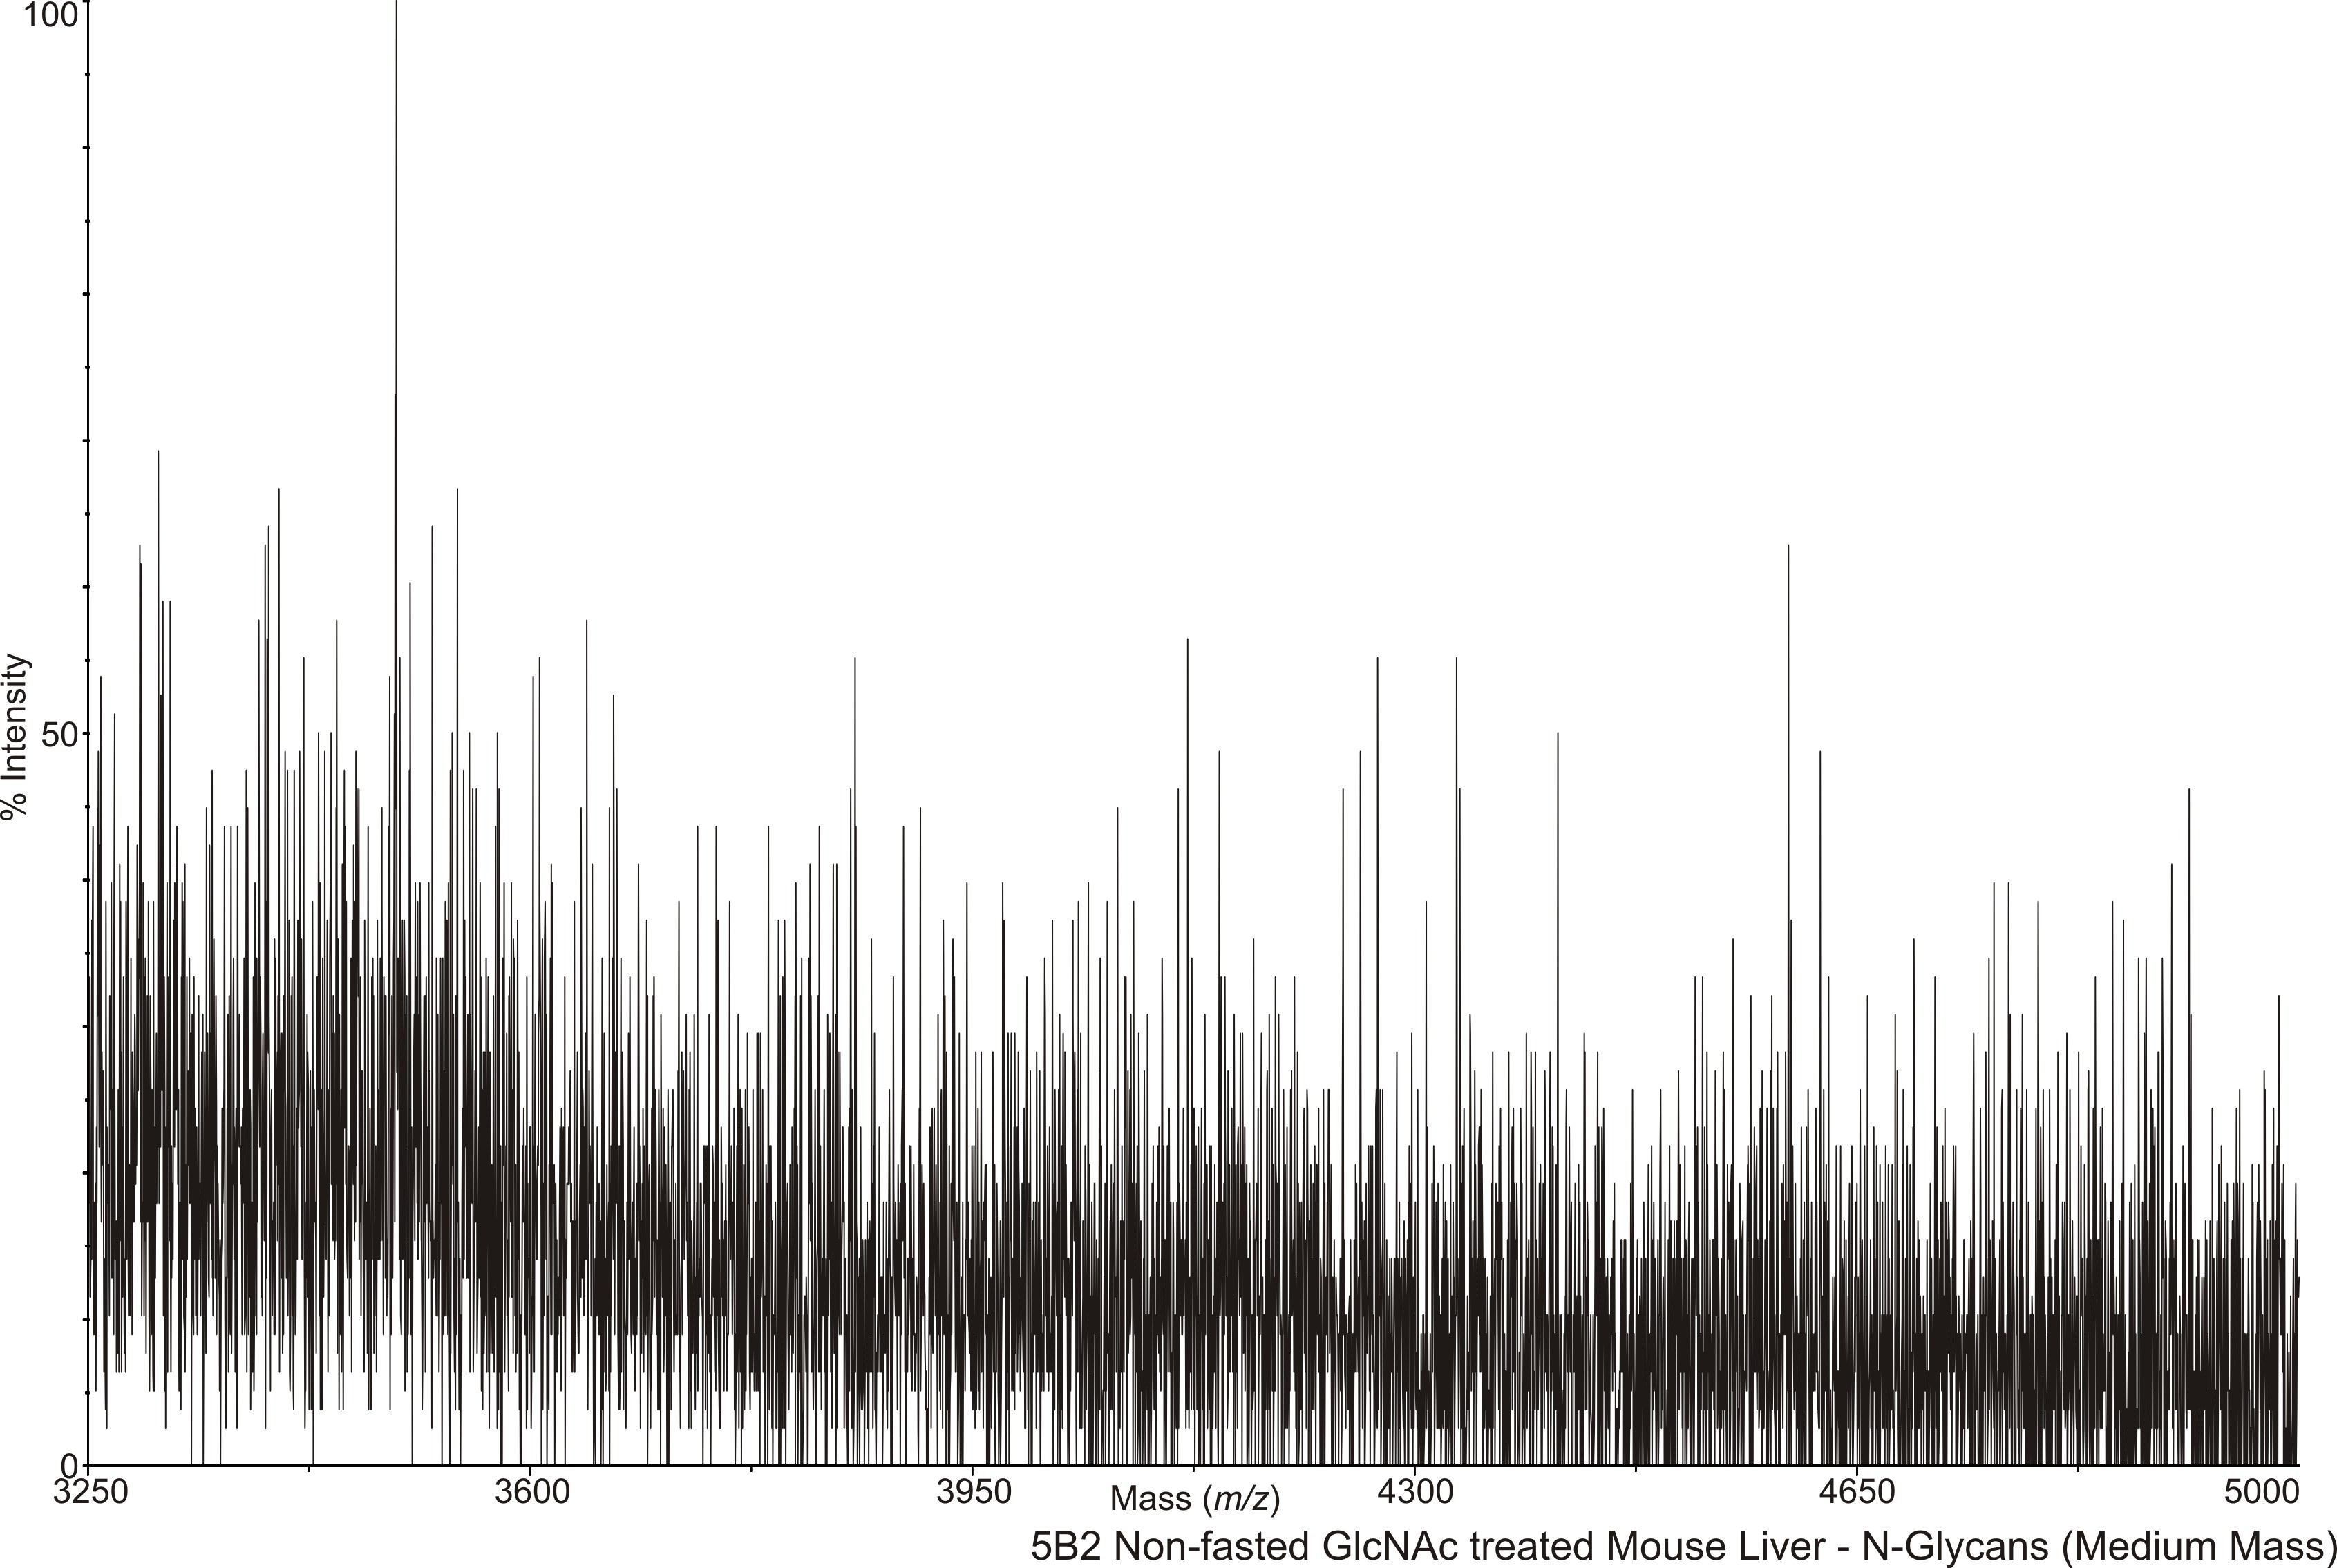
Mouse Liver 5B2 - Non-fasted high fat diet GlcNAc treated mouse liver, NG N-Linked Dennis, James W. View experimental details      
Annotated file for lower mass range in JPG formatAnnotated file for higher mass range in JPG format Annotated file for lower mass range in PDF formatAnnotated file for higher mass range in PDF format
View Mass Spectrum data as text View Mass Peak file   Interactive Mass Spectrum Viewer
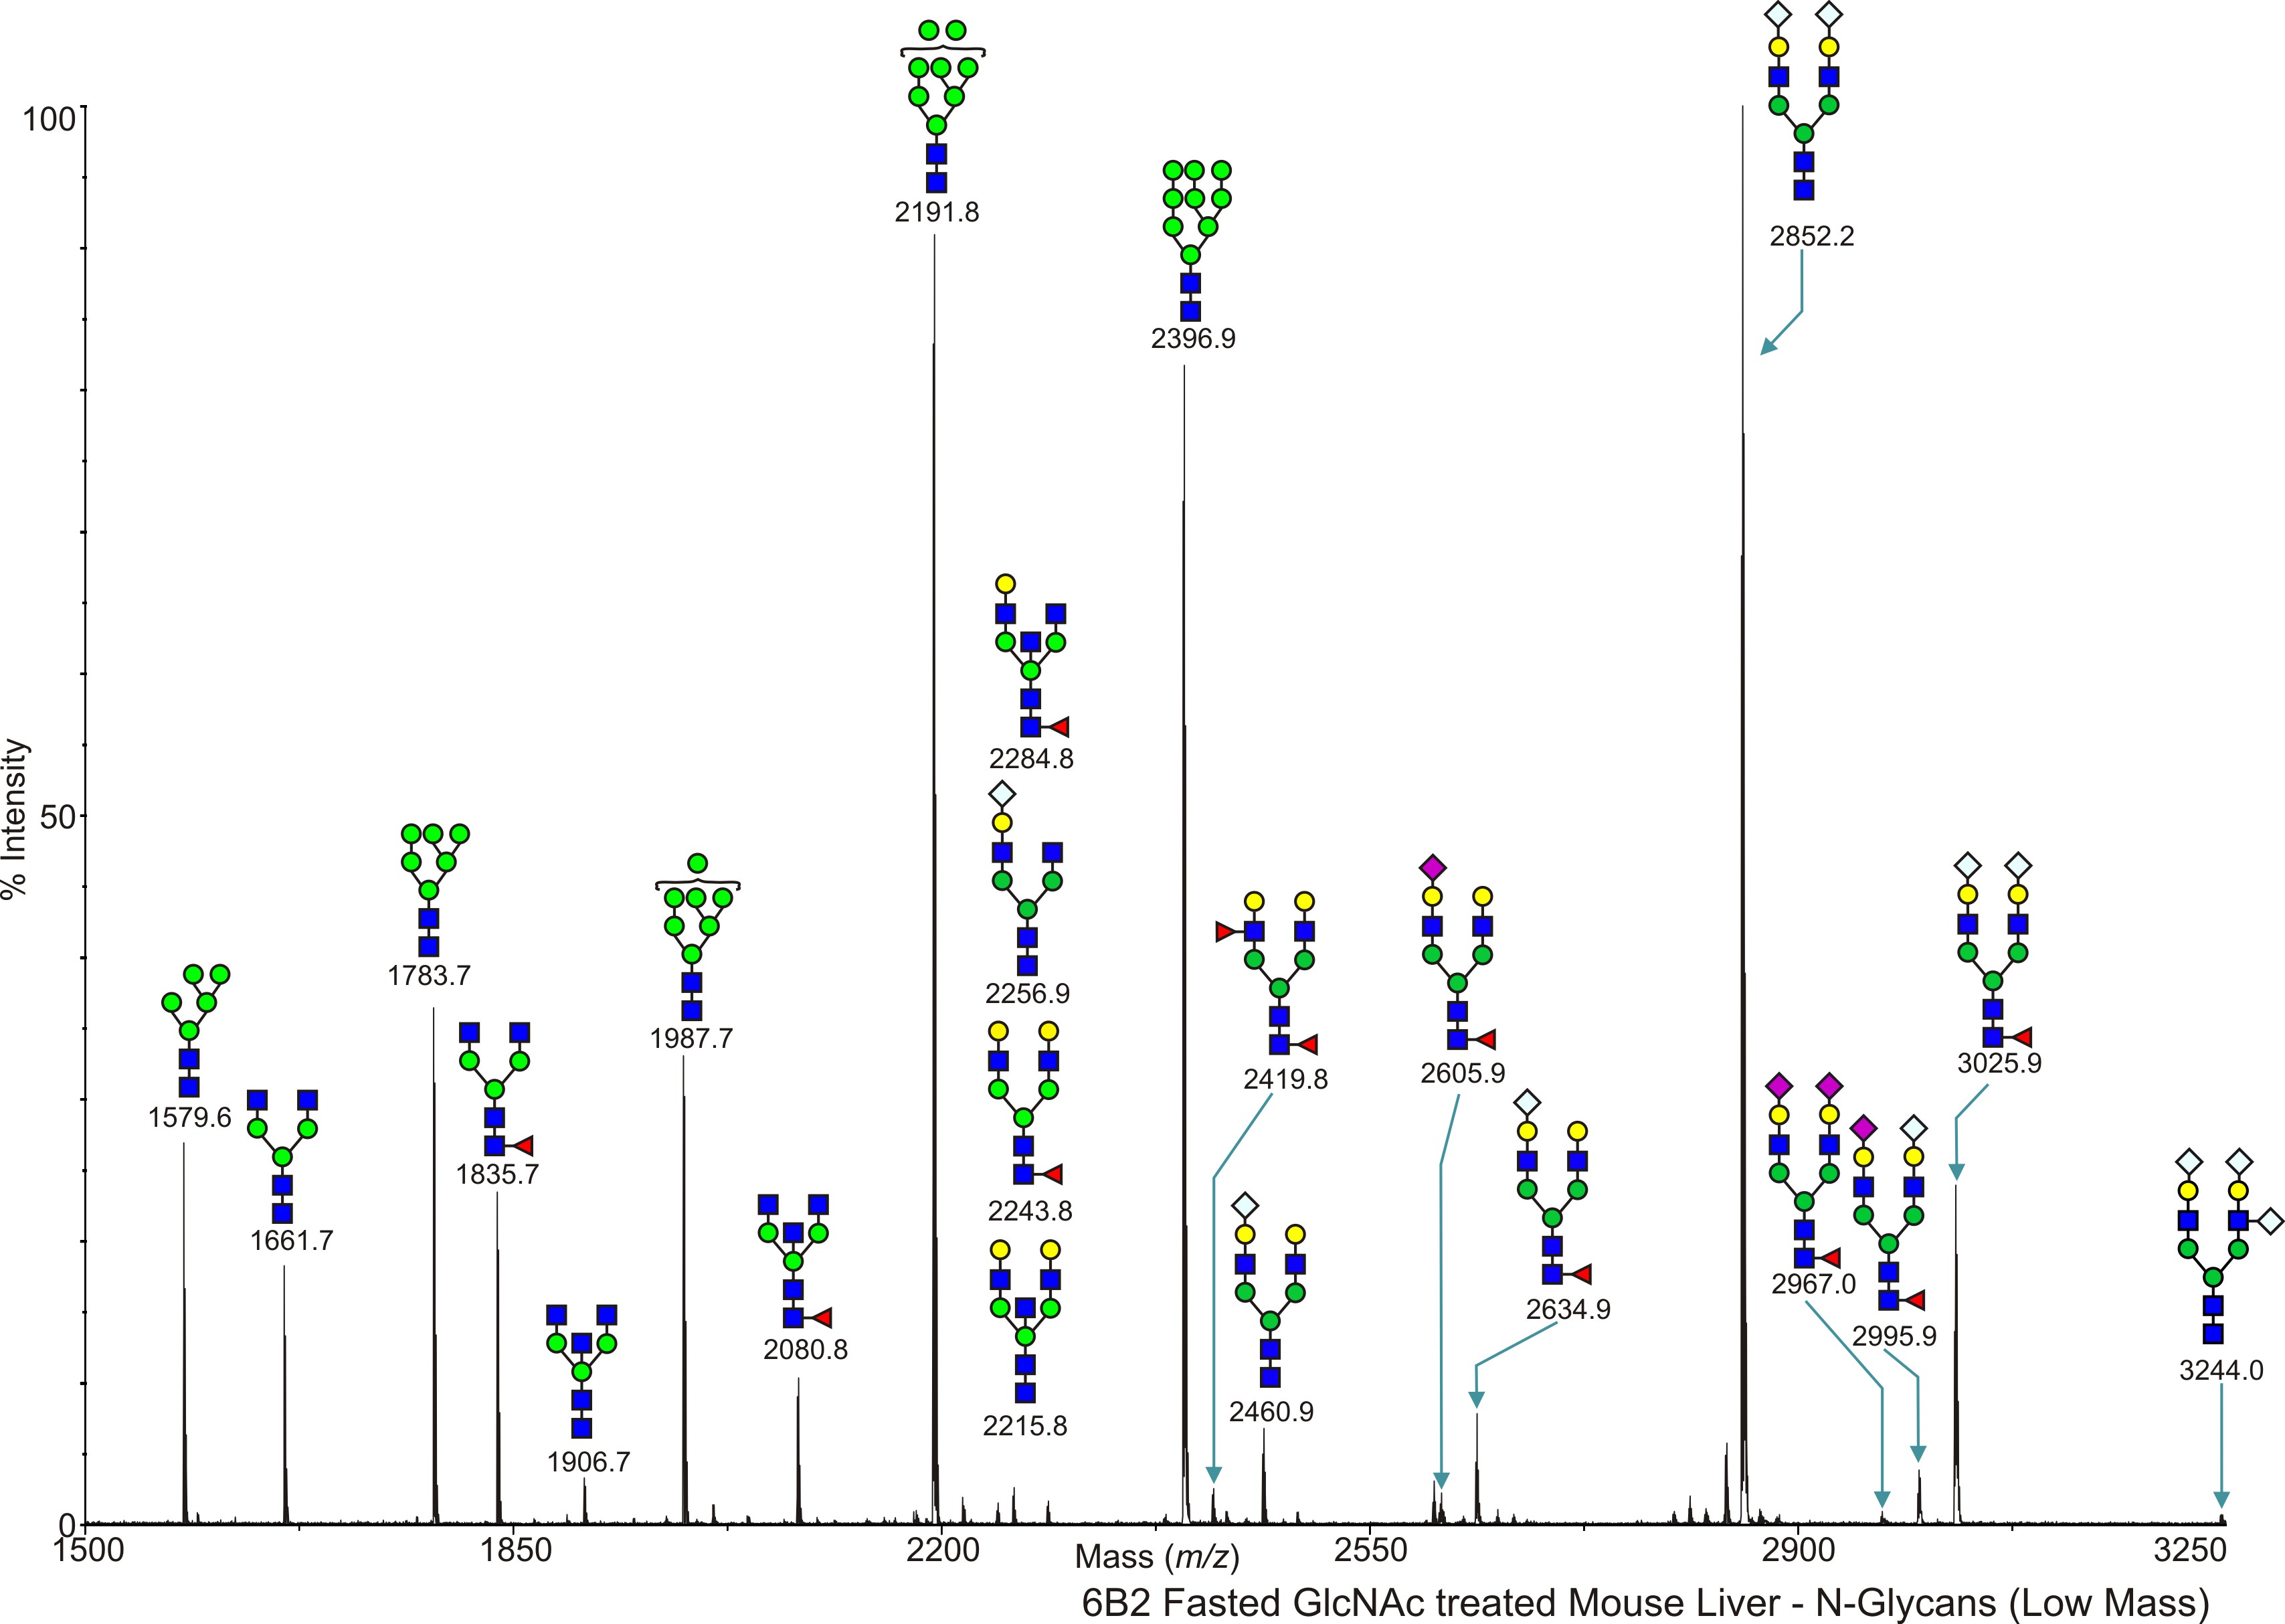
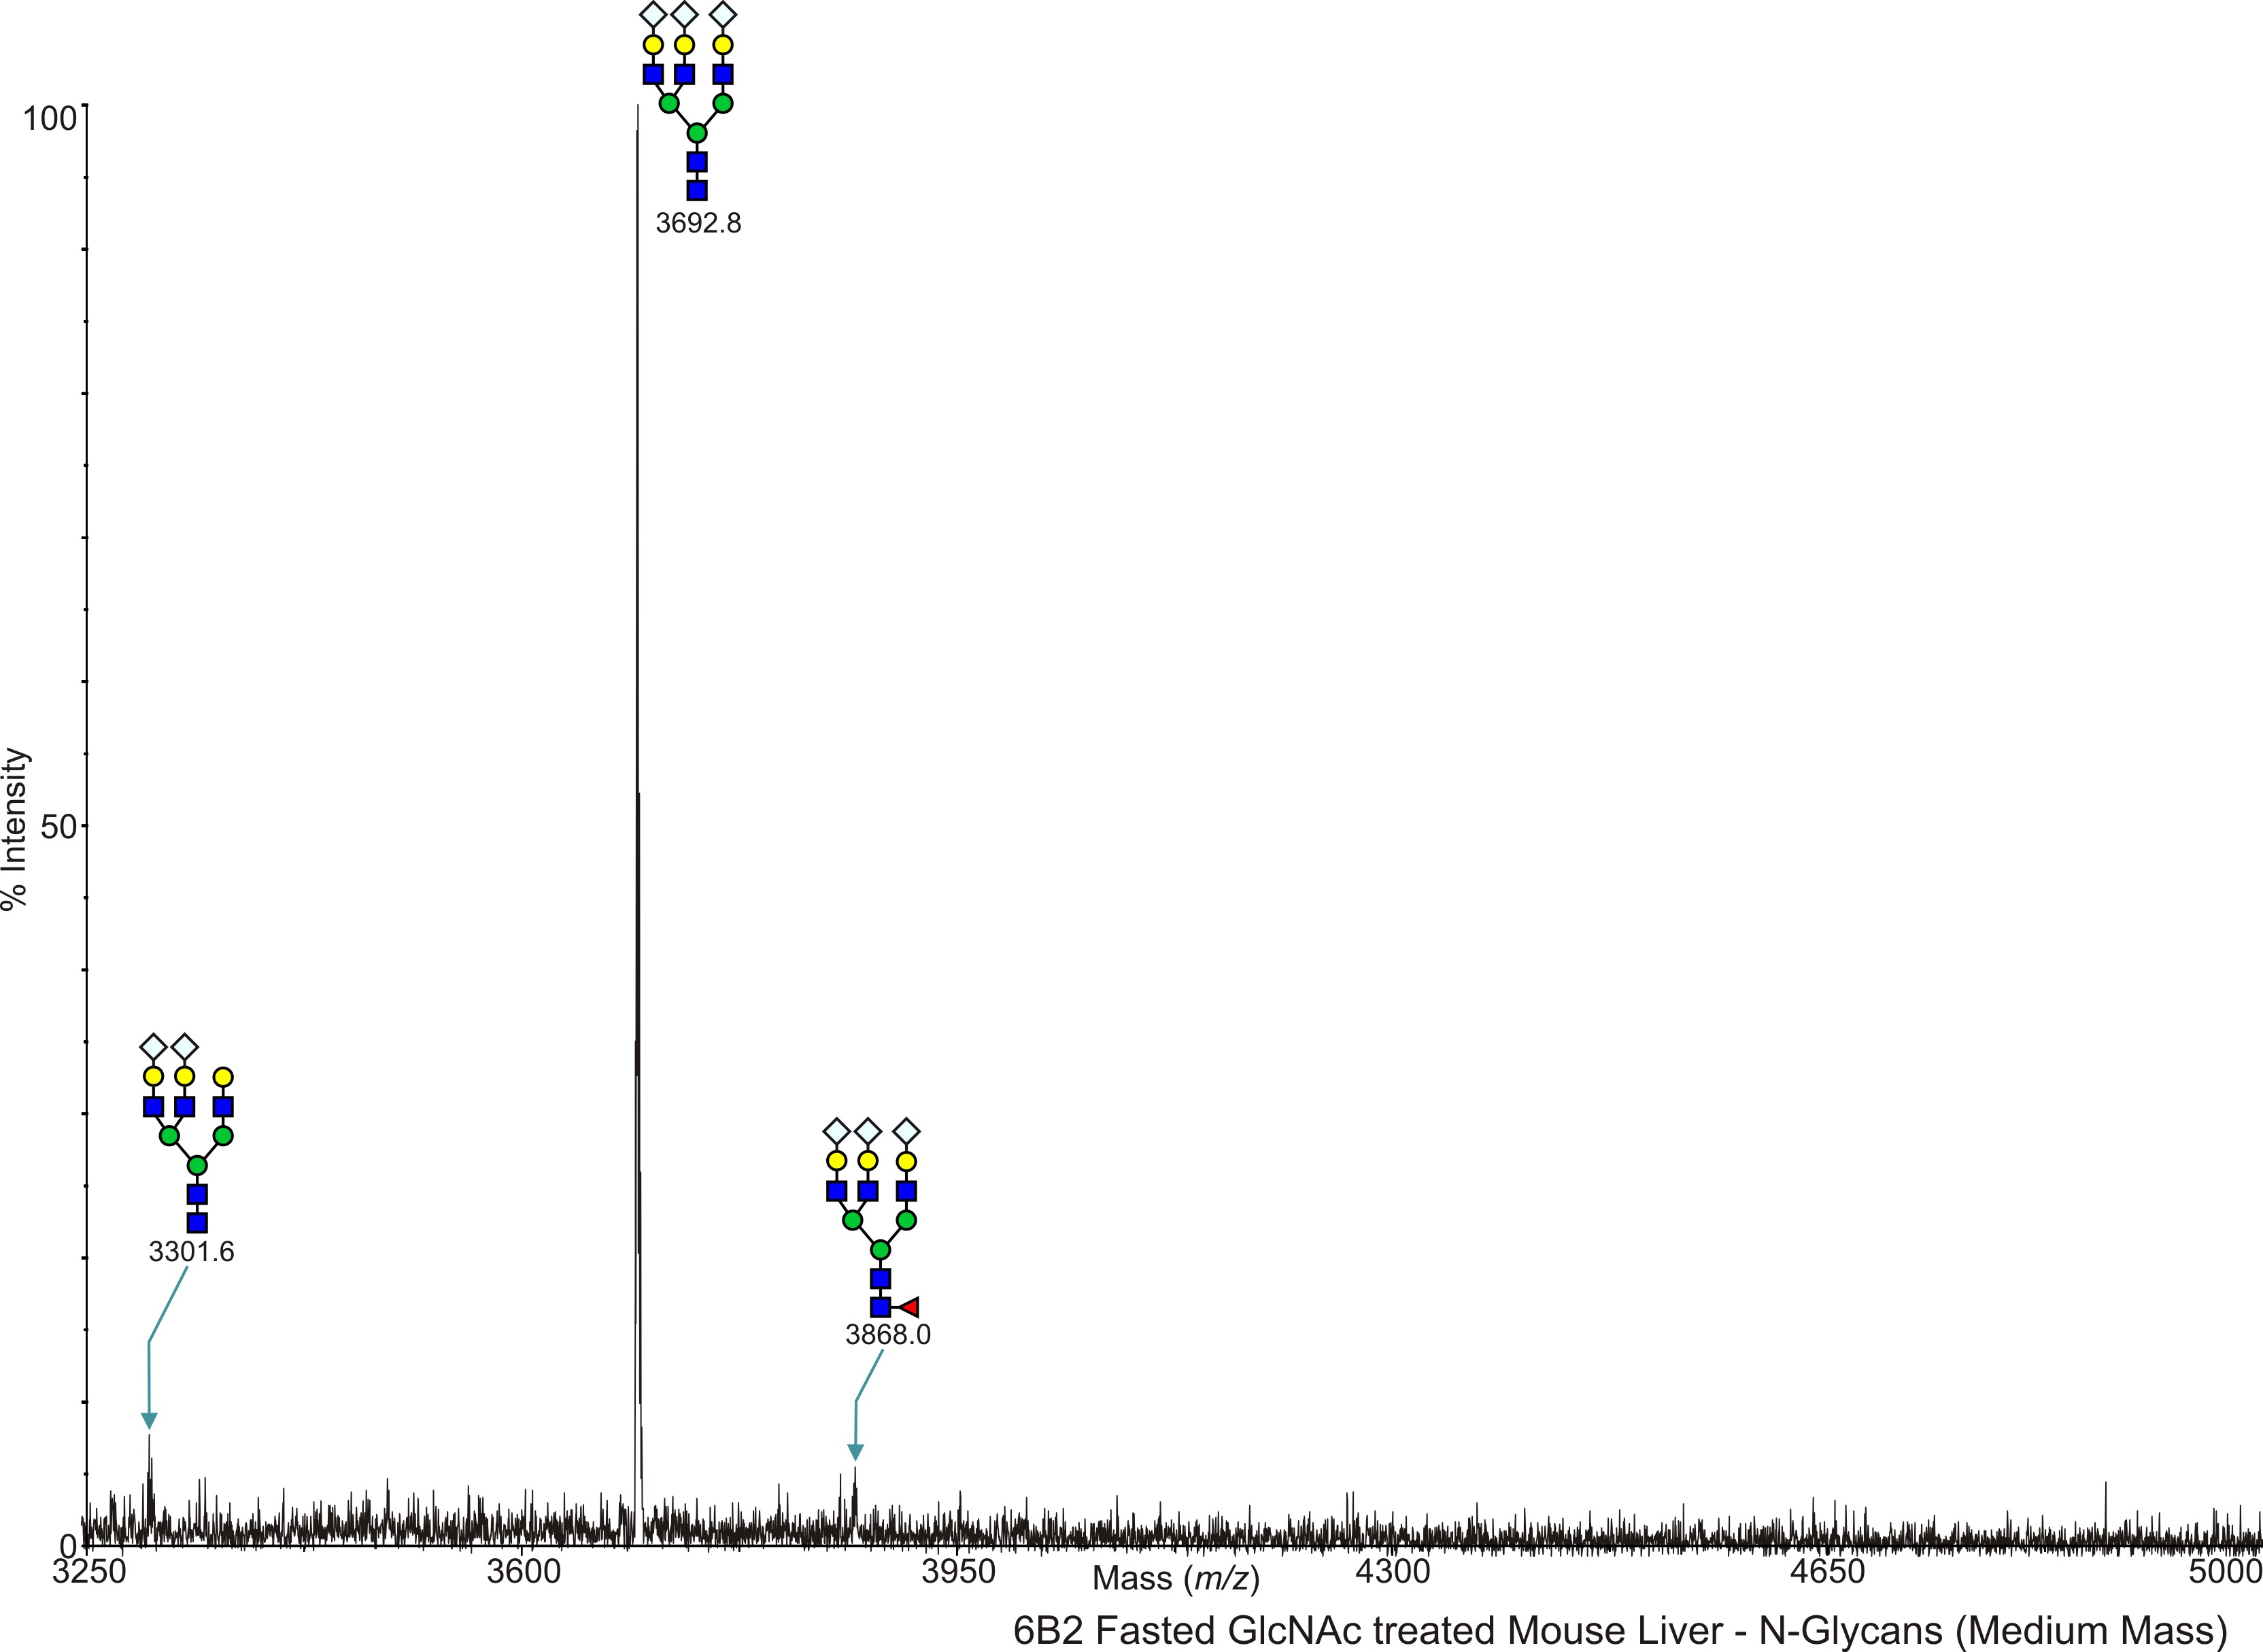
Mouse Liver 6B2 - Fasted high fat diet GlcNAc treated mouse liver, NG N-Linked Dennis, James W. View experimental details      
Annotated file for lower mass range in JPG formatAnnotated file for higher mass range in JPG format Annotated file for lower mass range in PDF formatAnnotated file for higher mass range in PDF format
View Mass Spectrum data as text View Mass Peak file   Interactive Mass Spectrum Viewer
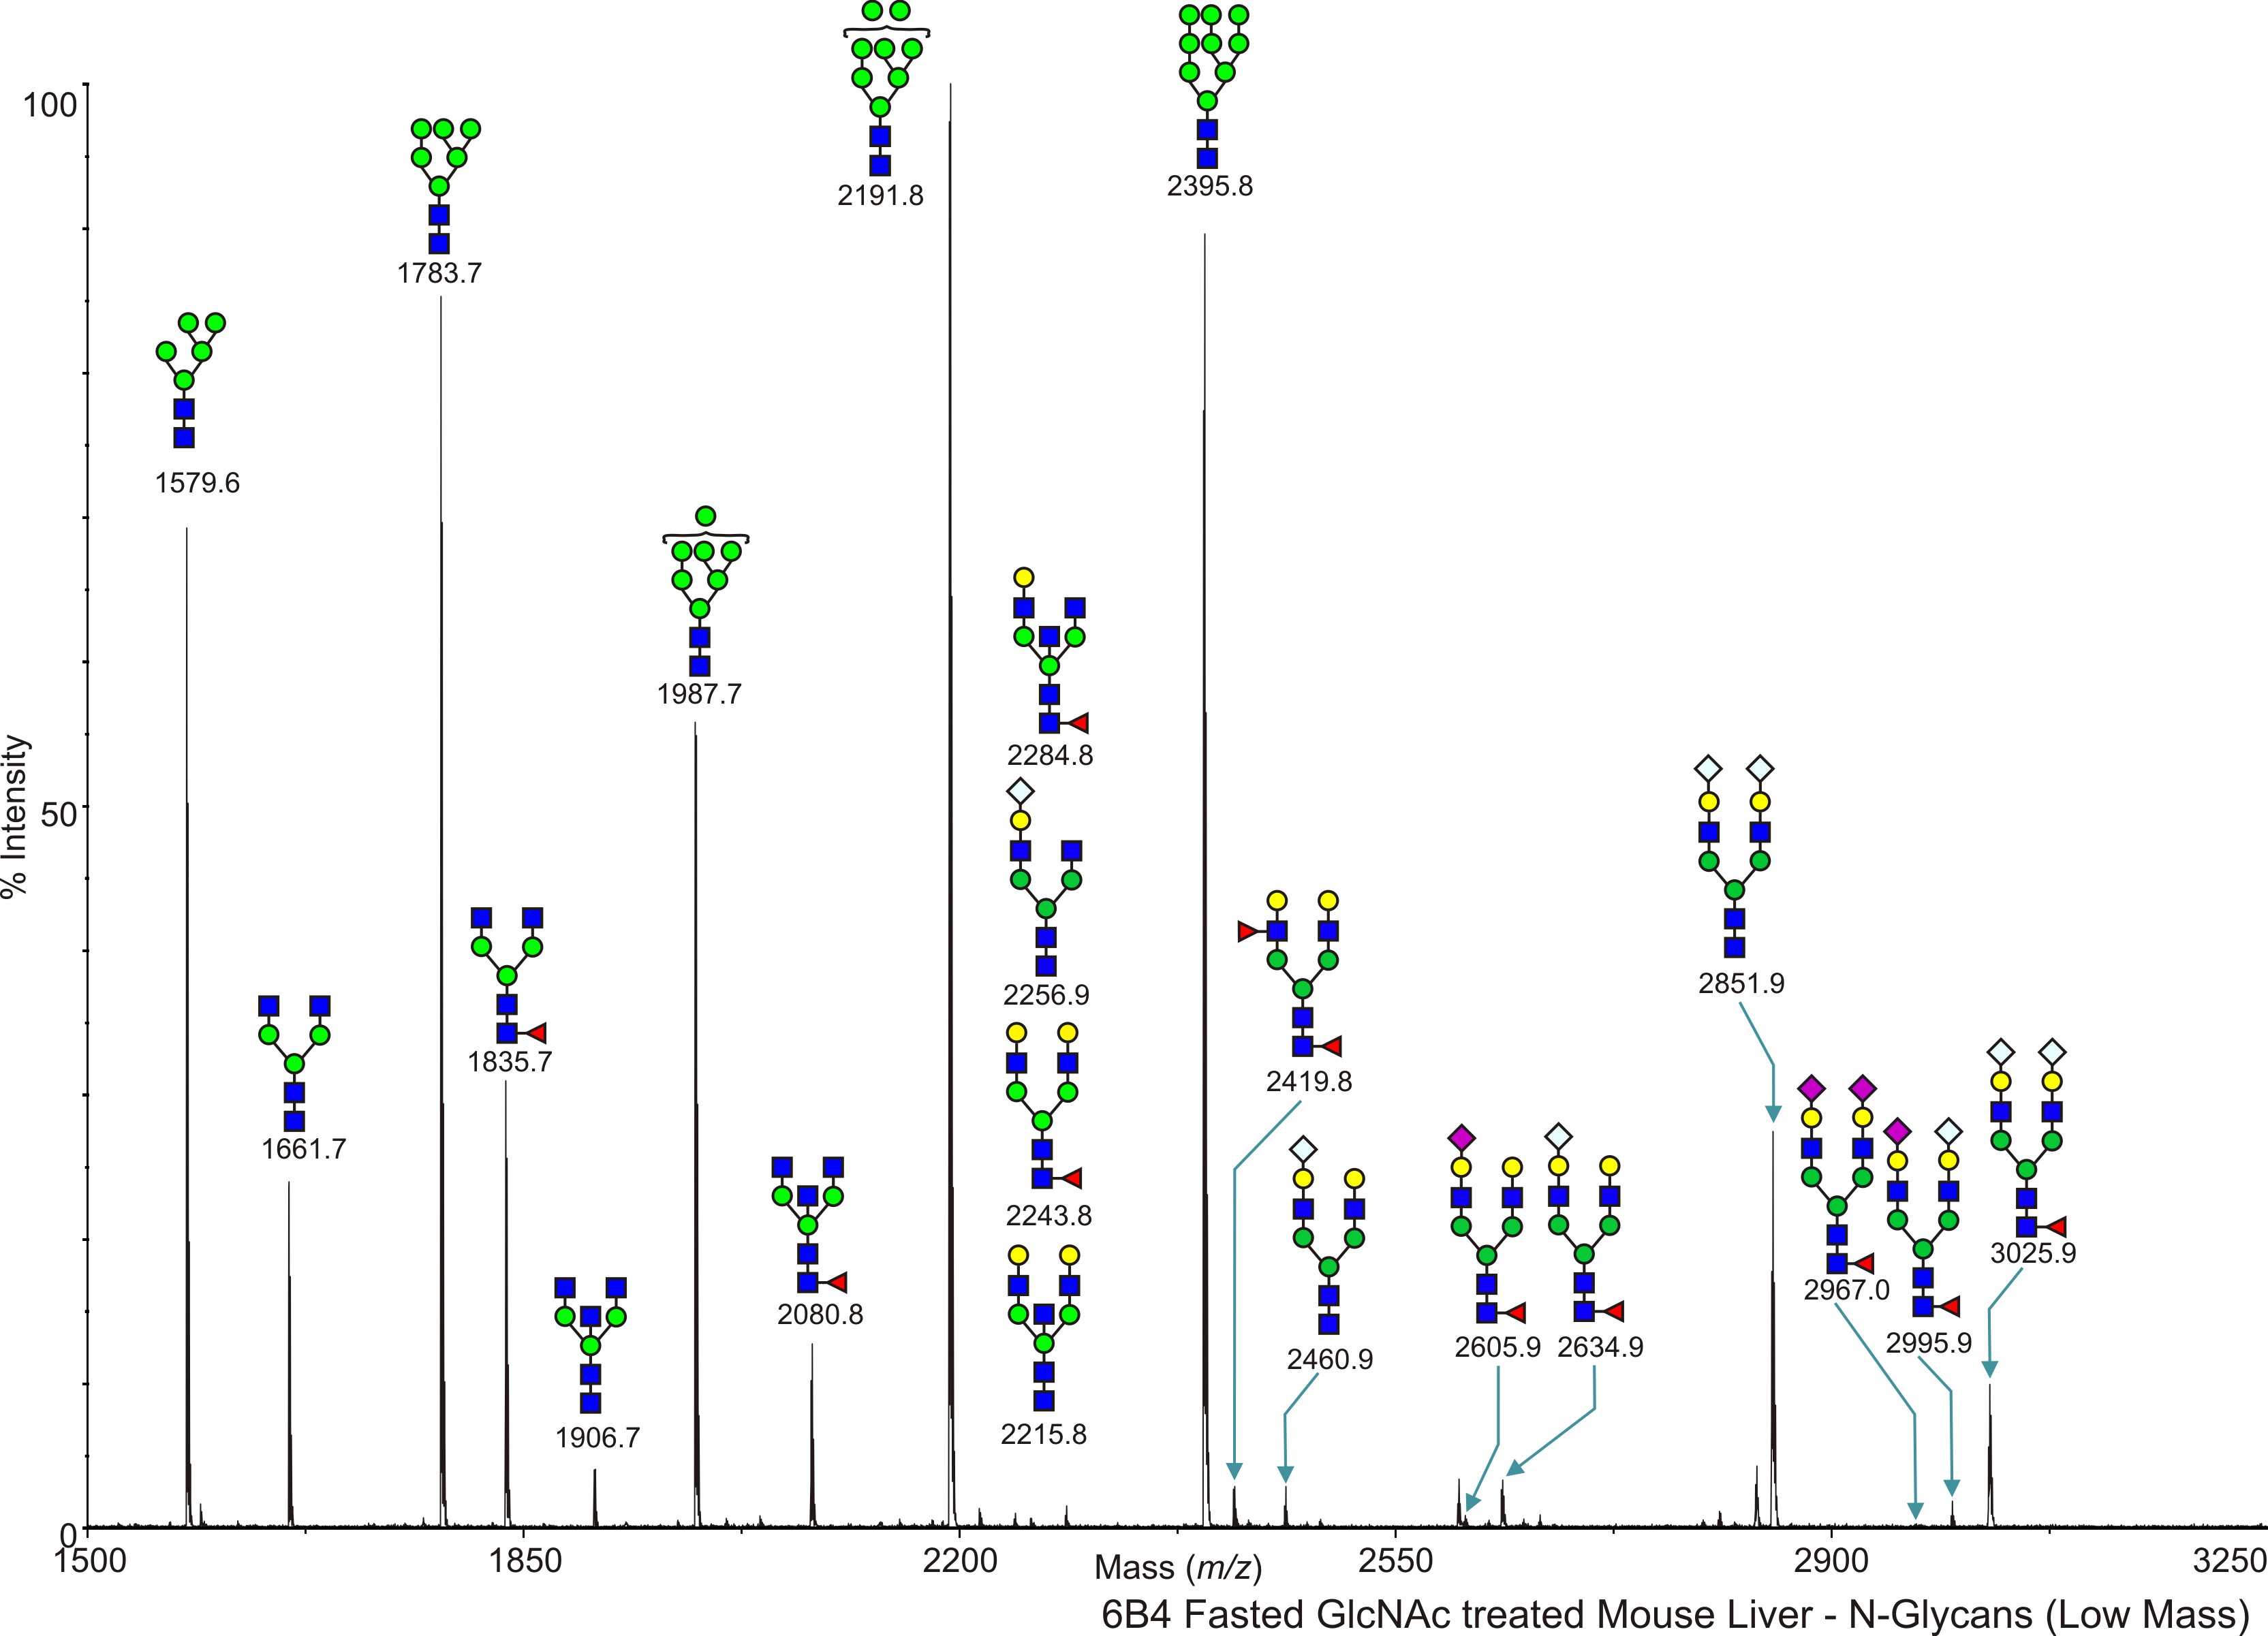
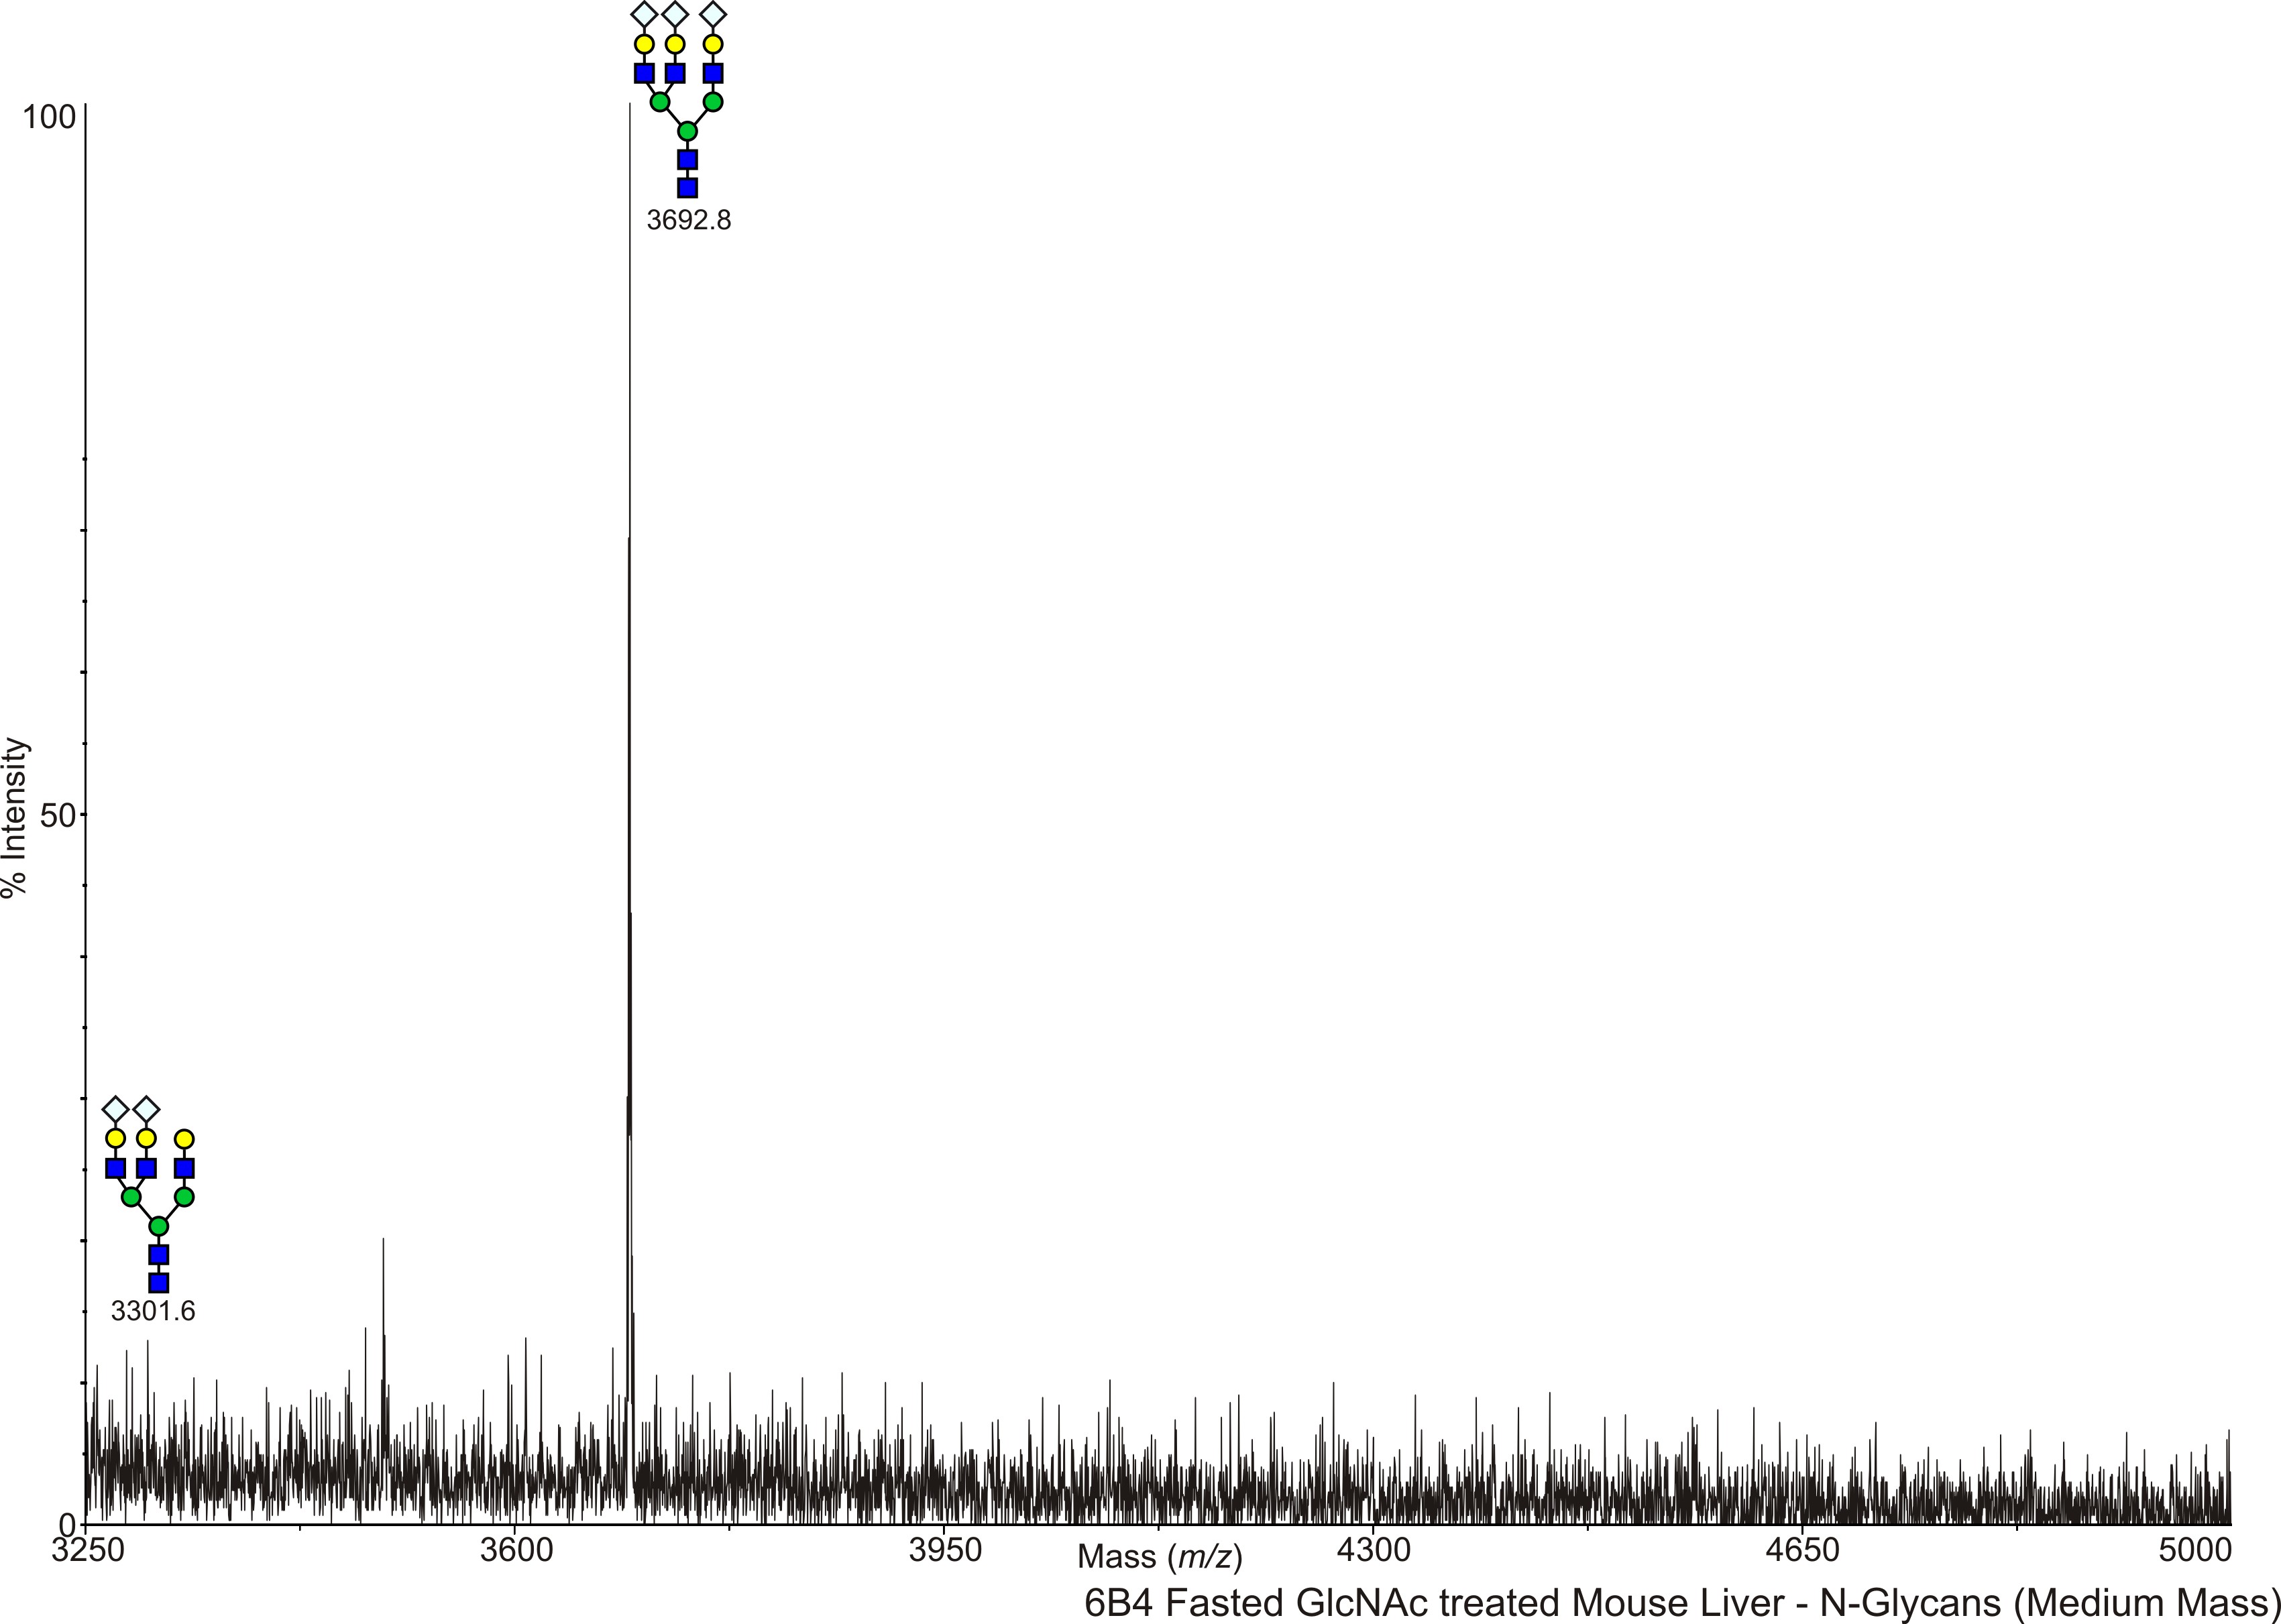
Mouse Liver 6B4 - Fasted high fat diet GlcNAc treated mouse liver, NG N-Linked Dennis, James W. View experimental details      
Annotated file for lower mass range in JPG formatAnnotated file for higher mass range in JPG format Annotated file for lower mass range in PDF formatAnnotated file for higher mass range in PDF format
View Mass Spectrum data as text View Mass Peak file   Interactive Mass Spectrum Viewer